

- Share
Mortgage Lending Patterns in Fourth District Communities as of December 2009
Typically thought of as the better-performing relative of subprime loans, prime loans have suffered from increasing delinquency rates as unemployment rates remain high.

The views expressed in this report are those of the author(s) and are not necessarily those of the Federal Reserve Bank of Cleveland or the Board of Governors of the Federal Reserve System.
The troubling performance of prime loans:
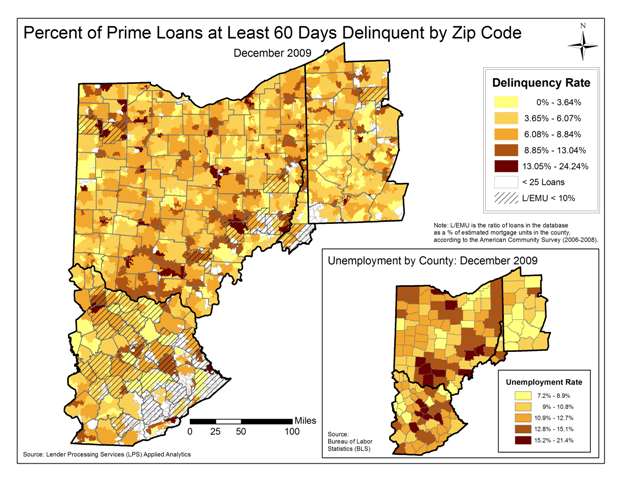
Prime loans at least 60 days delinquent by zip code, as of December 2009
1. Higher unemployment rates are putting upward pressure on delinquency rates, particularly in the rural counties of Kentucky and Ohio.
Figure 1: Percentage of Prime Loans at Least 60 Days Delinquent by Zip Code December 2009
Note: L/EMU is the ratio of loans in the database as a % of estimated mortgage units in the county, according to the American Community Survey (2006 - 2008)
Source: Lender Processing Services (LPS) Applied Analytics
Change in home price index
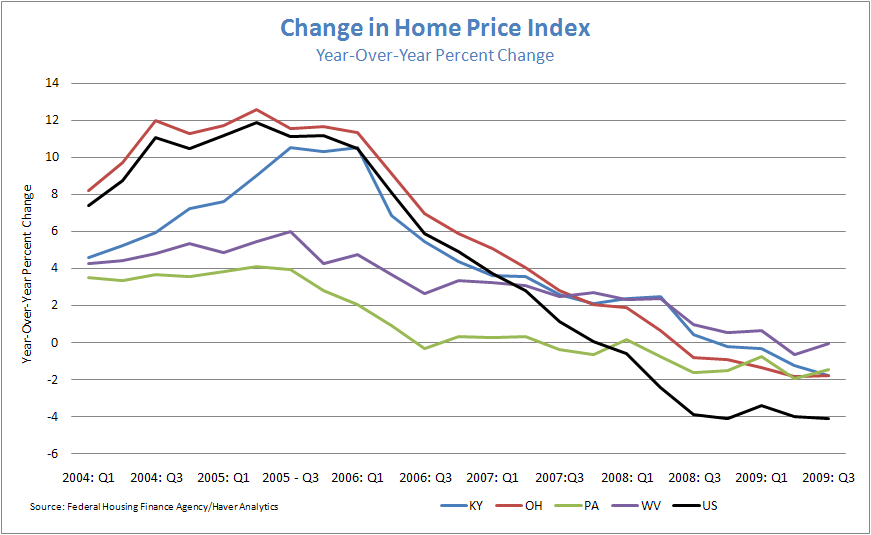
2. Home prices in the 4th District continue to fall, with Ohio experiencing the sharpest drop. On the plus side, the rates at which prices are falling appear to be stabilizing.
Figure 2: Chance in Home Price Index
Year-Over-Year Percent Change
Source: Federal Housing Finance Agency / Haver Analytics
Trends in Prime versus Subprime Foreclosures and Real Estate Owned Properties
3. The percentage of prime loans at least 60 days delinquent continue to increase in all 4th District states. This trend can spur future growth in prime foreclosures.
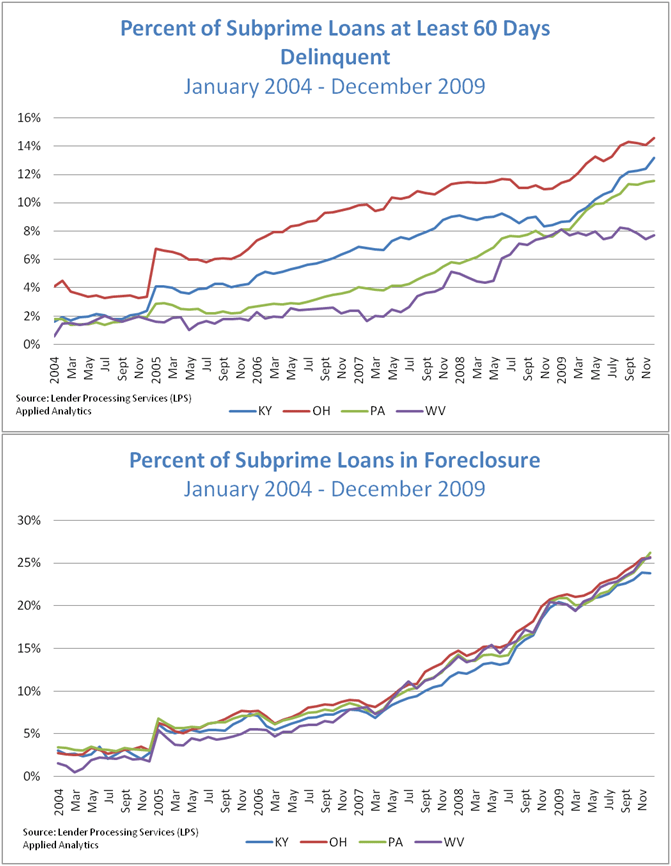
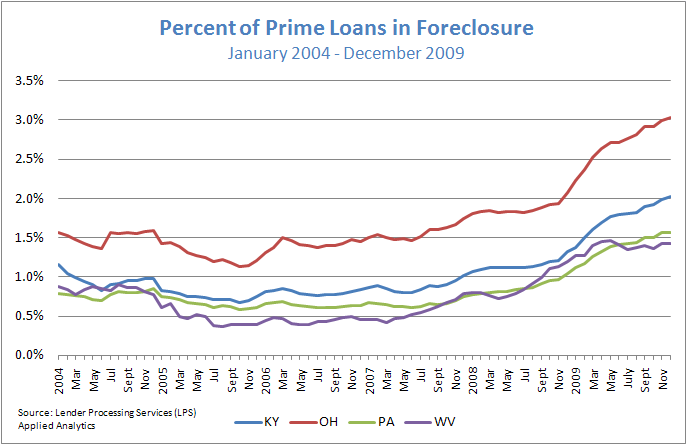
4. The percentage of prime loans in foreclosure is increasing in Kentucky and Ohio, but appears to be moderating in Pennsylvania and West Virginia.
5. Subprime loans are experiencing similar trends, except at substantially higher rates. Charts here.
Figure 3: Percent of Prime Loans at Least 60 Days Delinquent
January 2004 - December 2009
Source: Source: Lender Processing Services (LPS) Applied Analytics
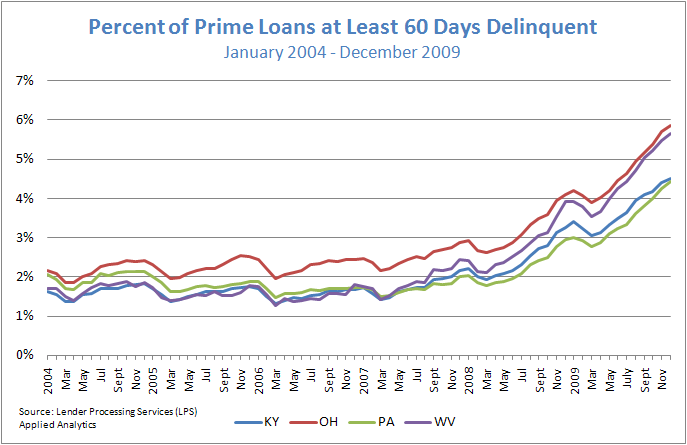
Figure 4: Percent of Prime Loans in Foreclosure
January 2004 - December 2009
Source: Source: Lender Processing Services (LPS) Applied Analytics
| State | County | Loans Serviced | L/EMU | Foreclosure Rate | 60+ Days Delinquent |
|---|---|---|---|---|---|
| OH | Mahoning | 11,845 | 26.63% | 4.89% | 6.82% |
| OH | Trumbell | 11,485 | 29.16% | 4.88% | 6.97% |
| OH | Ashtabula | 5,533 | 31.32% | 4.68% | 6.85% |
| OH | Henry | 800 | 13.83% | 4.50% | 8.50% |
| OH | Highland | 1,292 | 16.88% | 4.41% | 10.06% |
| OH | Cuyahoga | 85,795 | 36.43% | 4.38% | 7.74% |
| OH | Crawford | 1,406 | 17.64% | 4.34% | 9.10% |
| KY | Montgomery | 1,206 | 28.61% | 4.31% | 6.80% |
| OH | Jefferson | 2,131 | 20.45% | 4.18% | 6.47% |
| OH | Defiance | 854 | 10.56% | 4.10% | 7.26% |
Charts correspond to full-state statistics.
Prime loan foreclosure rates by county, December 2009
6. Nine out of the top ten 4th District counties for prime foreclosures are in Ohio.
- Delinquency rates are comprised of a sample of prime loans at least 60 days delinquent.
- At least 70% of county's housing units are in rural areas.
- At least 70% of county's housing units are in urban areas.
- L/EMU: Loans in the database as a % of estimated mortgage units in the county, according to the American Community Survey (2006-2008)
- Source: LPS(Lender Processing Services Inc.) Applied Analytics
These data briefs provide periodic snapshots of mortgage lending activity and foreclosure patterns in our District using the most recent data (check out this detailed, county-specific map of the 4th District). Delinquency and foreclosure data are from LPS. The data include loan level servicing data for both securitized loans and loans held in portfolio from the top 10 residential mortgage servicers in the nation and others. Smaller servicers have less representation.
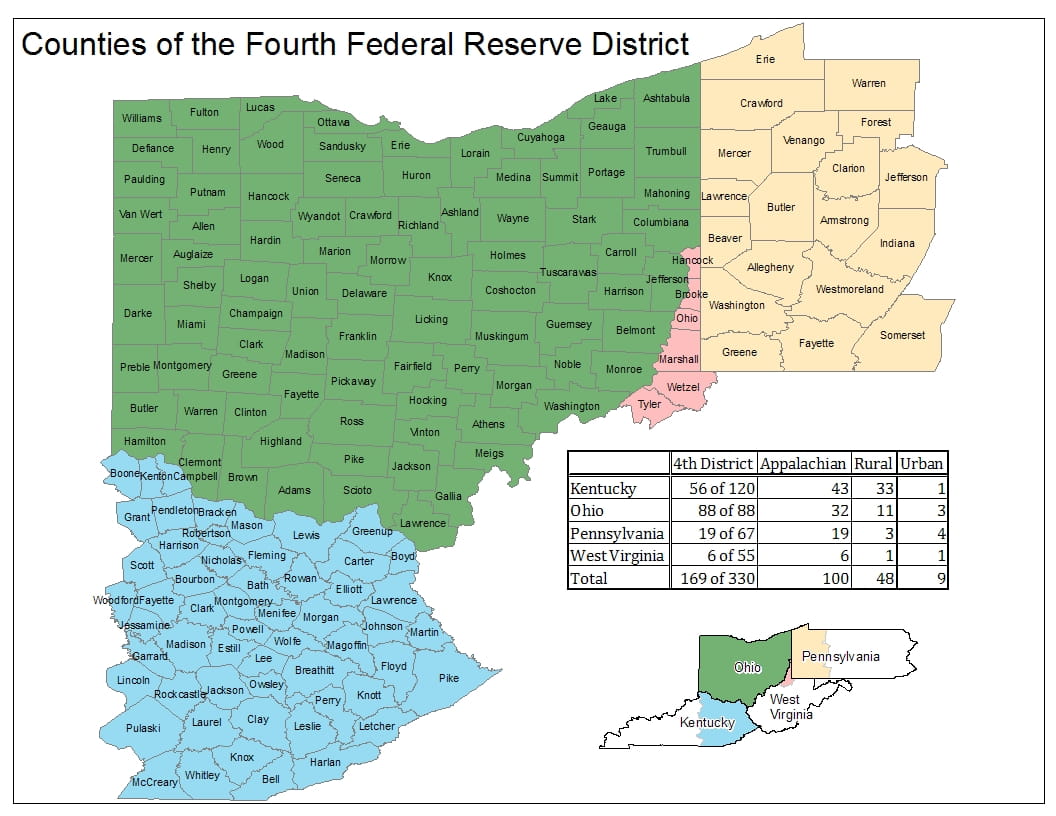