

- Share
Mortgage Lending Patterns in Fourth District Communities as of July 2010
Troubling trends remain in this edition of the data brief. While the percent of loans at least 60 days delinquent has decreased, these loans appear to be flowing into foreclosure, which is ticking up.

The views expressed in this report are those of the author(s) and are not necessarily those of the Federal Reserve Bank of Cleveland or the Board of Governors of the Federal Reserve System.
Troubling Trends:
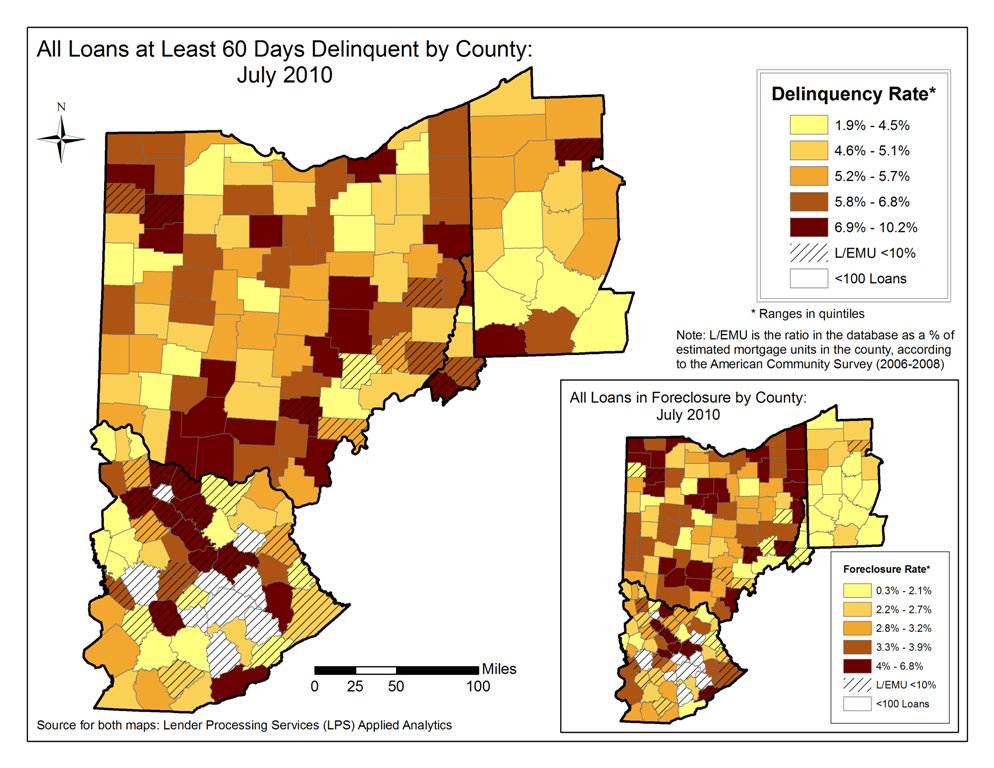
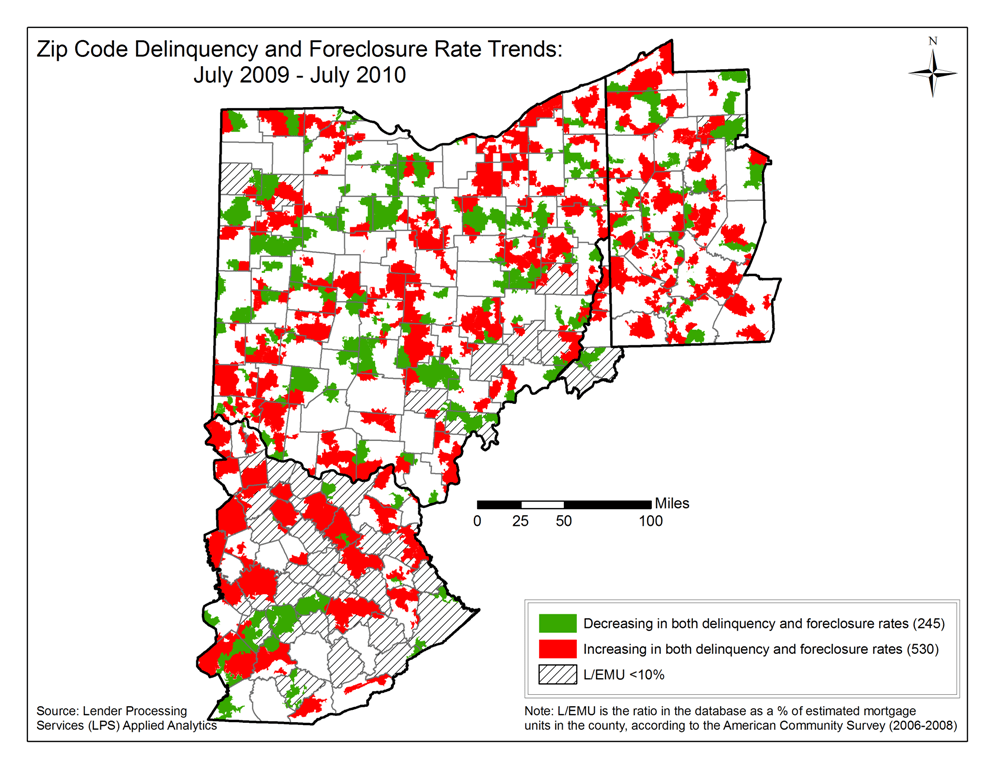
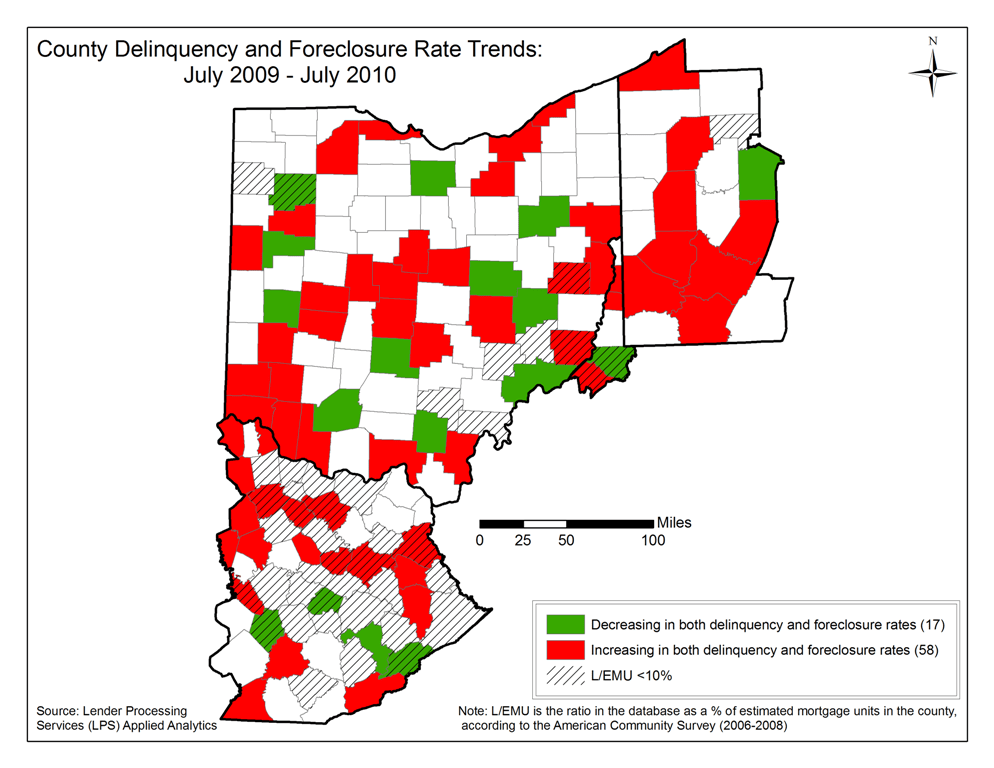
County level maps of all loans at least 60 days delinquent and all loans in foreclosure, as of July 2010
All Loans at Least 60 Days Delinquent by County July 2010
Note: L/EMU is the ratio in the database as a % of estimated mortgage units in the county, according to the American Community Survey (2006 - 2008)
Source for both maps: Lender Processing Services (LPS) Applied Analytics
Trends in the performance of all Fourth District loans
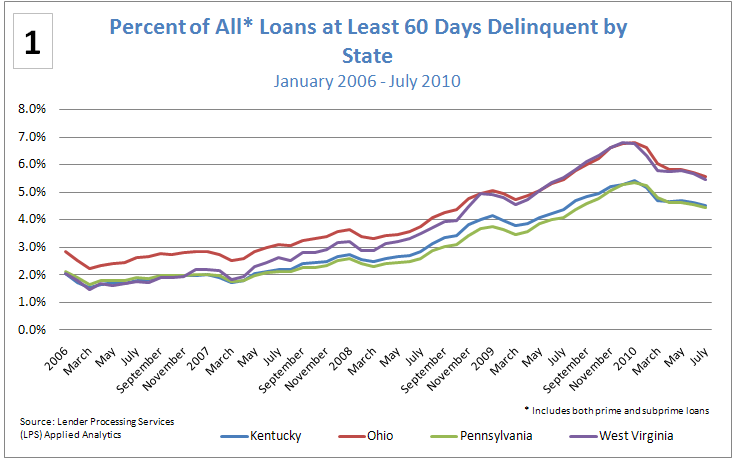
1. The percent of loans at least 60 days delinquent (figure 1) are slightly decreasing in all Fourth District states.
Figure 1: Percent of All* Loans at Least 60 Days Delinquent by State
January 2006 - July 2010
*Includes both prime and subprime loans
Source: Lender Processing Services (LPS) Applied Analytics
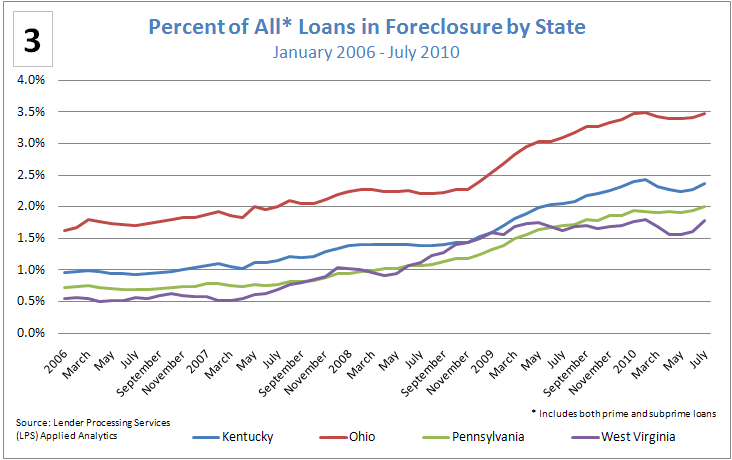
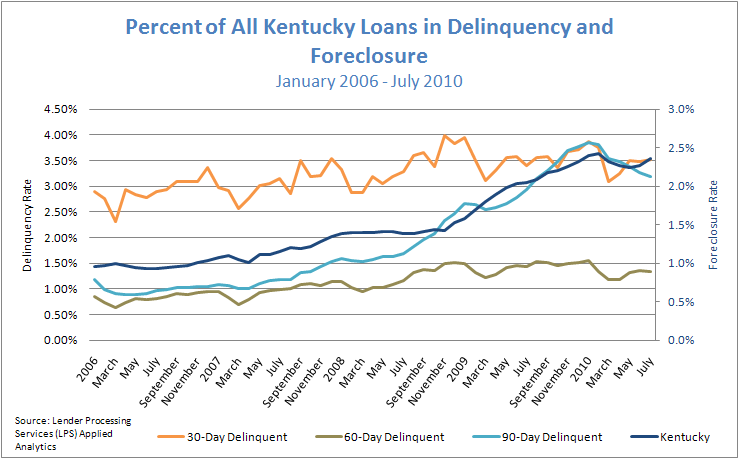
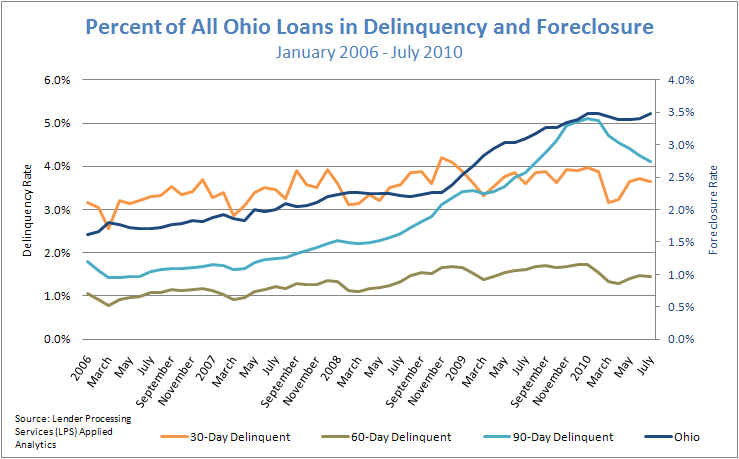
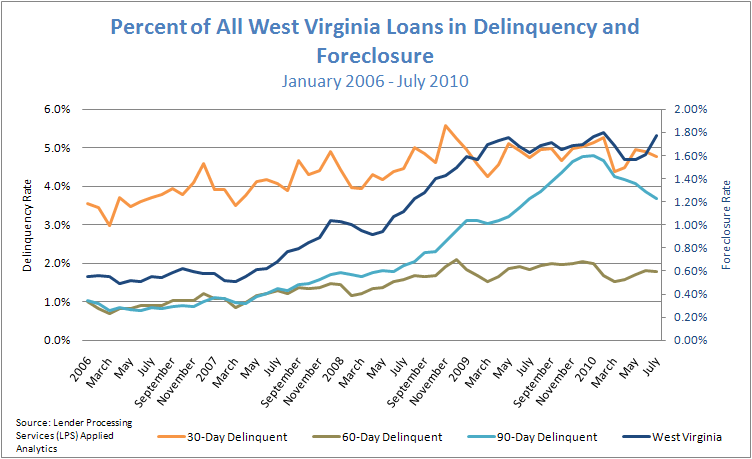
2. However, optimism should be restrained. At face value, decreasing delinquency rates may appear promising, but a closer examination shows that the bulk of the decline is in the loans greater than 90 days delinquent (figure 2). What that implies is that many of those loans are entering foreclosure, as evidenced in the rising foreclosure rates (figure 3). Similar trends are seen across the Fourth District states.
Figure 2: Percent of All Fourth District Loans in Delinquency and Foreclosure
January 2006 - July 2010
Source: Lender Processing Services (LPS) Applied Analytics
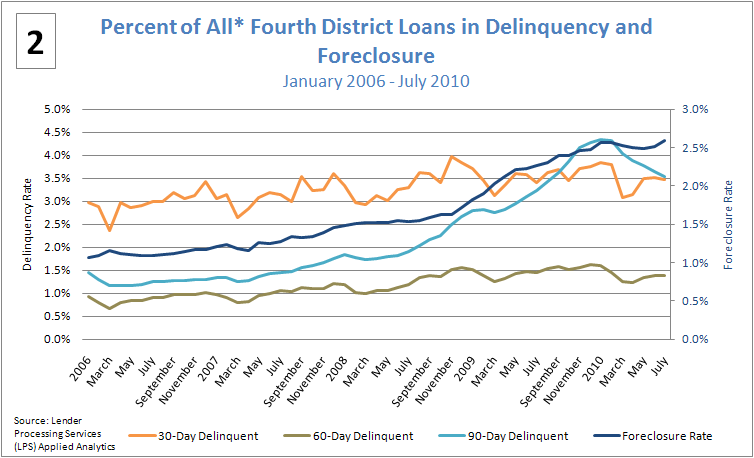
Figure 3: Percent of All* Loans in Foreclosure by State
January 2006 - July 2010
Source: Lender Processing Services (LPS) Applied Analytics
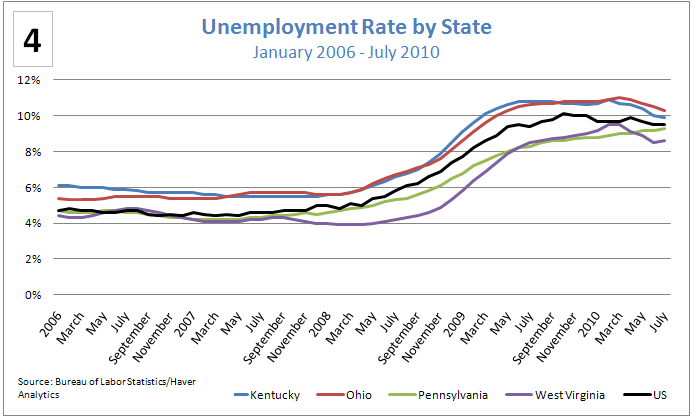
3. High unemployment rates (figure 4) continue to exert pressure on the ability to make timely mortgage payments; one caveat is that these rates do not take into account persons that have stopped looking for work or persons that are underemployed.
Figure 4: Unemployment Rate by State
January 2006 - July 2010
Source: Bureau of Labor Statistics / Haver Analytics
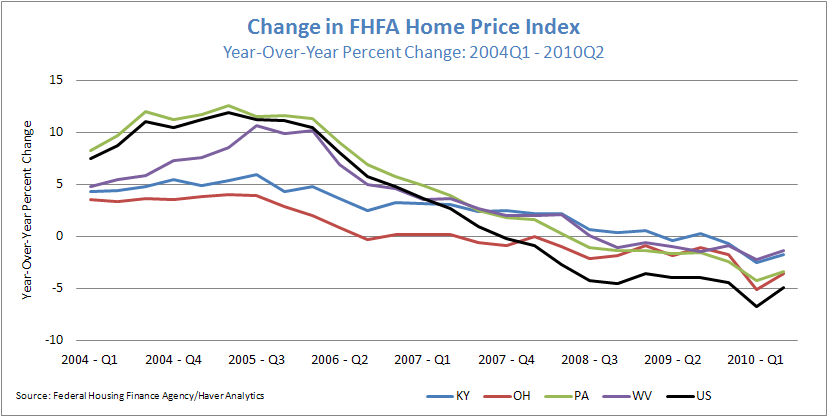
Home Price Index
4. Home prices continue to fall in all Fourth District states as well as across the country according to the FHFA Home Price Index. As home sales plunge to record lows, a continued drop in home prices may occur in order to facilitate home purchases.
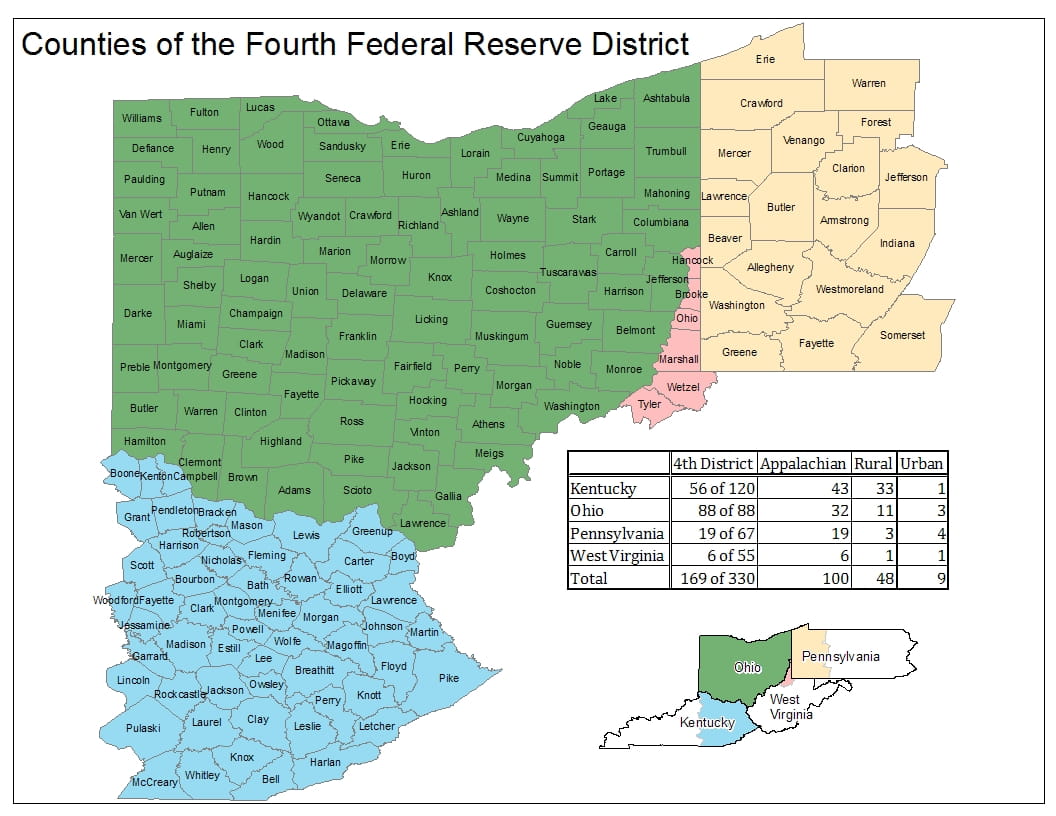
These data briefs provide periodic snapshots of mortgage lending activity and foreclosure patterns in our District using the most recent data (check out this detailed, county-specific map of the 4th District). Delinquency and foreclosure data are from Lender Processing Services (LPS) Applied Analytics. The data include loan level servicing data for both securitized loans and loans held in portfolio from the top 10 residential mortgage servicers in the nation and others. Smaller servicers have less representation.