

- Share
Mortgage Lending Patterns in Fourth District Communities as of October 2009
These data briefs provide periodic snapshots of mortgage lending activity and foreclosure patterns in our district at the state and county level. The 4th Federal Reserve District comprises the state of Ohio, the western third of Pennsylvania, the eastern half of Kentucky, and the northern panhandle of West Virginia. Delinquency and foreclosure data are from LPS. The data include loan level servicing data for both securitized loans and loans held in portfolio from the top 10 residential mortgage servicers in the nation and others. Smaller servicers have less representation.

The views expressed in this report are those of the author(s) and are not necessarily those of the Federal Reserve Bank of Cleveland or the Board of Governors of the Federal Reserve System.
Four things stand out in our analysis of the data available from October 2009:
- Overall, foreclosure rates have continued to rise for both prime and subprime loans, however, rates in West Virginia have moderated.
- Subprime REO levels have fallen considerably over the course of the last year while the rates for prime loans have stayed fairly consistent.
- Ohio continues to have the highest rates of prime and subprime delinquencies as well as prime REO rates.
- MBA numbers showed lower foreclosure rates at the end of the third quarter than LPS data for subprime loans in all four states. However, only Kentucky had higher MBA foreclosure rates than the LPS rates for subprime loans.
We've charted the most recent data in several ways, to show trends, distribution, and a listing of the top and bottom 15 counties. (Check out this detailed, county-specific map of the 4th District.)
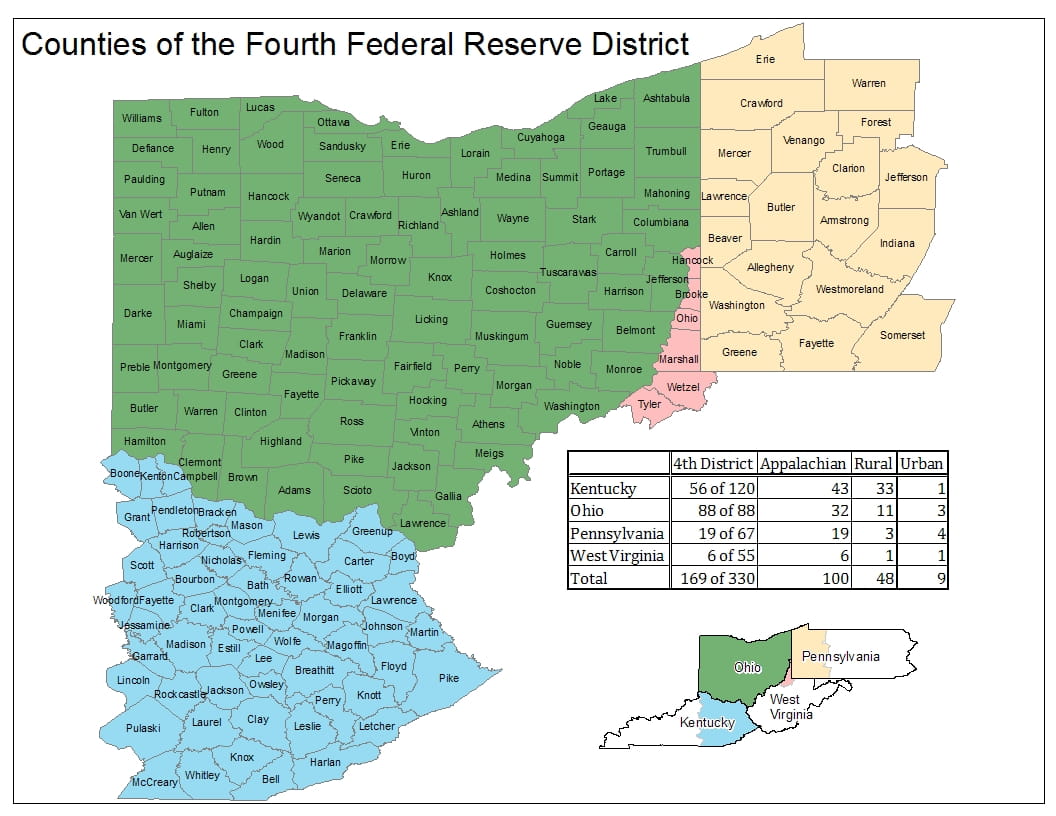
Trends in Prime versus Subprime Foreclosures and Real Estate Owned Properties
Figure 1: Percent of Loans that were in Foreclosure (FC) and Real Estate Owned (REO) by Month
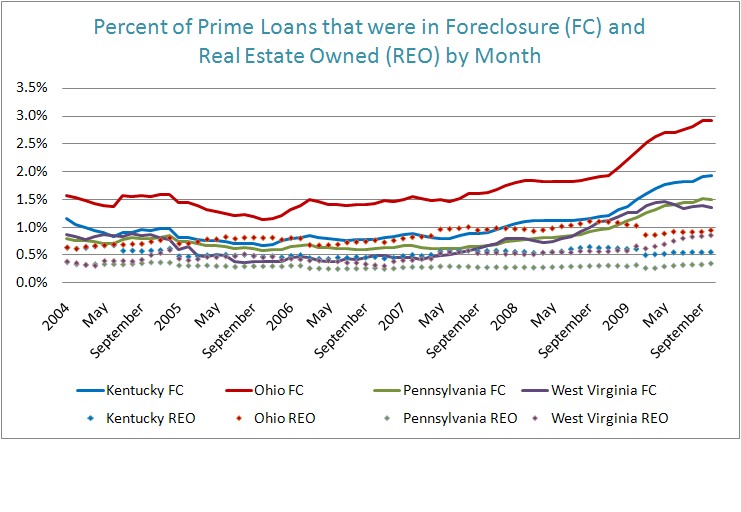
Figure 2: Percent of Subprime Loans that were in Foreclosure (FC) and Real Estate Owned (REO) by Month
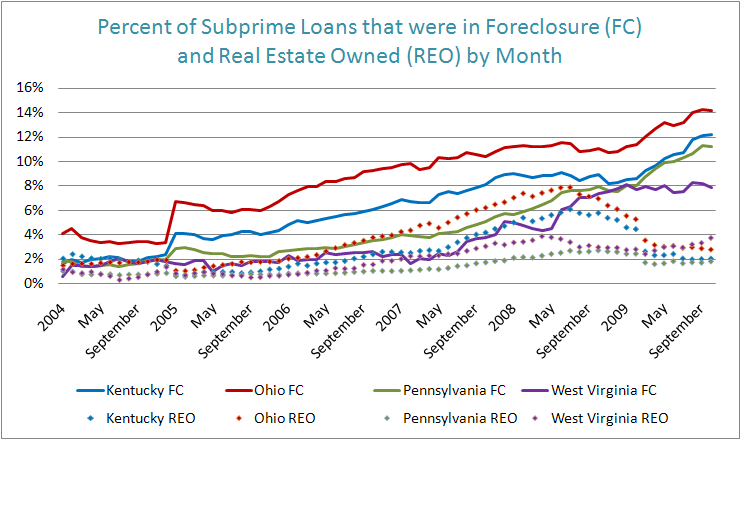
Charts correspond to full-state statistics.
*Please see this previous issue of Mortgage Lending Patterns for an explanation of the differences between LPS and MBA data.
Delinquency Rates by County, October 2009
| State | County | Loans Serviced | L/EMU | Delinquency |
|---|---|---|---|---|
| OH | Highland | 1,371 | 17.91% | 14.29% |
| OH | Pike | 626 | 17.04% | 13.58% |
| OH | Henry | 841 | 14.54% | 13.55% |
| OH | Allen | 2,893 | 15.62% | 13.48% |
| OH | Mahoning | 12,644 | 28.42% | 13.39% |
| OH | Cuyahoga | 90,796 | 38.55% | 13.25% |
| OH | Coshocton | 917 | 15.28% | 13.19% |
| OH | Trumbell | 12,193 | 30.95% | 13.10% |
| OH | Crawford | 1,509 | 18.93% | 13.05% |
| WV | Brooke | 673 | 17.24% | 12.78% |
| OH | Fayette | 927 | 18.31% | 12.73% |
| OH | Adams | 749 | 18.36% | 12.69% |
| OH | Brown | 2,092 | 23.90% | 12.48% |
| OH | Jackson | 825 | 15.96% | 12.48% |
| OH | Ashtabula | 5,869 | 33.22% | 12.35% |
| State | County | Loans Serviced | L/EMU | Delinquency |
|---|---|---|---|---|
| KY | Boone | 13,196 | 51.15% | 6.26% |
| PA | Washington | 16,472 | 42.11% | 6.25% |
| KY | Laurel | 1,956 | 23.40% | 6.23% |
| PA | Westmoreland | 29,840 | 44.24% | 6.12% |
| WV | Ohio | 1,830 | 26.22% | 6.12% |
| PA | Allegheny | 108,455 | 49.35% | 5.97% |
| PA | Somerset | 3,669 | 31.26% | 5.91% |
| KY | Scott | 4,759 | 56.60% | 5.85% |
| OH | Mercer | 2,025 | 28.95% | 5.83% |
| OH | Athens | 1,877 | 24.93% | 5.71% |
| KY | Rowan | 676 | 23.02% | 5.62% |
| OH | Delaware | 21,226 | 53.84% | 5.21% |
| KY | Fayette | 28,692 | 53.21% | 4.61% |
| PA | Butler | 16,180 | 45.90% | 4.42% |
| KY | Woodford | 2,409 | 45.38% | 4.19% |
- Delinquency rates are comprised of an unweighted sample of both prime and subprime loans at least 60 days delinquent, including those in foreclosure.
- At least 70% of county's housing units are in rural areas.
- At least 70% of county's housing units are in urban areas.
- L/EMU: Loans in the database as a % of estimated mortgage units in the county, according to the American Community Survey (2006-2008)
- Source: LPS(Lender Processing Services Inc.) Applied Analytics
Distribution by County of Loans 60 Days Delinquent or in Foreclosure
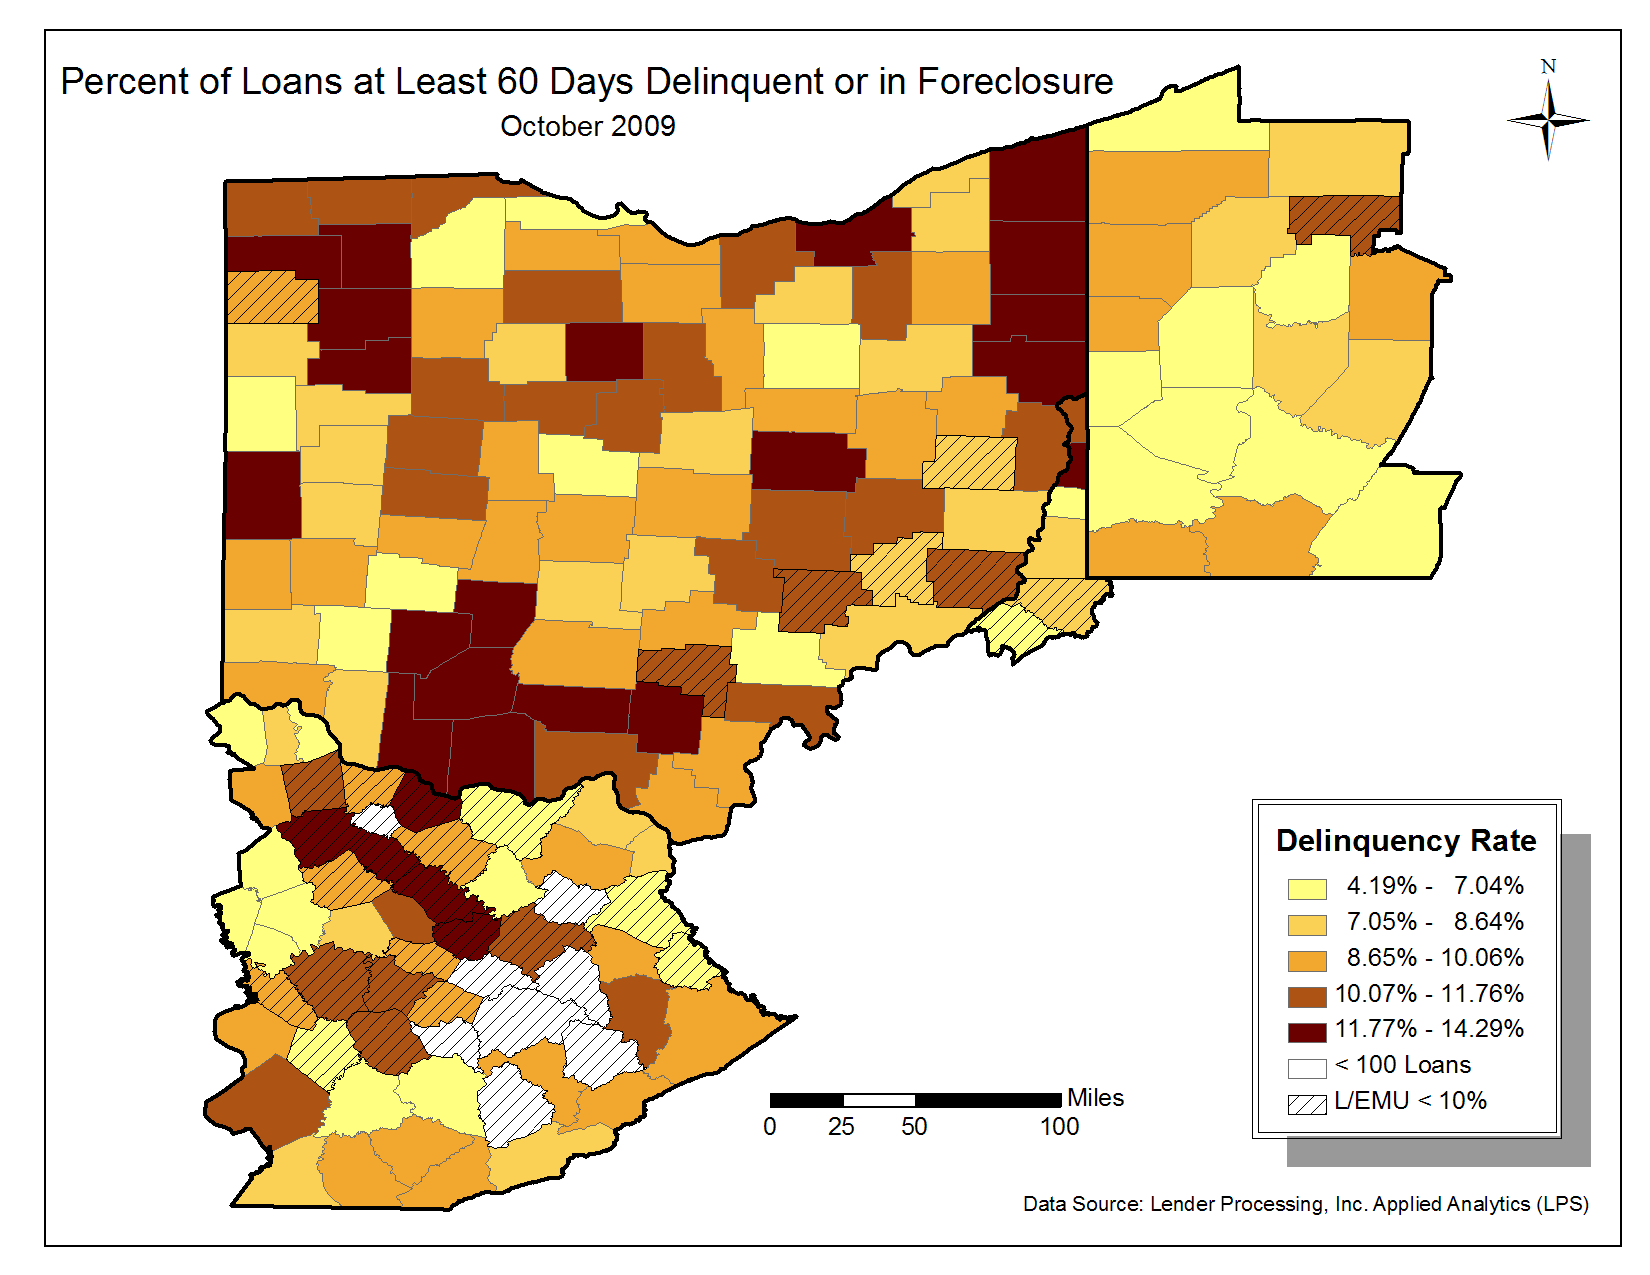
Figure 5: Percent of Loans at Least 60 Days Delinquent or in Foreclosure October 2009
Delinquency Rates by County, as of October 2009
Ohio relinquished complete control of the top 15 list with the addition of Brooke County, WV. Jackson County, OH also joined the high delinquency list for all loans while Putnam, OH and Defiance, OH vacated. The bottom 15 list was unchanged. Delinquency rates in both the top and bottom 15 counties continue to increase; the top 15 now encompasses rates from almost 12.50% to over 14% while the bottom 15 goes from over 4% to over 6%. Note that the 15 counties with the highest delinquency rates tend to have lower L/EMU values than the 15 counties with the lowest delinquency rates.