

- Share
Mortgage Lending Patterns in Fourth District Communities as of December 2010
The 8th edition of the data brief finds that the glut of loans greater than 90 days delinquent is subsiding from its high in early 2010 as they naturally progress into foreclosure. But the increase in the foreclosure rate does not fully account for the decline in the rate of loans greater than 90 days delinquent; therefore, additional reasons must be at work. Find out what some of these are, as well as access charts and maps detailing delinquency, foreclosure rates, and more in the Fourth District states.

The views expressed in this report are those of the author(s) and are not necessarily those of the Federal Reserve Bank of Cleveland or the Board of Governors of the Federal Reserve System.
Trends in the performance of all loans in Fourth District states
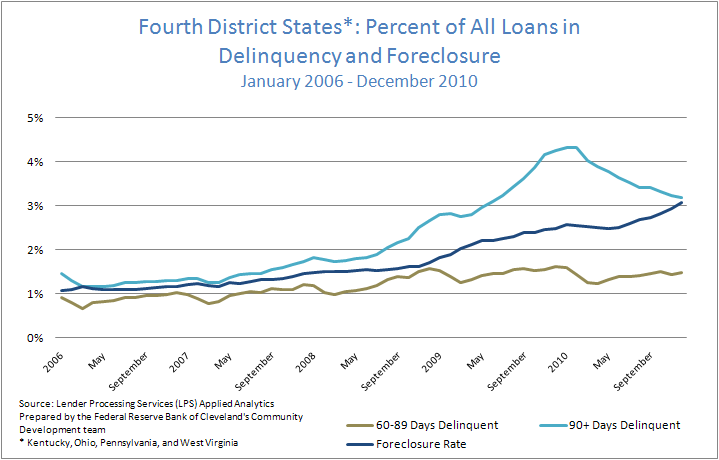
1. The glut of loans greater than 90 days delinquent is finally subsiding from its high in early 2010. While the process of loans moving from 60 to 90 days delinquent happens automatically, that isn't necessarily the case when loans exit the 90+ days delinquent pool.
There are several reasons for this. Due to the robo-signing controversy, some of the largest banks temporarily delayed foreclosures during the 4th quarter of 2010, creating a foreclosure backlog that is only now working itself out. This has been amplified by constraints in servicer capacity to handle the large volume of delinquent loans, legal challenges, and loan modification activity.
The recent decline in the stock of loans greater than 90 days delinquent can be attributed in part to the natural progression of these loans moving into foreclosure. But the increase in the foreclosure rate does not fully account for the decline in the rate of loans greater than 90 days delinquent; therefore, additional reasons must be at work. A few of these are short sales, deeds in lieu, bankruptcy filings, and completed loan modifications, which all cause loans to exit the 90+ days delinquent pool without entering foreclosure.
It is important to note that while loans greater than 90 days delinquent are declining, the percentage of loans 60-89 days delinquent has remained relatively constant and will continue to exert upward pressure on the foreclosure rate.
Figure 1: Fourth District States*: Percent of All Loans in Delinquency and Foreclosure
*Kentucky, Ohio, Pennsylvania, and West Virginia
Source: Lender Processing Services (LPS) Applied Analytics Prepared by the Federal Reserve Bank of Cleveland's Community Development team
* Kentucky, Ohio, Penssylvania, and West Virginia
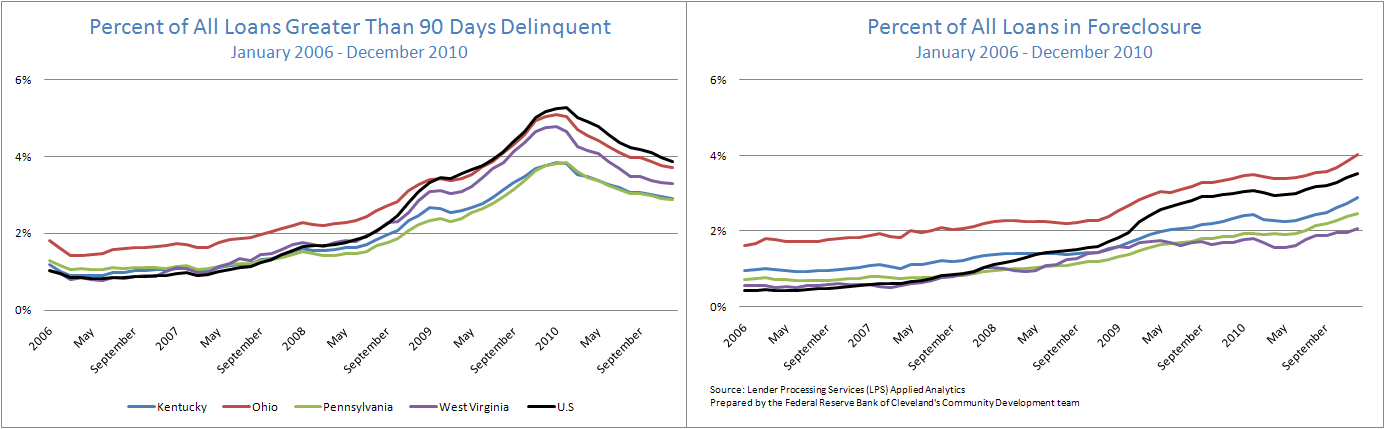
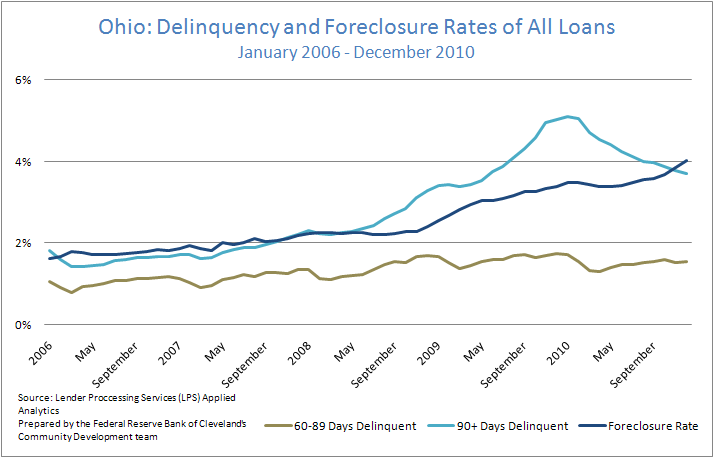
2. Ohio continues to be a District leader in both the percentage of loans greater than 90 days delinquent and the foreclosure rate. In fact, Ohio’s foreclosure rate is significantly higher than the national rate.
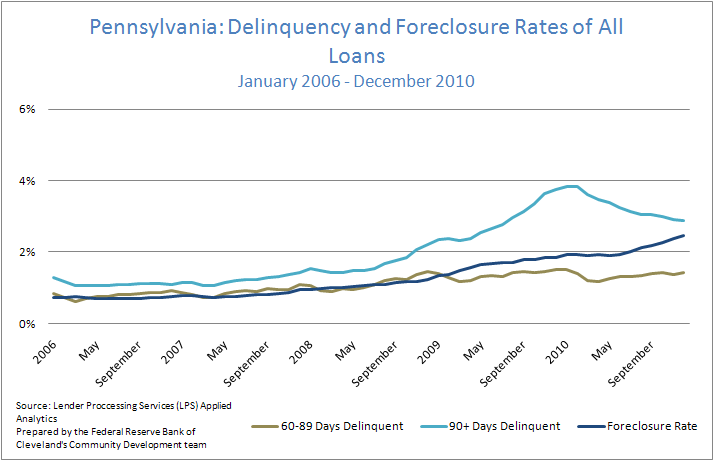
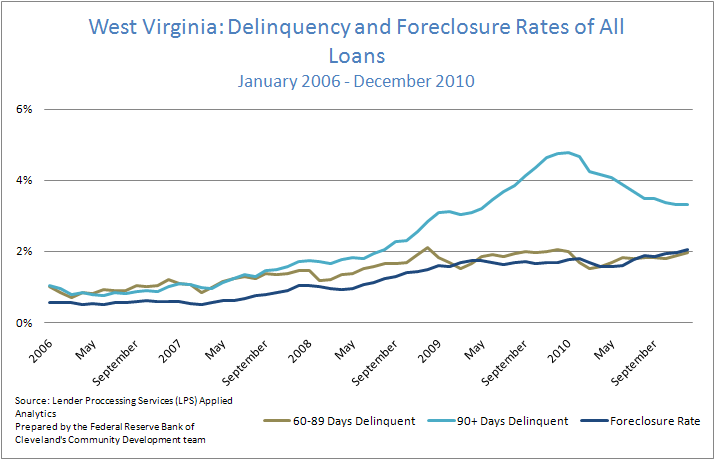
Figure 2: Percent of All Loans Greater Than 90 Days Delinquent
January 2006 - December 2010
Figure 3: Percent of All Loans in Foreclosure
January 2006 - December 2010
Source: Lender Processing Services (LPS) Applied Analytics Prepared by the Federal Reserve Bank of Cleveland's Community Development team
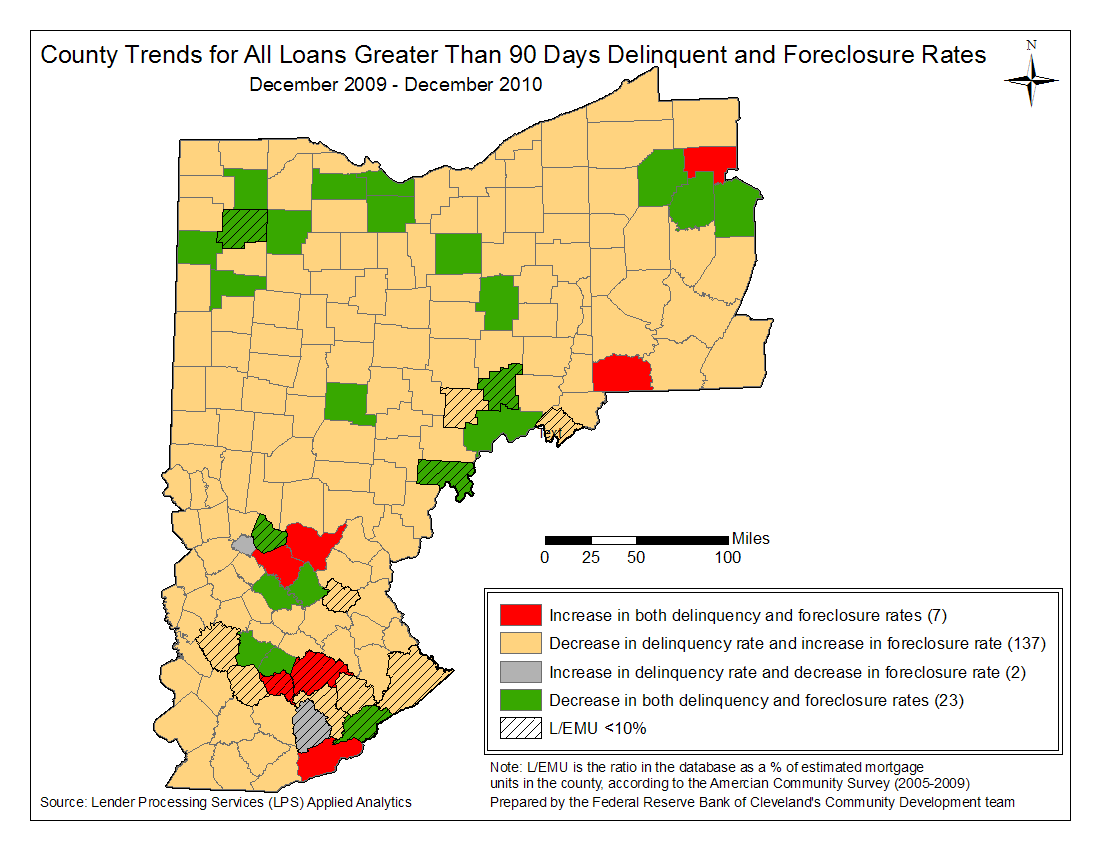
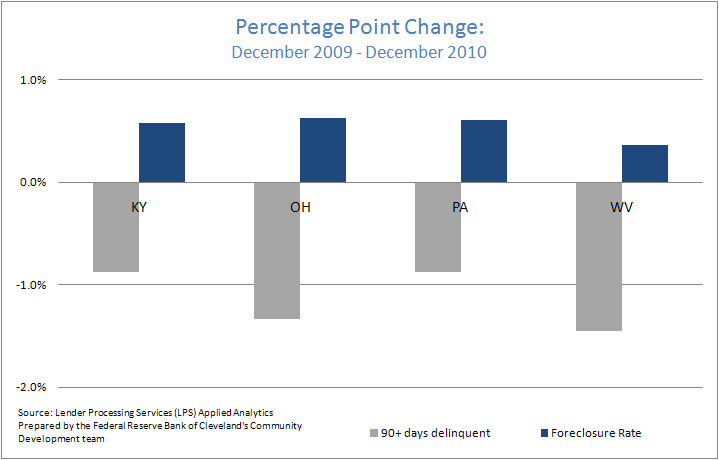
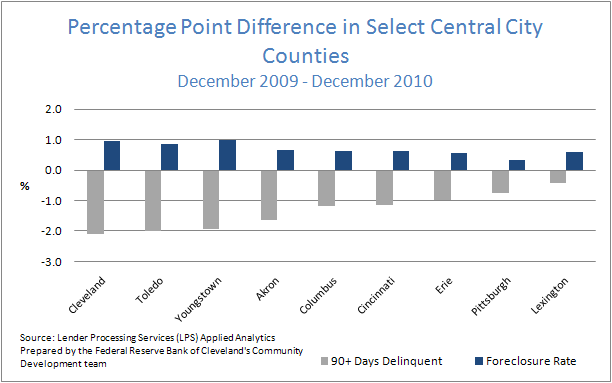
3. Few Fourth District counties are experiencing decreases in both delinquency and foreclosure rates; the ones that are do not include any of the major population centers. This trend mirrors what is seen in the above charts.
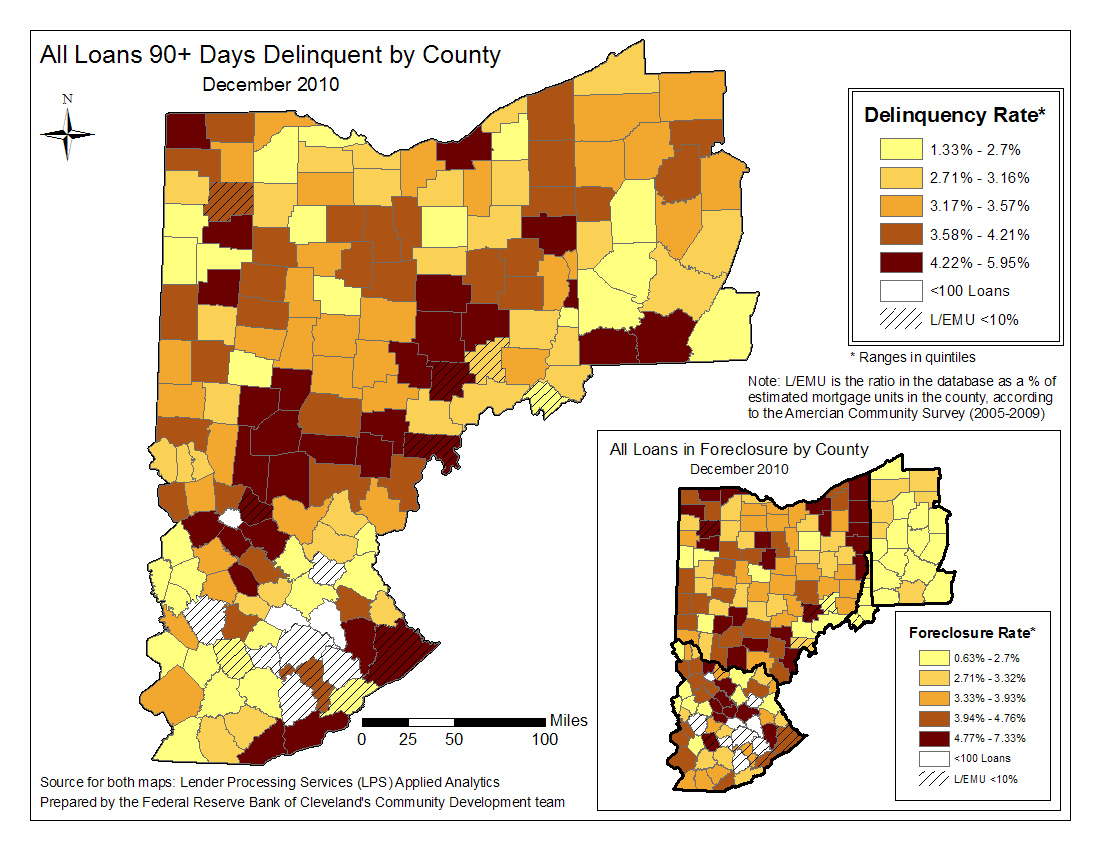
Figure 4: County Trends for All Loans Greater Than 90 Days Delinquent and Foreclosure Rates
December 2009 - December 2010
Note: L/EMU is the ratio in the database as a % of estimated mortgage units in the county according to the American Community Survey (2005 - 2009). Prepared by the Federal Reserve Bank of Cleveland's Community Development team
Source: Lender Processing Services (LPS) Applied Analytics
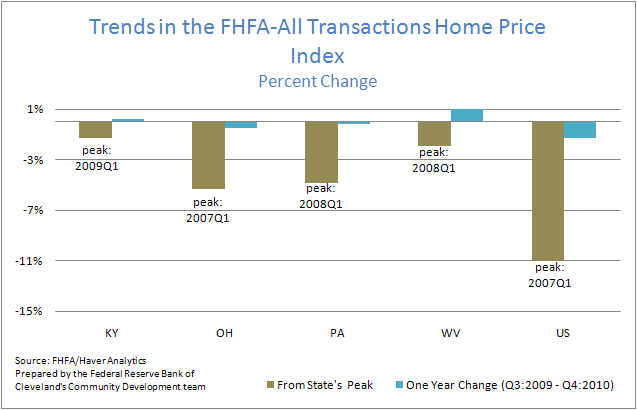
4. Home prices have yet to stabilize in the Fourth District states, although Kentucky and West Virginia have seen slight gains from a year ago. In terms of the difference from their peaks, Ohio’s home values have not only dropped the most in the Fourth District, they have also been falling for the longest period.
Figure 5: Trends in the FHFA-All Transactions Home Price Index
Percent Change
Note: FHFA/Haver Analytics. Prepared by the Federal Reserve Bank of Cleveland's Community Development team
County level map of all loans greater than 90 days delinquent and in foreclosure, as of December 2010
Figure 6: Trends in the FHFA-All Transactions Home Price Index
Percent Change
Note: FHFA/Haver Analytics. Prepared by the Federal Reserve Bank of Cleveland's Community Development team
Charts
Percentage point change in loans greater than 90 days delinquent and in foreclosure
December 2009 - December 2010
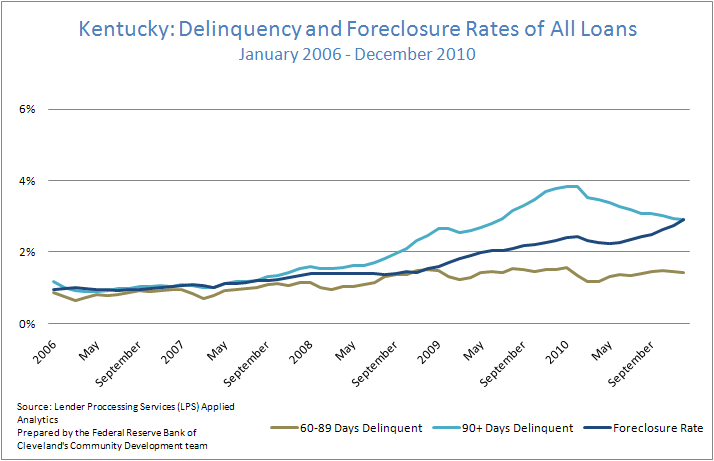
Delinquency and foreclosure rate charts for all Fourth District states
January 2006 - December 2010
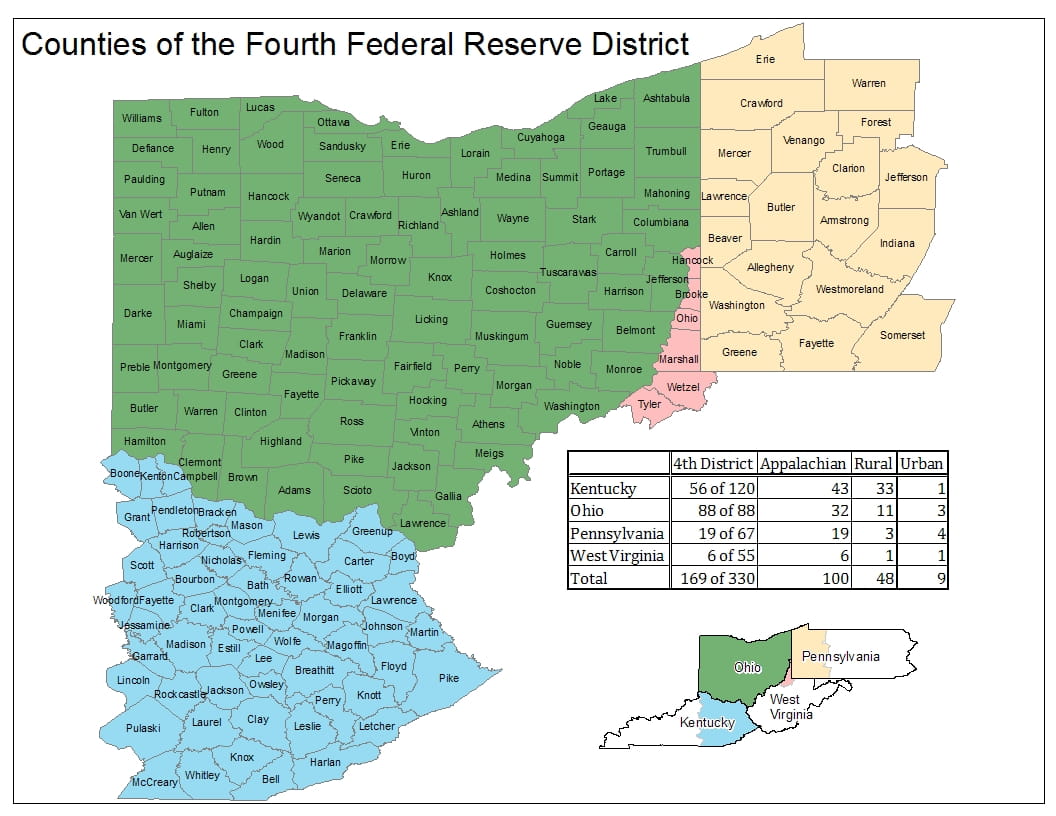
These data briefs provide periodic snapshots of mortgage lending activity and foreclosure patterns in our District using the most recent data (check out this detailed, county-specific map of the 4th District). Delinquency and foreclosure data are from Lender Processing Services (LPS) Applied Analytics. The data include loan level servicing data for both securitized loans and loans held in portfolio from the top 10 residential mortgage servicers in the nation and others. Smaller servicers have less representation.