

- Share
Mortgage Lending Patterns in Fourth District Communities as of December 2011
This edition finds that compared to a year ago many counties in Ohio and West Virginia have seen decreases in both delinquency and foreclosure rates, while counties in Kentucky and Pennsylvania have seen increases in both.

The views expressed in this report are those of the author(s) and are not necessarily those of the Federal Reserve Bank of Cleveland or the Board of Governors of the Federal Reserve System.
Map 1
Map 1 examines county trends in the 4th District over two time periods: December 2009-December 2010 (inset) and December 2010-December 2011. Two distinct patterns emerge when comparing them. First, more counties in Ohio are experiencing a decrease in both delinquency and foreclosure rates (counties in green). Second, more counties in Kentucky are exhibiting an increase in both delinquency and foreclosure rates (counties in red).
County Trends for All Loans 90+ Days Delinquent and in Foreclosures: December 2010-December 2011
Source: Lender Processing Services (LPS) Applied Analytics
Note: L/EMU is the ration in the database as a % of estimated mortgage units in the country, according to the American Community Survey (2005-2009)
Prepared by the Federal Reserve Bank of Cleveland's Community Development Team
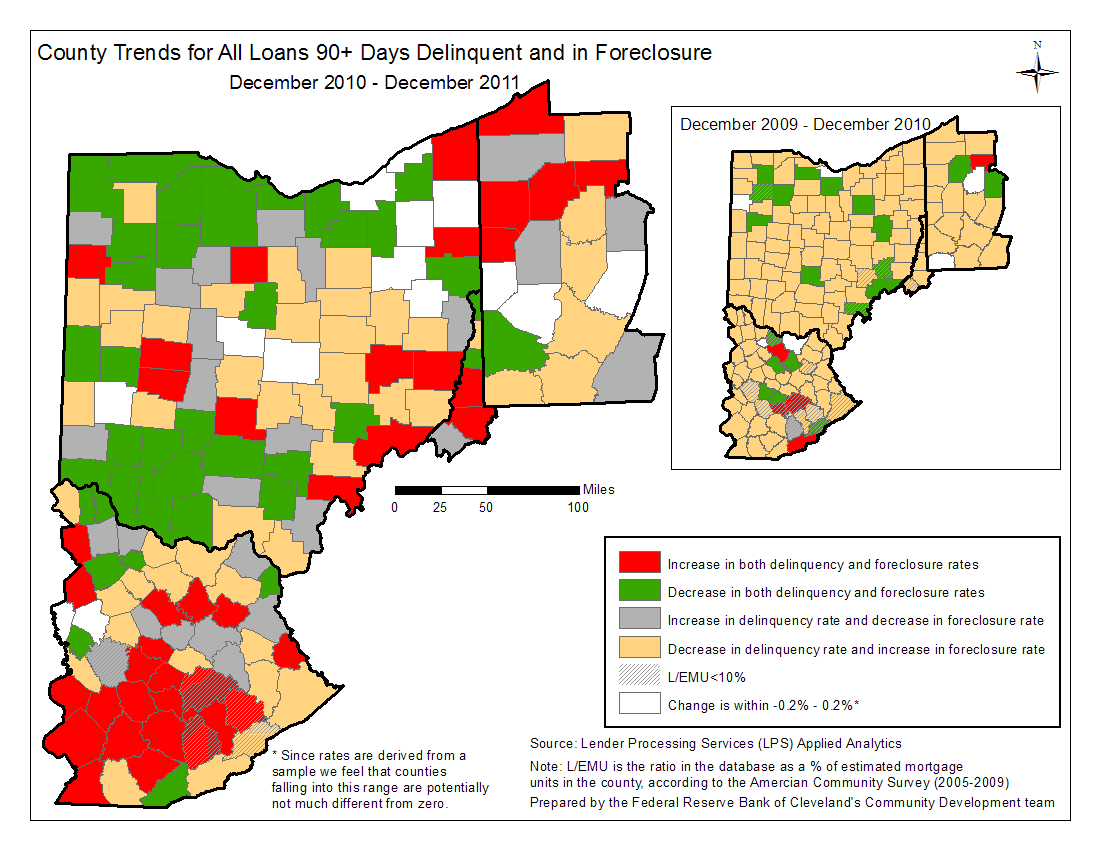
Figure 2
Figure 2 shows that the rate of loans at least 90 days delinquent ceased its decreasing trend at the beginning of 2011, across the District’s states. In fact, we see a modest increase in rates, particularly in Ohio and Pennsylvania. Once 2012 first quarter data is available, it will be clearer whether this recent increase is a typical end of year spike observed in previous years or if it signals deteriorating conditions in trends.
The Past 5 Years: Percent of All Loans Greater Than 90 Days Delinquent: December 2006-December 2011
Source: Lender Processing Services (LPS) Applied Analytics
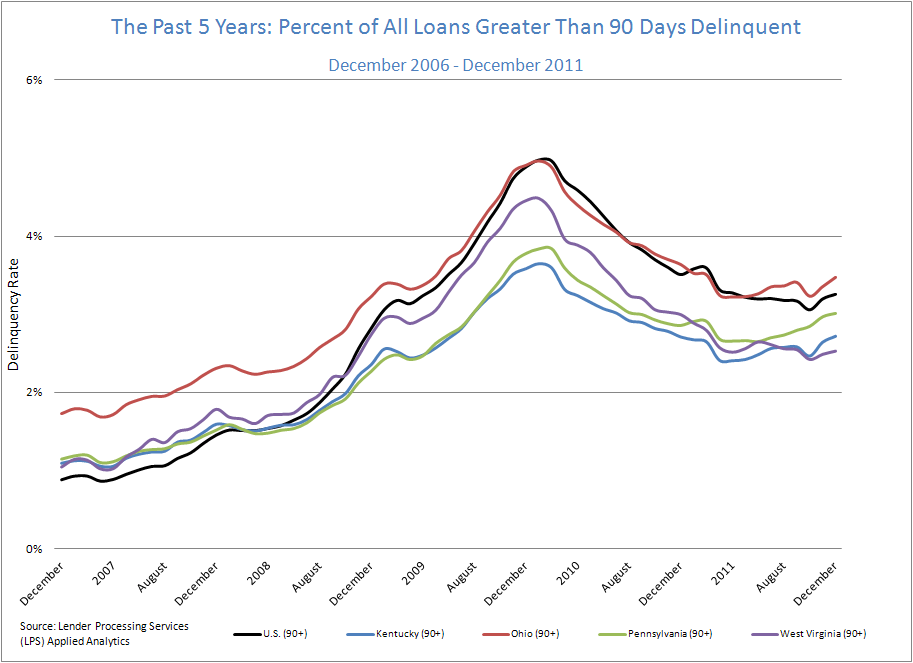
Figure 3
Figure 3 examines foreclosure rate trends for Fourth District states and the nation. Rates remain elevated, yet steady.
Comparing both delinquency and foreclosure trends to those of one year ago (as of December 2010) indicates that Ohio and West Virginia have seen decreases in both delinquency and foreclosure rates, while Kentucky and Pennsylvania have seen increases in both.
The Past 5 Years: Percent of All Loans in Foreclosure: December 2006-December 2011
Source: Lender Processing Services (LPS) Applied Analytics
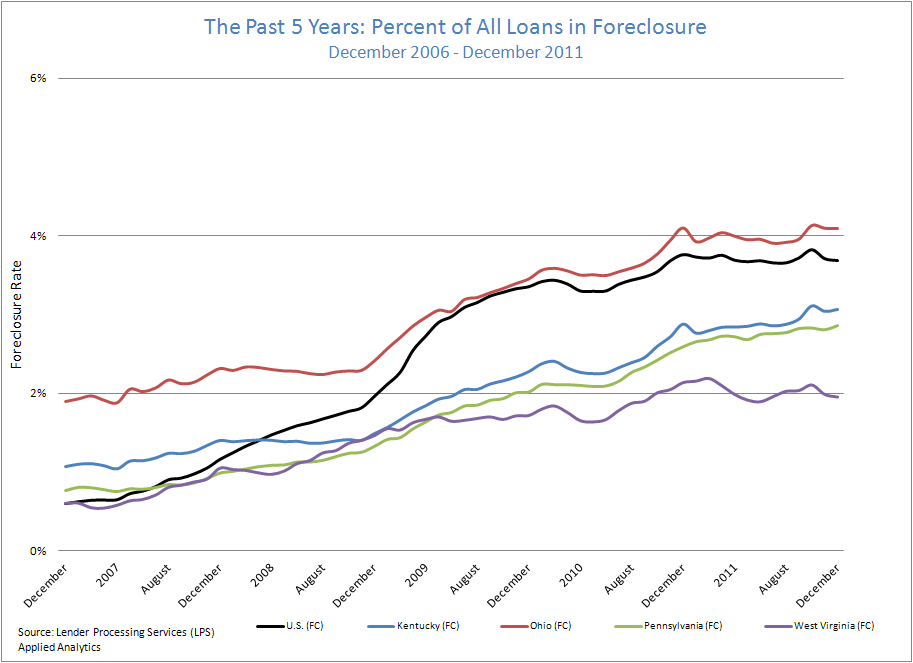
Figure 4
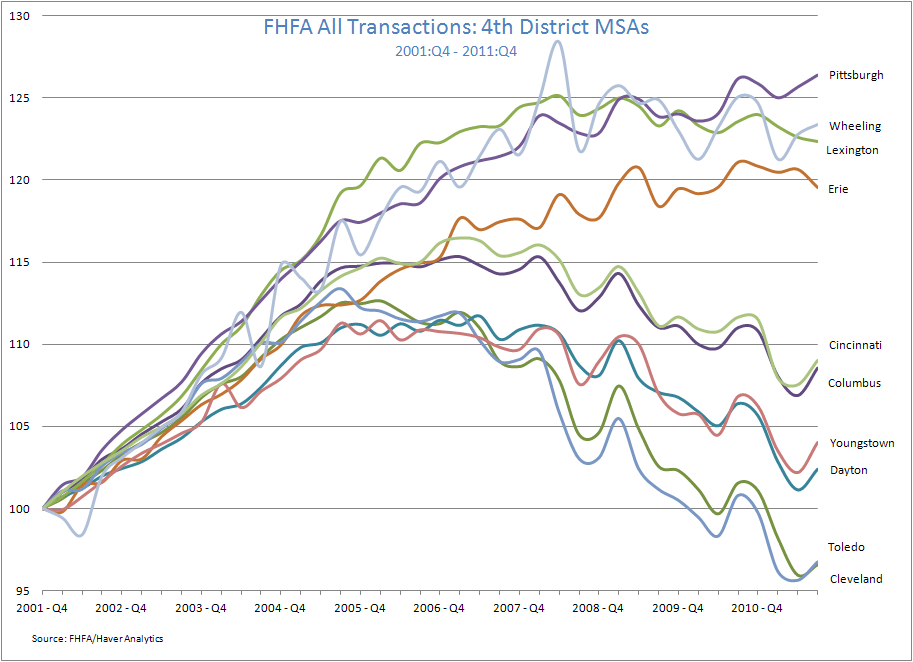
Home prices in 4th District MSAs outside of Ohio are relatively stable and continue to show positive gains over the past 10 years. However, home prices within Ohio MSAs show a clear run-up followed by a steady drop. Two Ohio MSAs, Cleveland and Toledo, have even fallen to their lowest levels in 10 years.
FHFA All Transactions: 4th District MSAs
Source: Lender Processing Services (LPS) Applied Analytics
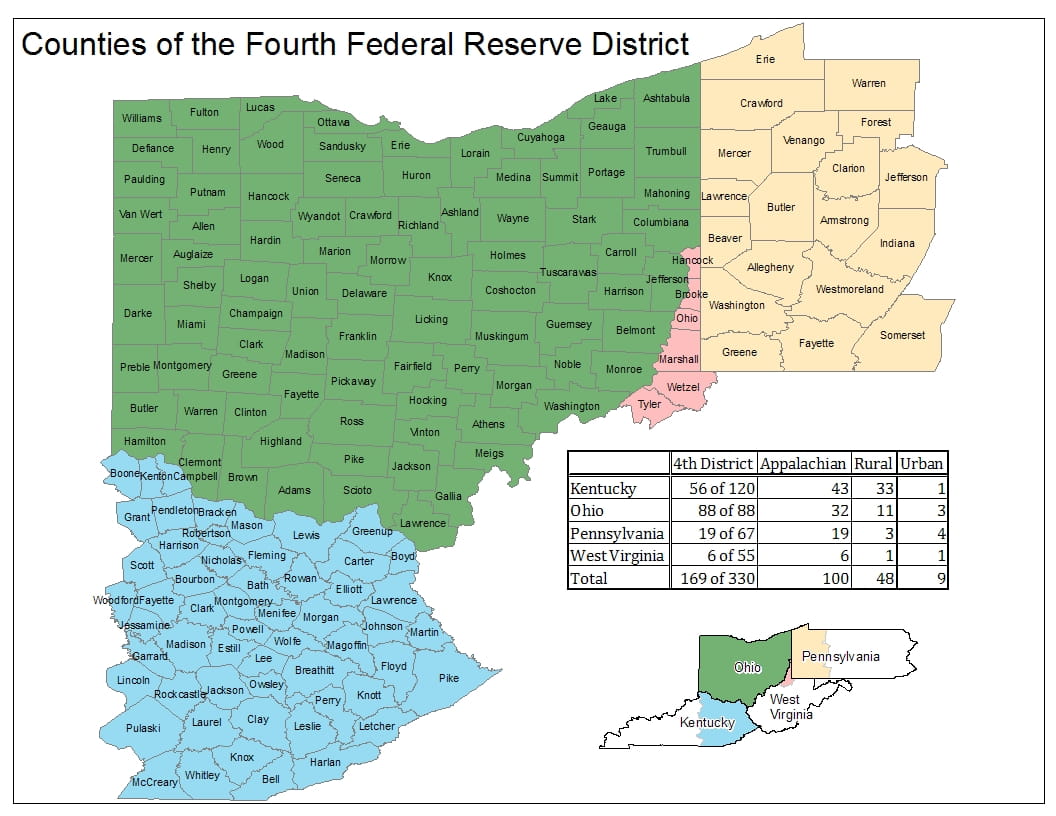
These data briefs provide periodic snapshots of mortgage lending activity and foreclosure patterns in our District using recently published data (check out this detailed, county-specific map of the 4th District). Delinquency and foreclosure data are from Lender Processing Services (LPS) Applied Analytics. The data include loan level servicing data for both securitized loans and loans held in portfolio from the top 10 residential mortgage servicers in the nation and others. Smaller servicers have less representation.