

- Share
Mortgage Lending Patterns in Fourth District Communities as of August 2011
For this edition of our data brief, we look at how loans are faring 12 months after they enter foreclosure, and compare results from two time periods: those entering foreclosure in the first half of 2009, and those entering in the first half of 2010. We include the pool of loans in the database from the four states in our district. Results are graphed at right, and our findings summarized below.

The views expressed in this report are those of the author(s) and are not necessarily those of the Federal Reserve Bank of Cleveland or the Board of Governors of the Federal Reserve System.
- Compared to the 2009 pool, loans entering foreclosure in 2010 were more likely to remain in foreclosure 12 months later, with the exception of West Virginia, the only non-judicial state in the Fourth District. Non-judicial states do not require court action to proceed on a foreclosed home. This typically allows for a much quicker resolution.
- In the 2010 period, Kentucky, Ohio, and Pennsylvania saw an increase of at least 6 percentage points in loans remaining in foreclosure after a year, and a smaller percentage of loans moving into REO or exiting the pool via a sale or other resolution.
- This may be due to more loans entering foreclosure, adding to an already elevated stock, as well as prolonged foreclosure processing times.
- On the positive side, each state saw an increase in the percentage of loans that became current, a possible indication of improved—and increased use of—loss mitigation strategies.
- West Virginia is resolving foreclosed loans at a much higher rate than the other three states, with a majority resulting in REO sales.
Figure 1: Status of Loans 12 Months After Entering Foreclosure
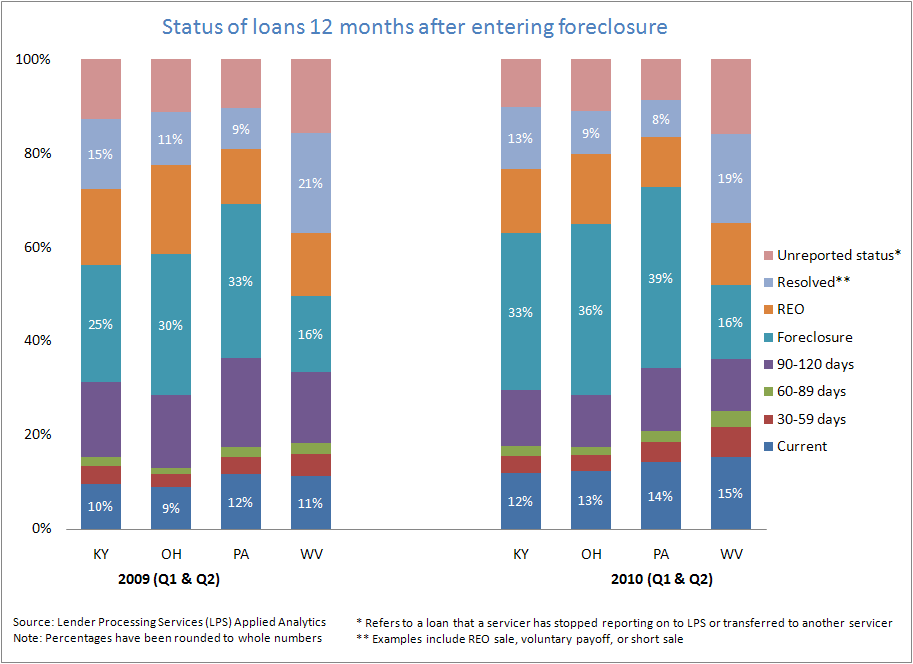
Note: Percentages have been rounded to whole numbers
Source: Lender Processing Services (LPS) Applied Analytics
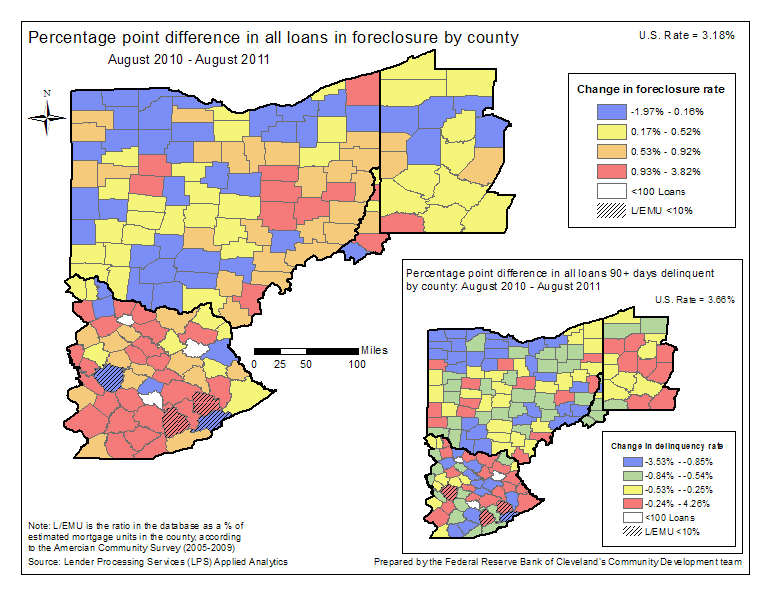
Figure 2: All Loans 90+ Days Delinquent by County August 2011
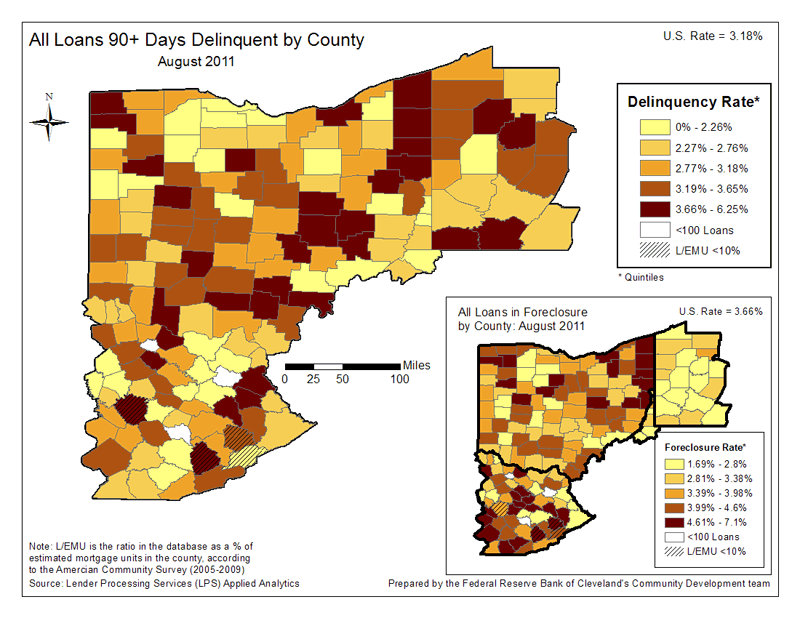
Note: L/EMU is the ratio in the database as a % of estimated mortgage units in the county, according to the American Community Survey (2006 - 2008)
Source: Lender Processing Services (LPS) Applied Analytics
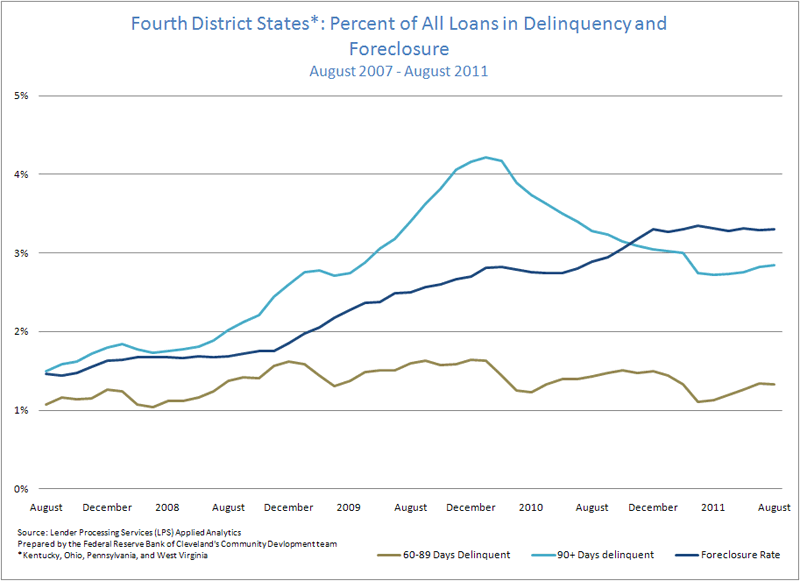
Figure 3: Percent of All Loans Greater Than 90 Days Delinquent
August 2007 - August 2011
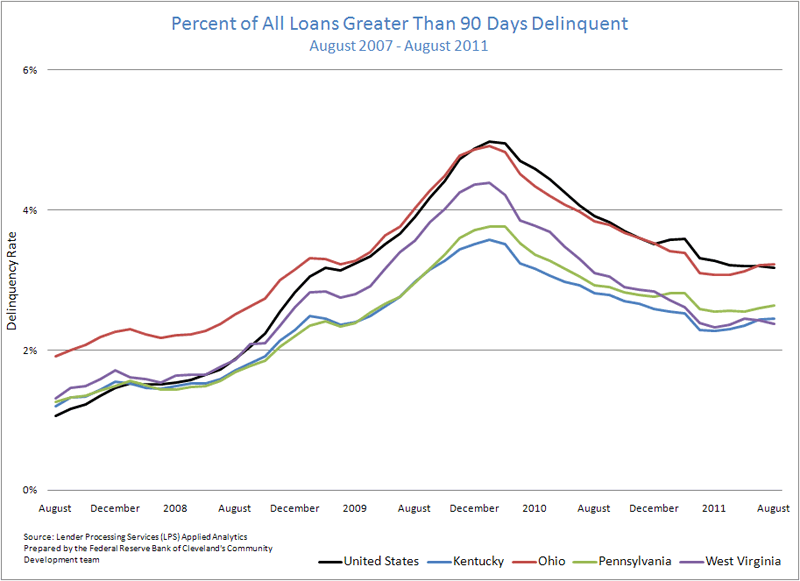
Note: Prepared by the Federal Reserve Bank (LPS) Applied Analytics
Source: Lender Processing Services (LPS) Applied Analytics
Figure 4: Percent of All Loans in Foreclosure
August 2007 - August 2011
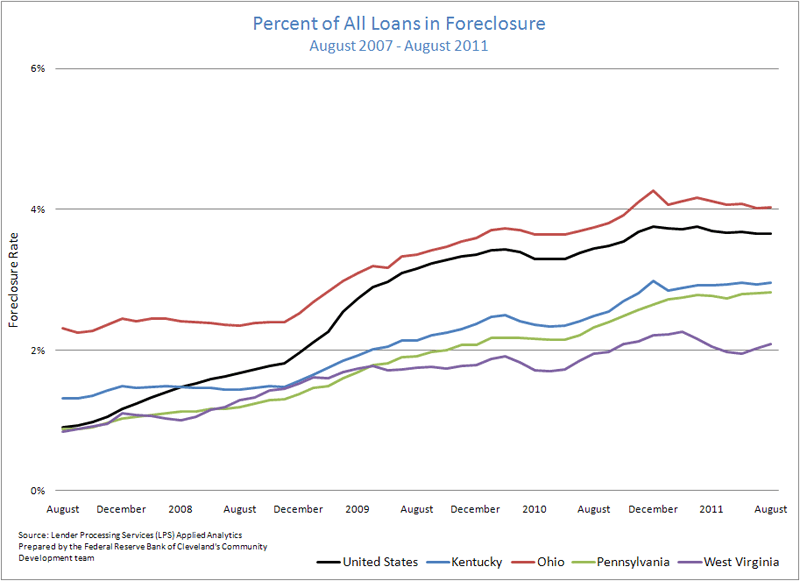
Note: Prepared by the Federal Reserve Bank (LPS) Applied Analytics
Source: Lender Processing Services (LPS) Applied Analytics
Additional charts and maps
- Map: Percentage point difference of all loans in foreclosure by county(August 2010 - August 2011)
- Chart: Percent of all loans in delinquency and foreclosure for the 4th District (August 2007-August 2011)
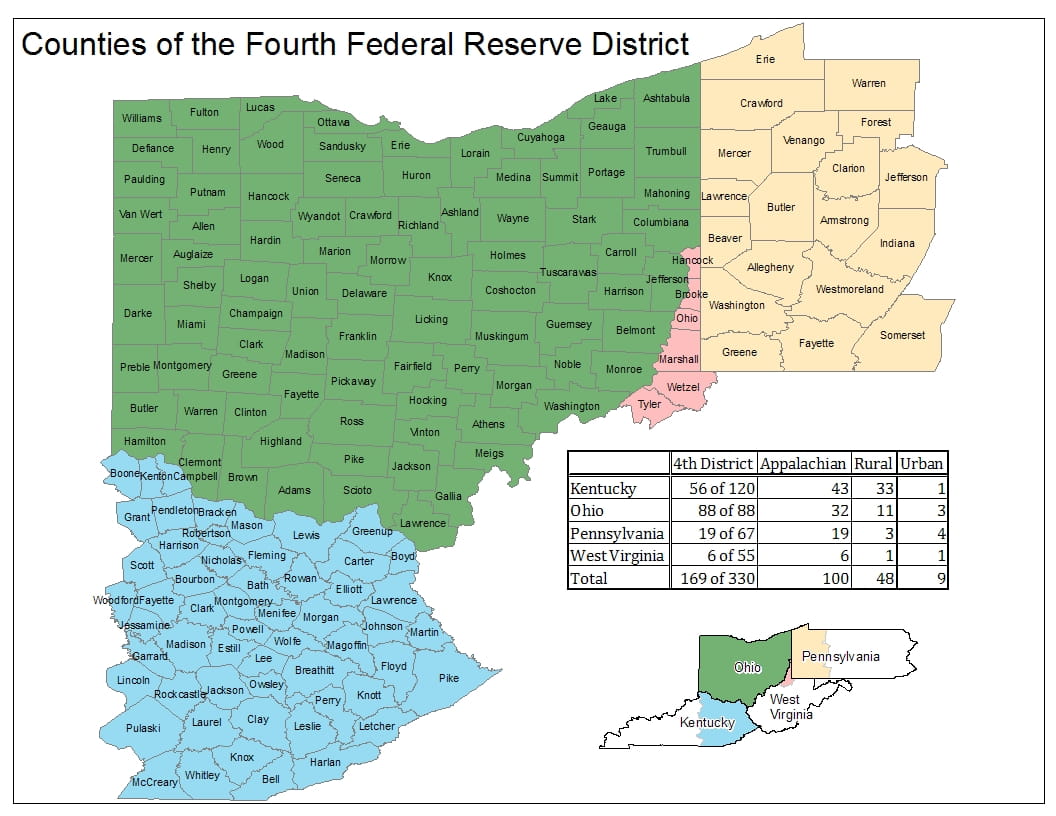
These data briefs, produced by the Federal Reserve Bank of Cleveland's Community Development team, provide periodic snapshots of mortgage lending activity and foreclosure patterns in our District using recently published data (check out this detailed, county-specific map of the 4th District). Delinquency and foreclosure data are from Lender Processing Services (LPS) Applied Analytics. The data include loan level servicing data for both securitized loans and loans held in portfolio from the top 10 residential mortgage servicers in the nation and others. Smaller servicers have less representation.