

- Share
Mortgage Lending Patterns in Fourth District Communities as of June 2013
The focus of this issue is trends in underwater loans, home prices, and refinacing rates in Ohio and Pennsylvania.

The views expressed in this report are those of the author(s) and are not necessarily those of the Federal Reserve Bank of Cleveland or the Board of Governors of the Federal Reserve System.
Underwater loans, home prices, and refinancing rates:
Figure 1
Figure 1 examines two variables in Ohio and Pennsylvania: The ratio of underwater loans1 to active loans (bars) and the home price index (lines). From 2008 to 2012 Ohio has had a higher ratio than Pennsylvania. While the ratio increased from 2008 to 2012 in both states—from 16% to nearly 24% in Ohio and from 3% to 12% in Pennsylvania—Ohio’s has remained stable since 2011. The level of underwater loans is directly influenced by trends in home prices. For instance, slight declines in home prices in both states from 2008 to 2012, correspond with the trend of increasing rates of underwater loans. In addition, Pennsylvania home prices have maintained a higher level, which helps to explain that state’s lower rate of underwater loans.
Figure 1: Ratio of underwater loans to active loans & home price index (HPI) 2002=100
Source: Lender Processing Services (LPS) Applied Analytics and Core Logic Home Price Index (HPI)
Prepared by the Community Development Department at the Federal Reserve Bank of Cleveland
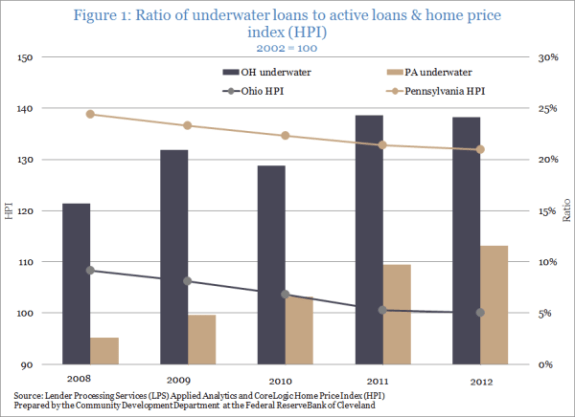
Figure 2
Figure 2 shows the percent of underwater loans that are current for Ohio and Pennsylvania. Trends in both states are U-shaped over the 5-year period, with Pennsylvania showing a higher rate than Ohio’s in each year. Since 2010 the rates for both states have been increasing—an encouraging trend, given the increase in underwater loans.
Figure 2: Percent of underwater loans that are current
Source: Lender Processing Services (LPS) Applied Analytics and Core Logic Home Price Index (HPI)
Prepared by the Community Development Department at the Federal Reserve Bank of Cleveland
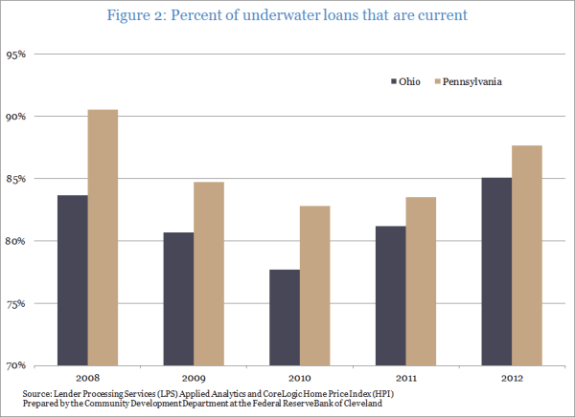
Figure 3
Figure 3 looks at trends in refinance rates according to the change in home prices from their peak in March 2007 to February 2013. As illustrated, refinance rates in both states remain unchanged regardless of the magnitude of the home price change.
Figure 3: 2012 refinance rates out of all originations by magnitude of the home price change*
Source: Lender Processing Services (LPS) Applied Analytics and Core Logic Home Price Index (HPI)
Prepared by the Community Development Department at the Federal Reserve Bank of Cleveland
* Change in home prices from March 2007-February 2013
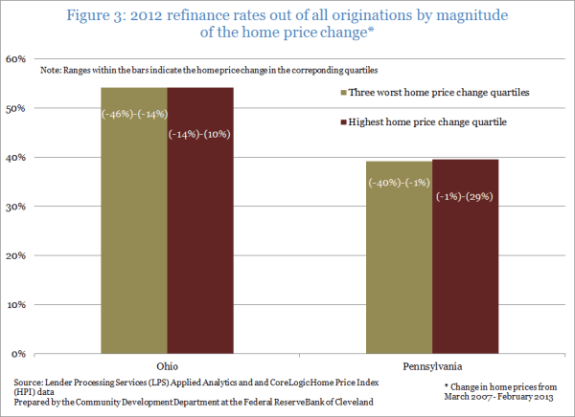
Figure 4
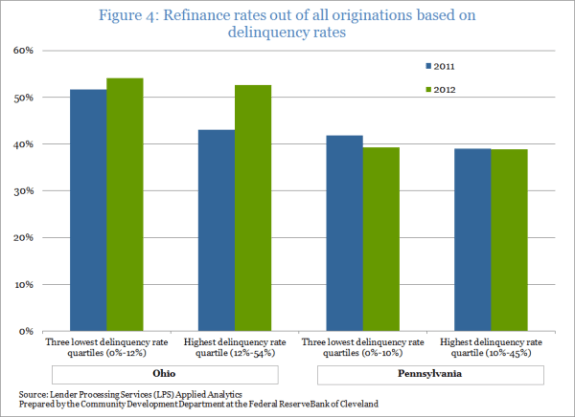
Figure 4 examines the two states’ refinance rates using delinquency as a measure of distress. In both delinquency categories—one comprising the three lowest quartiles and the other the highest quartile—Ohio has seen an increase in refinancings between 2011 and 2012, with the largest increase occurring in zip codes with the highest delinquency rates. Pennsylvania’s lower refinance rates have remained virtually unchanged over the two years.
Figure 4: Refinance rates out of all originations based on delinquency rates
Source: Lender Processing Services (LPS) Applied Analytics
Prepared by the Community Development Department at the Federal Reserve Bank of Cleveland
1 To estimate the number of underwater loans we compare the current value of the home to the current loan balance; those who owe more than the home’s value are considered to be underwater. A more in-depth explanation can be found here.
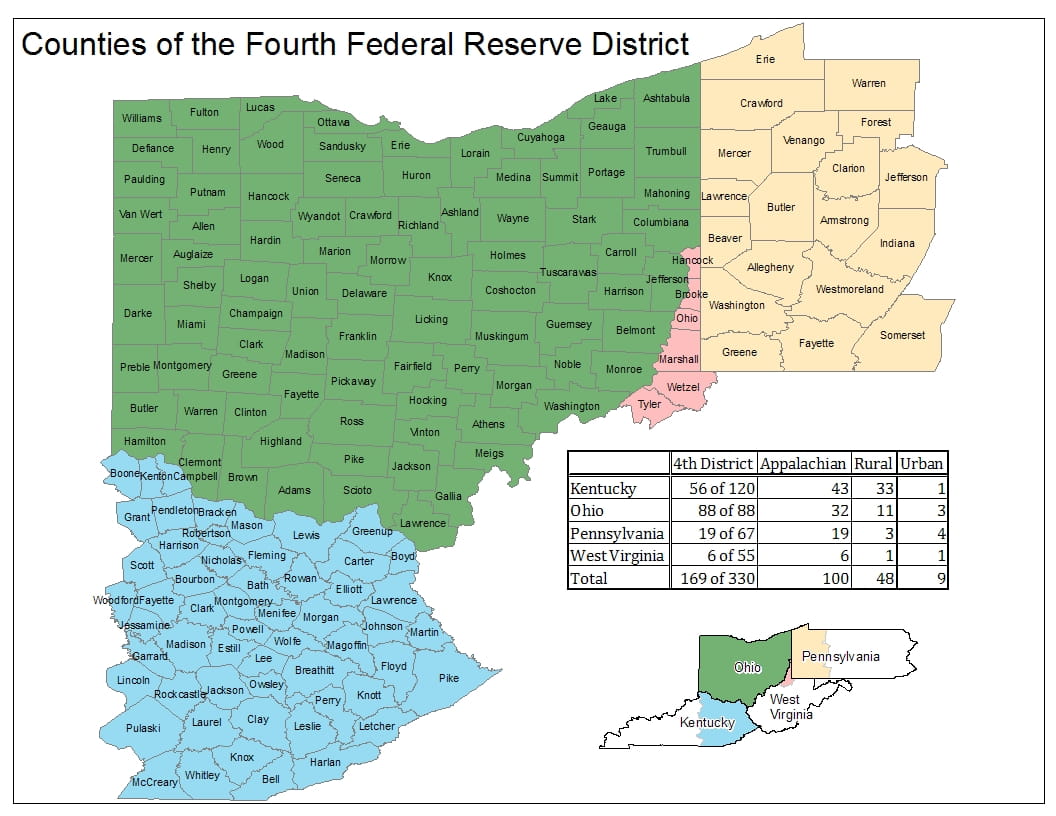
These data briefs, produced by the Federal Reserve Bank of Cleveland's Community Development team, provide periodic snapshots of mortgage lending activity and foreclosure patterns in our District using recently published data (check out this detailed, county-specific map of the 4th District). Delinquency and foreclosure data are from Lender Processing Services (LPS) Applied Analytics. The data include loan level servicing data for both securitized loans and loans held in portfolio from the top 10 residential mortgage servicers in the nation and others. Smaller servicers have less representation.