- Share
Rental housing patterns in Cuyahoga County, Ohio
Traditionally, renting has served as a stepping-stone to homeownership as well as an alternative for those seeking flexibility and more affordable places to live. But the mortgage crisis of the late 2000s has prompted individuals and families across the country to rethink their housing options. For many potential first-time homebuyers, for example, the severe drop in home values, along with tightened lending standards and uncertainty over when the market might recover, has kept them on the sidelines and made renting a more attractive option. Others have lost their homes to foreclosure, resulting in their inability to qualify for mortgage loans in the near future; they too have joined the ranks of renters. Low-income families, for whom homeownership was a limited option before the crisis, may be feeling the effects of the crisis on rental housing as these factors continue to impact the demand for affordable and subsidized housing. In this data brief, we examine recent trends in housing, both nationally and in Cuyahoga County, home to the City of Cleveland. Our examination includes a look at subsidized rental housing locally.
The views expressed in this report are those of the author(s) and are not necessarily those of the Federal Reserve Bank of Cleveland or the Board of Governors of the Federal Reserve System.
Introduction
Traditionally, renting has served as a stepping-stone to homeownership as well as an alternative for those seeking flexibility and more affordable places to live. But the mortgage crisis of the late 2000s has prompted individuals and families across the country to rethink their housing options. For many potential first-time homebuyers, for example, the severe drop in home values, along with tightened lending standards and uncertainty over when the market might recover, has kept them on the sidelines and made renting a more attractive option. Others have lost their homes to foreclosure, resulting in their inability to qualify for mortgage loans in the near future; they too have joined the ranks of renters. Low-income families, for whom homeownership was a limited option before the crisis, may be feeling the effects of the crisis on rental housing as these factors continue to impact the demand for affordable and subsidized housing. In this data brief, we examine recent trends in housing, both nationally and in Cuyahoga County, home to the City of Cleveland. Our examination includes a look at subsidized rental housing locally.
The broad picture
Overall, we see that homeownership rates are down below pre-crisis levels (2000) and that rental vacancies have somewhat decreased, reflecting a spike in rental demand, although these remain above 2000 levels. Given the increase in demand for rental housing prompted by the crisis, this may be a bit surprising. However, two additional factors influencing the supply of rental housing may explain in part why we are not seeing a bigger drop in the rental vacancy rate: the conversion of formerly owner-occupied homes to rentals and a decline in household formation, as families double up with each other in the wake of losing their jobs and/or their homes to foreclosure. We then shift our attention to subsidized housing, a key provider of affordable rental housing units to low-income households. What we see here is expanded use of vouchers in suburban neighborhoods during the 2000-2008 period.[1] The highest absolute increase of voucher use has taken place in the middle-income quintile, yet these neighborhoods feature less than 20% of schools ranked at or above excellent. So, while housing vouchers may be contributing somewhat to the deconcentration of poverty, low-income families in search of affordable housing remain limited in their access to better education.
Housing expenditure by income quintile
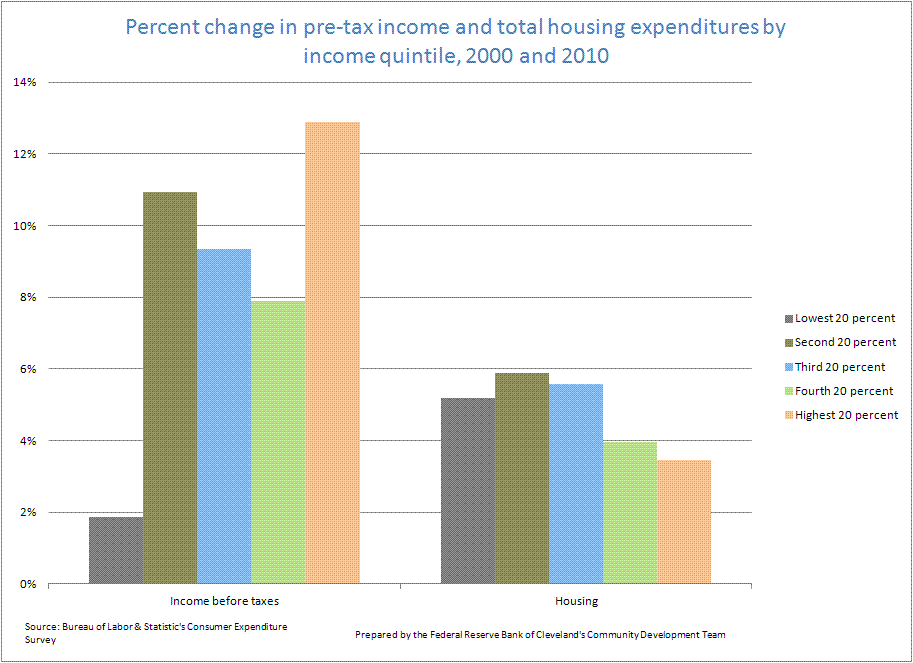
First, let’s take a national look at the cost of housing by income quintile. As a percentage of total expenditures, those in the lowest-income quintile spend the greatest share of their total expenditures on housing (figure 1). In addition, while all quintiles have seen housing costs as a percentage of total expenditures increase from 2000 to 2010, rates for the lowest-income quintile have risen the fastest, at 5.1 percentage points, compared to 1.8 percentage points for the highest quintile. This gap can be partially attributed to slower growth in before-tax income. From 2000 to 2010, growth in before-tax income for the lowest-income quintile was less than 2 percent, while all other income groups grew by at least 7.9 percent (figure 2).
Figure 1
Percent of total expenditures spent on housing by income quintile, 2000 and 2010
Source: Bureau of Labor & Statistic's Consumer Expenditure Survey
Prepared by the Federal Reserve Bank of Cleveland's Community Development Team
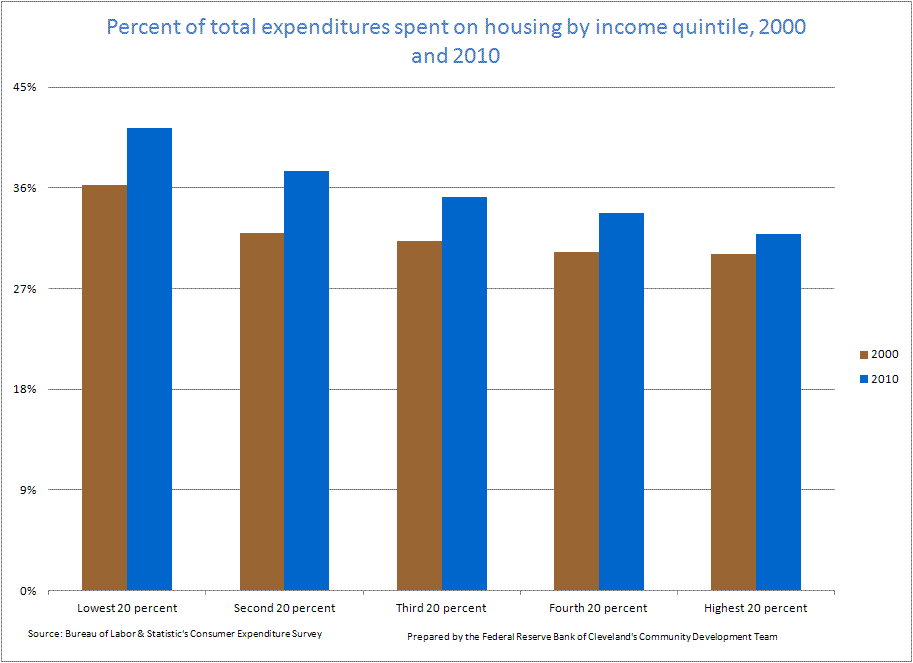
Figure 2
Percent change in pre-tax income and total housing expenditures by income quintile, 2000 and 2010
Source: Bureau of Labor & Statistic's Consumer Expenditure Survey
Prepared by the Federal Reserve Bank of Cleveland's Community Development Team
Rental vacancy rates and homeownership
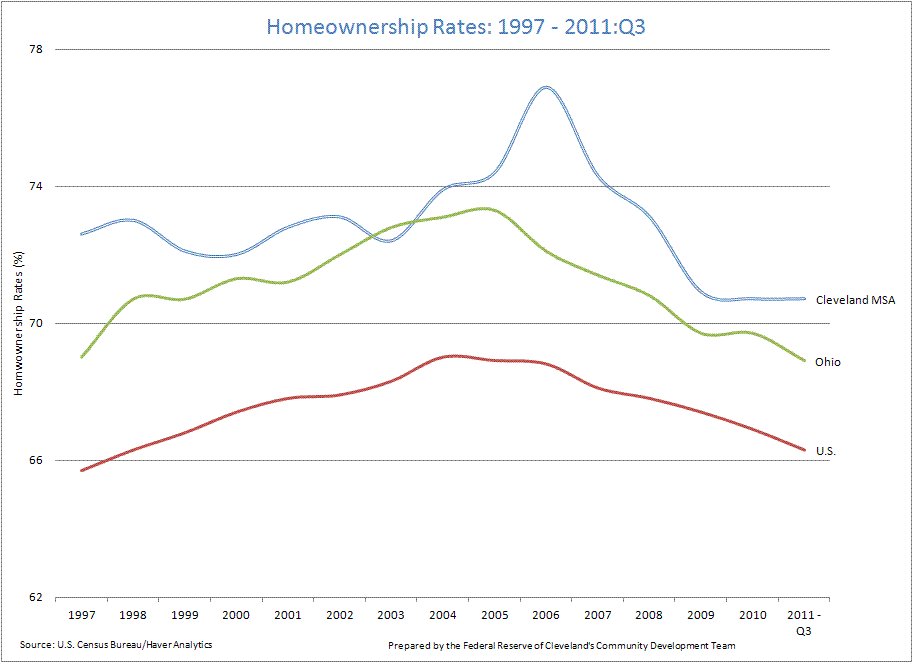
Next, let’s examine regional changes in rental and homeownership rates as they compare to state and national trends. Since the housing boom peak, rental vacancy rates have been decreasing across the country, and particularly for the Cleveland MSA (figure 3).[2] However, rental vacancy rates are still above pre-housing boom levels, while homeownership rates are already below those levels for Ohio and the Cleveland MSA (figure 4). In addition, homeownership rates in the Cleveland MSA seem to have stabilized in the past two years while Ohio follows the national trend since 2004 of continued decline. As noted previously, the conversion of formerly owner-occupied homes to rentals may explain in part why we are not seeing a larger drop in the rental vacancy rate. Another factor likely contributing is the slowing of household formation, as young adults remain living with parents longer and families facing unemployment, underemployment, or foreclosure are more willing to move in with friends or other family members.[3]
Figure 3
Rental Vacancy Rates, 1997-2011:Q3
Source: U.S. Census Bureau/Haver Analytics
Prepared by the Federal Reserve Bank of Cleveland's Community Development Team
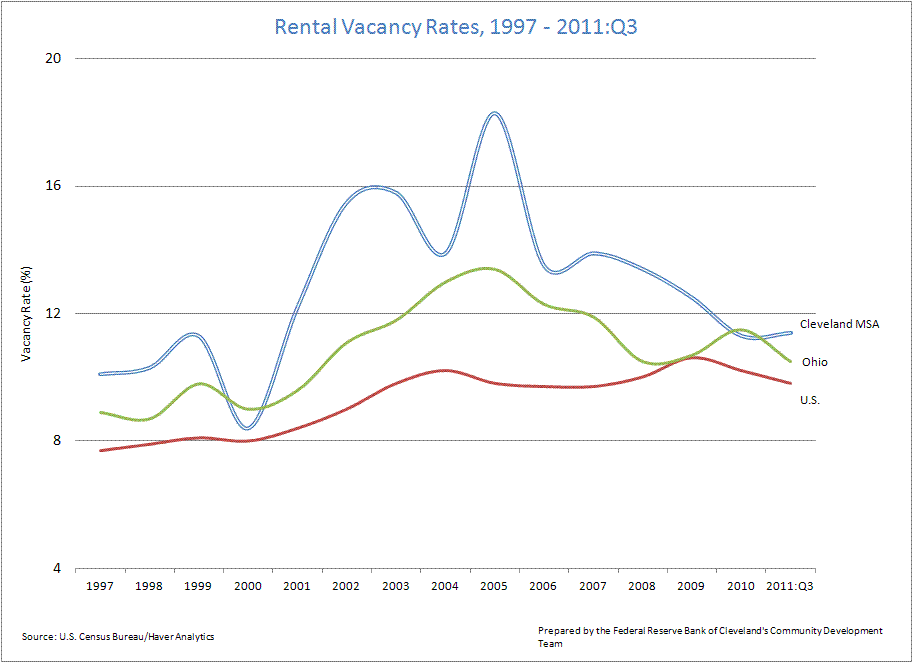
Figure 4
Homeownership Rates, 1997-2011:Q3
Source: U.S. Census Bureau/Haver Analytics
Prepared by the Federal Reserve Bank of Cleveland's Community Development Team
Subsidized housing
Now we turn our focus to the use of housing vouchers. Housing Choice Vouchers (HCVs) provide over 2 million low-income households annually with the ability to secure affordable housing. The program, funded by the federal government and administered by the Department of Housing and Urban Development (HUD), is the largest of HUD’s subsidized housing programs in the nation.[4] Eligibility is based on a household’s income relative to the median income of a region. Research has found that the program can be beneficial in moving families out of high-poverty neighborhoods, reducing family instability, and raising families above the poverty line.[5] In Cuyahoga County, usage of HCVs increased by 47 percent from 2000 to 2008, faster than the national rate increase of 35 percent. In 2008, almost 15,000 vouchers were used across the county, with the heaviest concentrations in Cleveland’s east-side neighborhoods and inner-ring suburbs (figure 5).
Unfortunately, housing authorities can only issue as many vouchers as their budgets allow, which is usually not enough to meet demand. According to the National Low Income Housing Coalition, only one in four households eligible for HCVs receives them, and many housing agencies have closed already extensive waiting lists. [6]Voucher use is also affected by landlord participation in the program. Landlords must opt in to the program, a decision that can be influenced by several factors, including the state of the region’s housing market, the fair market rent as determined by HUD[7] , and whether they want to be subjected to HUD’s home inspection process.
Figure 5
Housing Choice Voucher Use as a Percentage of Total Housing Units by Census Tract: Cuyahoga County, 2008
Source: HUD
Prepared by the Federal Reserve Bank of Cleveland's Community Development Team
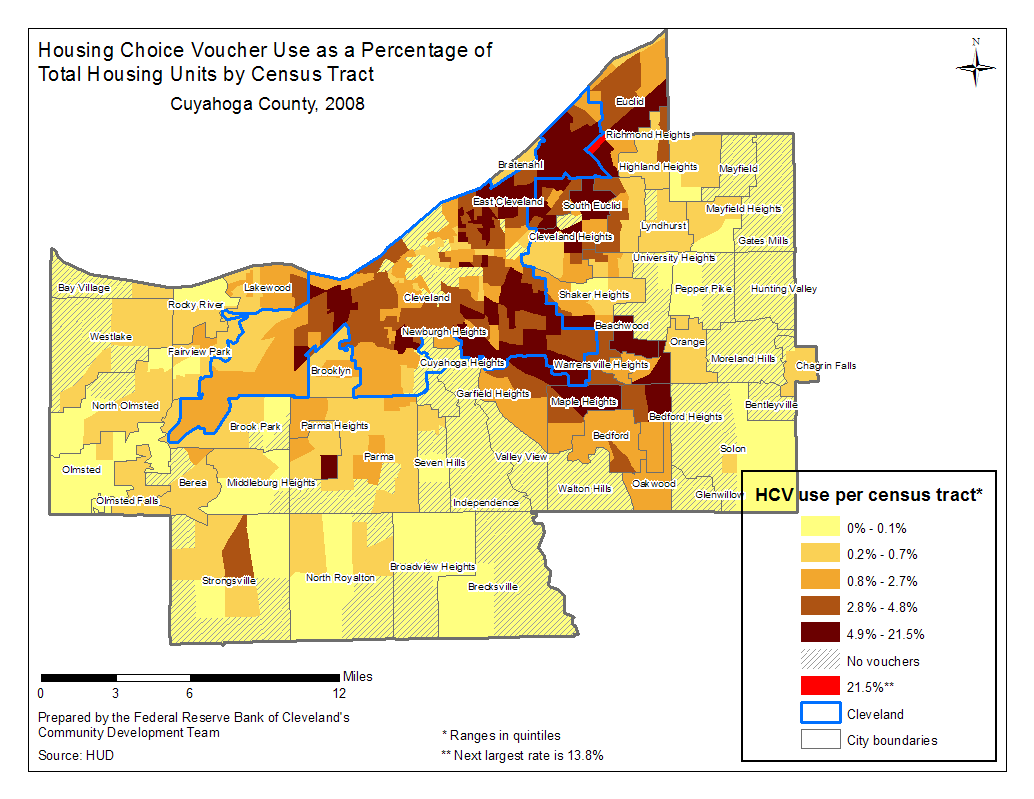
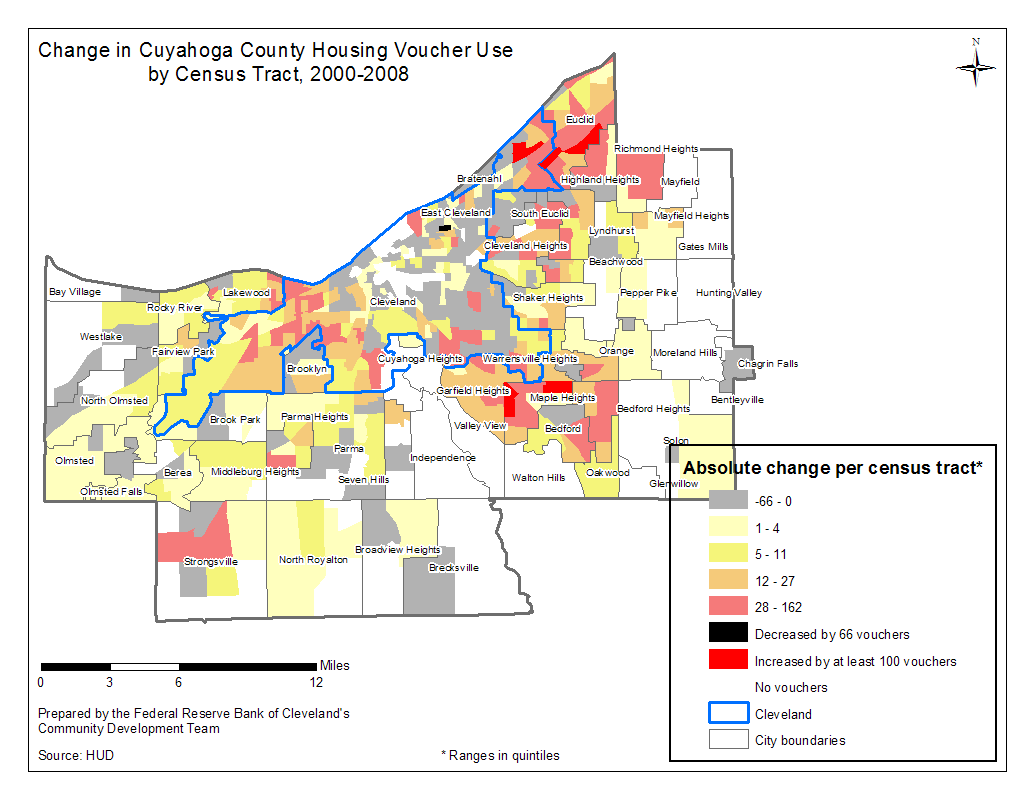
The use of Housing Choice Vouchers has increased markedly faster in the suburbs compared to the central city of Cleveland. From 2000 to 2008, use of HCVs increased by 18 percent in the city of Cleveland and 105 percent in the suburbs. This shift boosted the share of total HCVs used in all the suburbs from 33 percent in 2000 to 46 percent in 2008 (figure 6).[8] A recent report by the Brookings Institution that explores this nationwide trend of HCV households moving to the suburbs cites “the continued suburbanization of jobs” as a main factor.[9] In addition, we feel the recent housing bust has the potential to make housing more affordable across the entire region, not just in the central city. The widespread drop in home values may induce people to rent rather than sell their homes, opening up for consideration areas that were previously out of a lower-income household’s range.
Figure 6
Change in Cuyahoga County Housing Voucher Use by Census Tract, 2000-2008
Source: HUD
Prepared by the Federal Reserve Bank of Cleveland's Community Development Team
Neighborhood characteristics and school performance
Finally, prompted by renters’ migration into suburban communities as seen in the increased use of housing vouchers there, we decided to take a closer look at those neighborhoods. A specific question we wanted to delve into is, are these moves outward resulting in exposure to better schools? First we divided the census tracts in Cuyahoga County into quintiles based on median household income. We then used data from the U.S. Census Bureau and HUD to create tables of neighborhood characteristics for each one (table 1). While the two lowest-income quintiles reflect just over half of the total HCVs used in the county, the strongest growth in HCV use has occurred in the three highest-income quintiles. The one in the middle of the income distribution displays the strongest absolute growth in voucher use. Neighborhoods in this quintile had a homeownership rate of 58% in 2010 and are considerably more stable than poorer neighborhoods in terms of population loss. However, based on school ratings[10] created by the Ohio Department of Education (ODE), we can see that census tracts in the middle-income quintile contain less than 20% of the county’s top-tier schools (figure 7).[11] Furthermore, almost 60% of HCV households live in census tracts classified in the lowest two income quintiles, which are characterized as having lost about 20% of their population, suffering from high vacancy rates, and having experienced a greater loss in household income. What this means is that, even as HCV households show strong growth in the suburbs and are moving into healthier neighborhoods and census tracts containing better-performing schools, the majority remain in census tracts with more of the county’s worst-performing schools, higher vacancy rates, and greater population loss.
Figure 7
2009-2010 School Performance by Median Household Income: Cuyahoga County, Ohio
Source: Ohio Department of Education
Prepared by the Federal Reserve Bank of Cleveland's Community Development Team
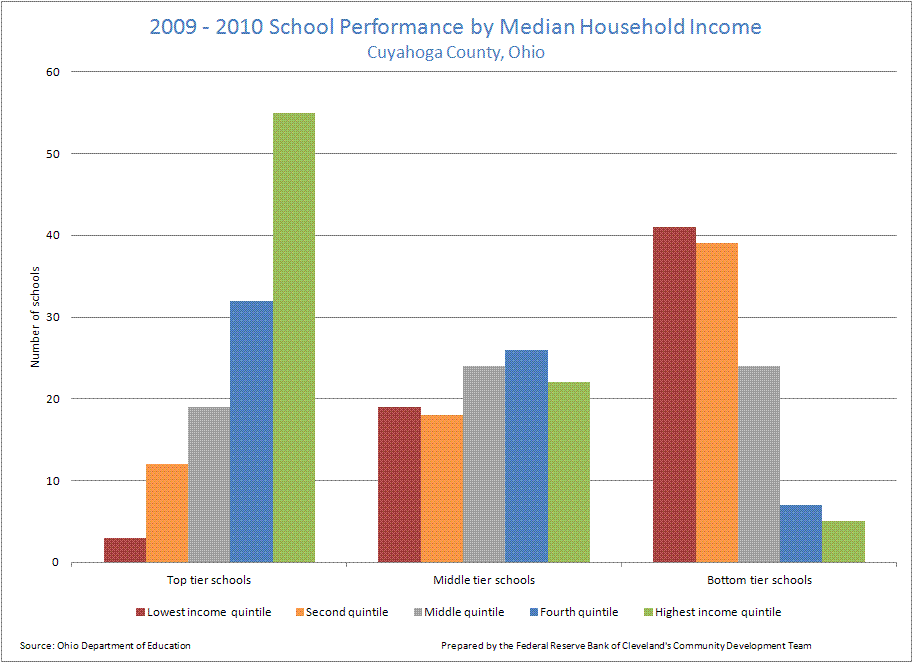
Table One
| Quintile by income | % of total HCVS (2008) | Change in HCVs (2000-2008) | Absolute change in HCVs (2000-2008) | Population change (2000-2010) | % of total minority population (2010) | Change in housing units (2000-2010) | % renter occupied units | Vacancy rate (2010) | % point change in vacancy rate (2000-2010) | Area median income (05-09 ACS)[12] | Change in median household income (2000-05/09 ACS) |
| Lowest | 26% | 12% | 414 | -18% | 29% | -5% | 70% | 22% | 8 | 39% | -32% |
| Second | 32% | 11% | 473 | -21% | 34% | -4% | 55% | 22% | 9 | 66% | -17% |
| Middle | 24% | 151% | 2,155 | -7% | 21% | -1% | 42% | 11% | 5 | 92% | -17% |
| Fourth | 14% | 152% | 1,263 | -4% | 10% | 3% | 31% | 8% | 3 | 122% | -12% |
| Highest | 5% | 311% | 542 | 0.4% | 6% | 6% | 21% | 7% | 2 | 192% | -6% |
Source: HUD and the U.S. Census Bureau
Footnotes
- 2008 is the most recent data available from HUD.
- Variability for MSA rates is greater due to the sample size being smaller. The trends are more important than actual period-to-period changes.
- http://www.housingamerica.org/RIHA/RIHA/Publications/72429_9821_Research_RIHA_Household_Report.pdf
- In 2008, HCVs accounted for 45%, followed by public housing at 23% and other programs at 32%.
- http://www.cbpp.org/cms/index.cfm?fa=view&id=2817
- http://www.nlihc.org/doc/04-03.pdf
- According to HUD "Fair Market Rents (FMRs) are primarily used to determine payment standard amounts for the Housing Choice Voucher program." http://www.huduser.org/portal/datasets/fmr/fmrover_071707R2.doc
- Brookings Institute found that nationally this number was 49 percent.
- http://www.brookings.edu/papers/2011/1011_housing_suburbs_covington_freeman_stoll.aspx
- The ODE uses the following designations: excellent w/distinction, excellent, continuous improvement, effective, academic watch, and academic emergency. They are based on the number of state indicators met out of the possible total and a value-added calculation such as whether the district was above or below expected growth. A more detailed explanation can be found here: http://www.ode.state.oh.us/GD/DocumentManagement/DocumentDownload.aspx?DocumentID=89459
- Top-tier schools achieved an excellent or excellent with distinction ranking. Middle-tier schools are labeled effective or in continuous improvement. Bottom-tier schools fall under the categories of academic watch or academic emergency.
- AMI is the quintile income as a percentage of the county's median income; less than 100% indicates that the quintile is under the county median income.


