

Mortgage Lending Patterns in Fourth District Communities as of June 2012
What’s happening to delinquent loans in Fourth District states as they make their way toward foreclosure? When a loan becomes delinquent, or 60 days past due, we can think of it as entering one end of a pipeline. At the other end is foreclosure auction. Along the way there are multiple “escape hatches,” through which they can exit the pipeline before reaching the point where the loans (or rather, the properties to which the loans are attached) are auctioned off. For example, some loans become current as borrower finances recover or loan terms are modified. Some make their exit via a short sale. The remainder continue moving toward foreclosure auction, where two things can happen: they are either purchased—by individuals, investors, or nonprofits—or, if not purchased, they become real estate owned, or REO. At this point banks attempt to sell these REO properties. A “distressed sale” refers to the sale of any of the following: delinquent loans or foreclosed or REO properties. Trends in distressed sales are the particular focus of this data brief.

The views expressed in this report are those of the author(s) and are not necessarily those of the Federal Reserve Bank of Cleveland or the Board of Governors of the Federal Reserve System.
First, let’s consider differences among the types of distressed sales. Discounts at short sales—which occur earlier in the pipeline than foreclosure or REO sales—tend to be less severe than those at foreclosure and REO sales, owing to the fact that properties sold this way are more likely to be maintained and remain occupied through most of the transition period. Conversely, properties that go through an REO sale tend to be vacant longer and are in worse physical shape. With that in mind, we track the share of distressed sales in our District to see whether REO sales have been declining relative to other distressed sales that occur earlier in the delinquency.
Figure 1
Figure 1 shows delinquency rates relatively steady since 2011, and foreclosure rates continuing to increase, although at a low rate.
The Past 5 Years: Percent of All Loans 60+ Days Delinquent: June 2007-June 2012, and The Past 5 Years: Percent of All Loans in Foreclosure: June 2007-June 2012
Source: Lender Processing Services (LPS) Applied Analytics
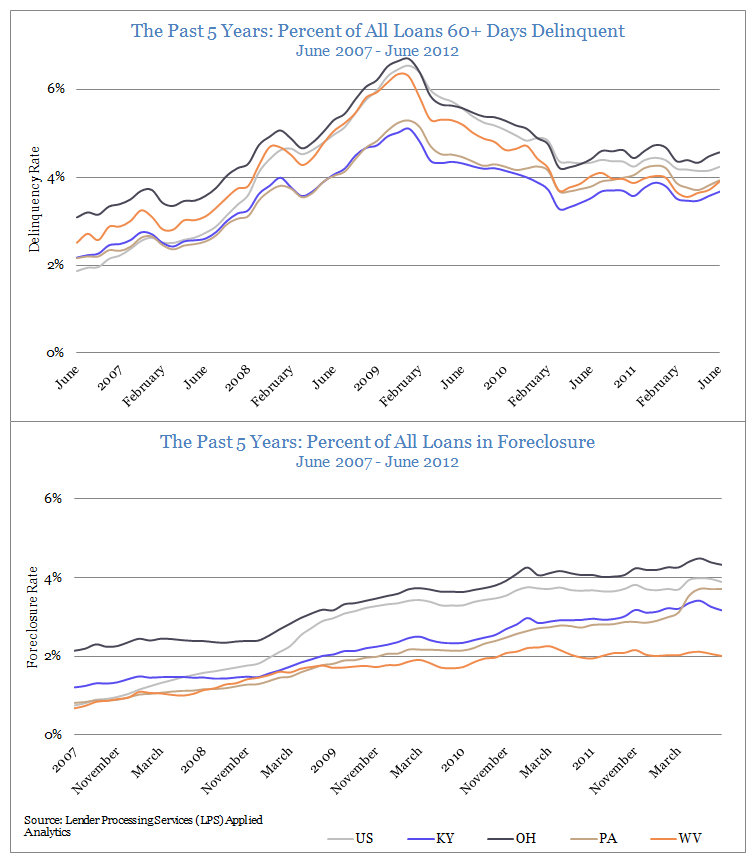
Figure 2
As seen in Figure 2, the number of distressed sales (figure A) relative to the size of the delinquency inventory (figure B) has been trending down in the past five years for Ohio and Kentucky. Ohio continues to have the highest ratio of distressed sales to delinquent loans (figure C).
Figure A: Average ratio of distressed sales to total distressed loans: July 2011-June 2012; Figure B: Share of distressed sales by Fourth District state: July 2011-June 2012; and Figure C: Trends in total distressed sales in Fourth District states: June 2008-June 2009=100
Source: Lender Processing Services (LPS) Applied Analytics
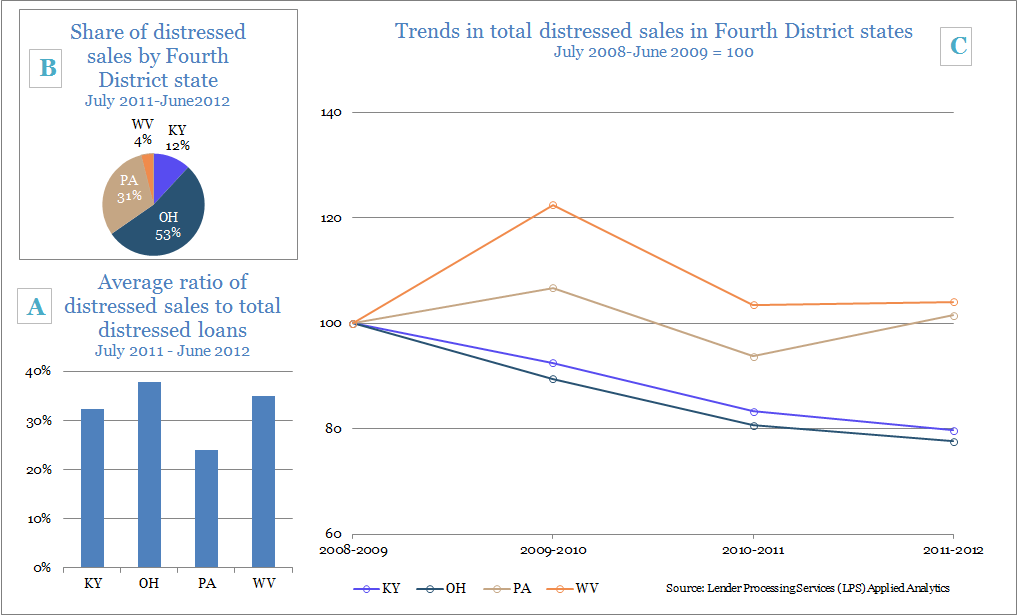
Figure 3
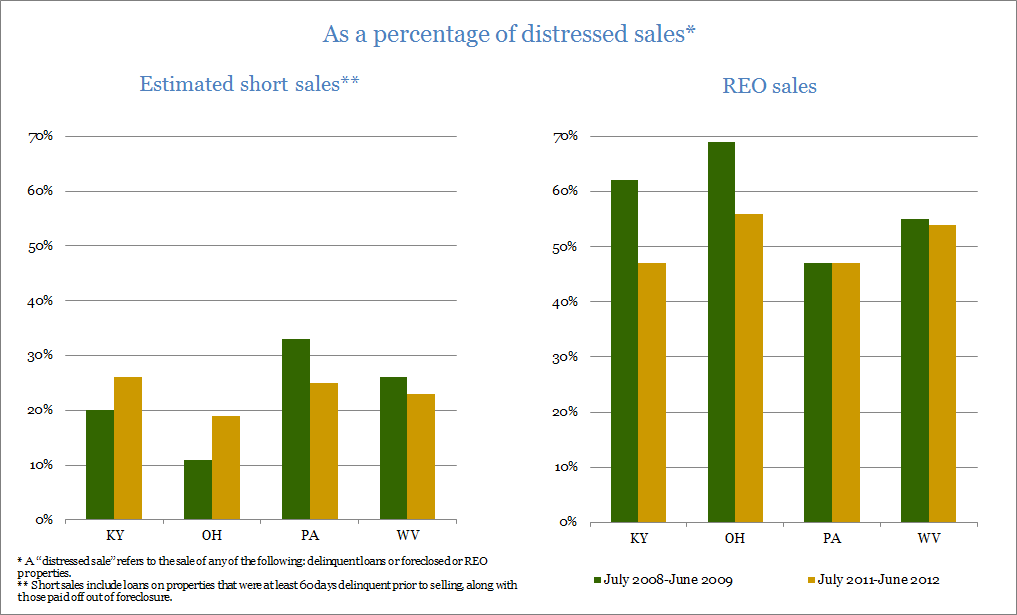
Figure 3 compares distressed sale shares in 2008-2009 with those in the 2011-2012 period. From the dataset, we can identify REO sales reliably and estimate short sales with some degree of confidence. Unfortunately we are unable to disentangle foreclosure and sheriff sales. Sales out of REO remain the most prevalent of distressed sales in all states, with shares holding steady in West Virginia and Pennsylvania. However, Kentucky and Ohio have seen a decline in REO sales from one period to the next, and an increase in short sales.
As a percentage of distressed sales*: Estimated short sales** and REO sales
* A "distressed sale" refers to the sale of any of the following: delinquent loans or foreclosed or REO properties. ** Short sales include loans on properties that were at least 60 days delinquent prior to selling, along with those paid off out of foreclosure.
Additional maps
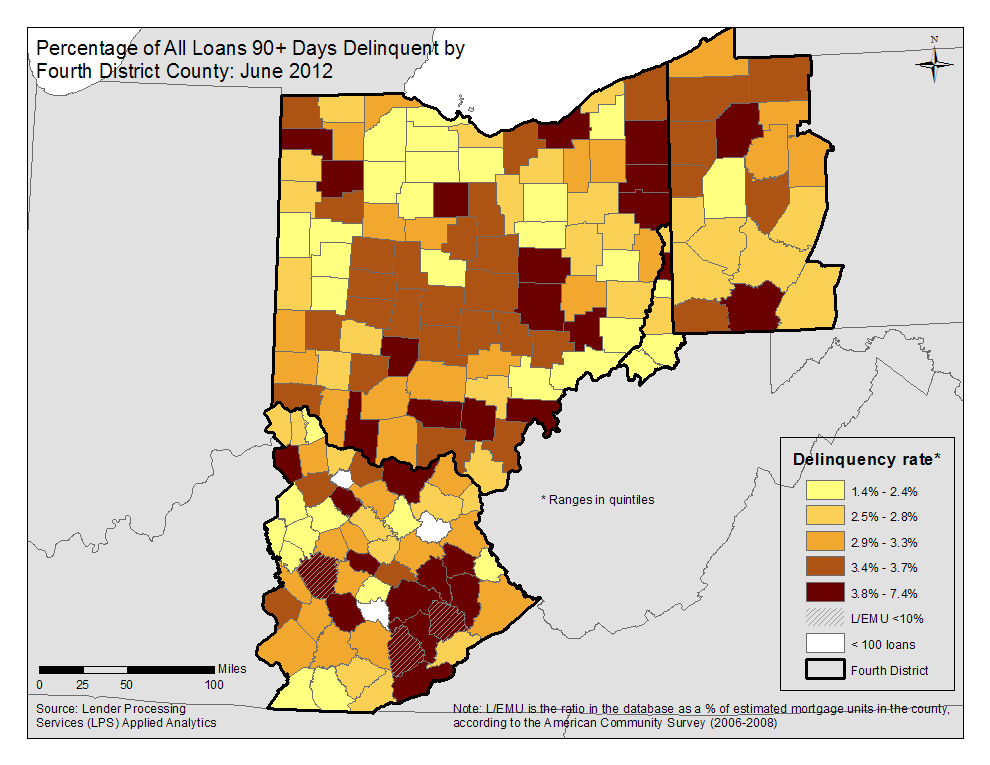
- Map: Percentage of all loans 90+ days delinquent by Fourth District counties: June 2012
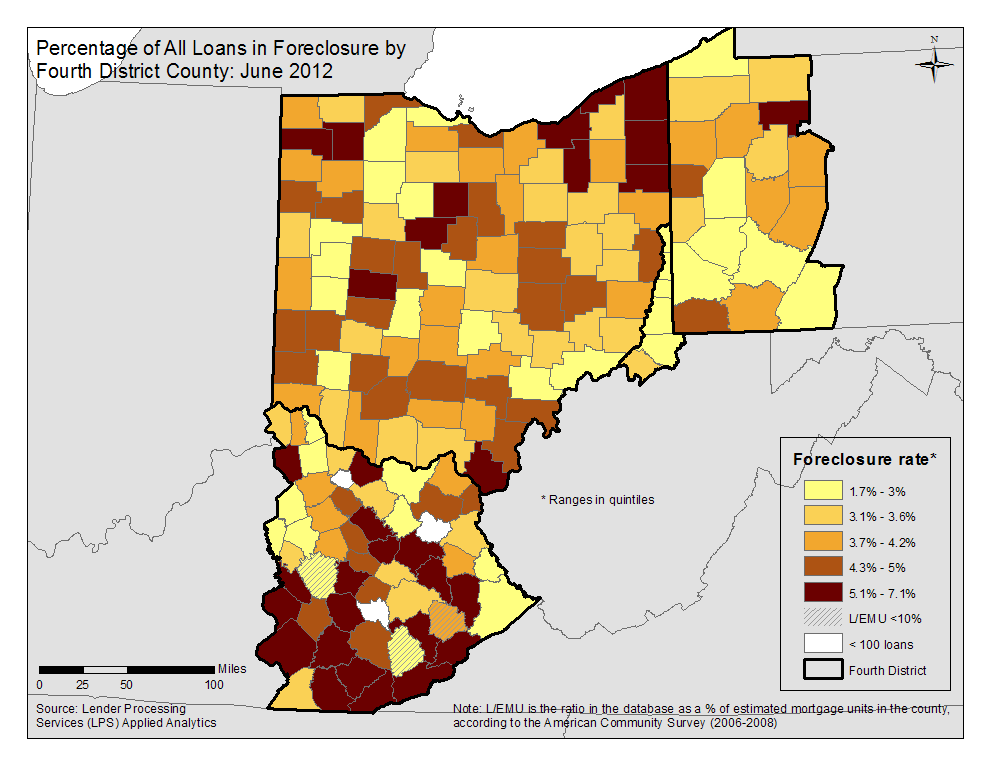
- Map: Percentage of all loans in foreclosure by Fourth District counties: June 2012
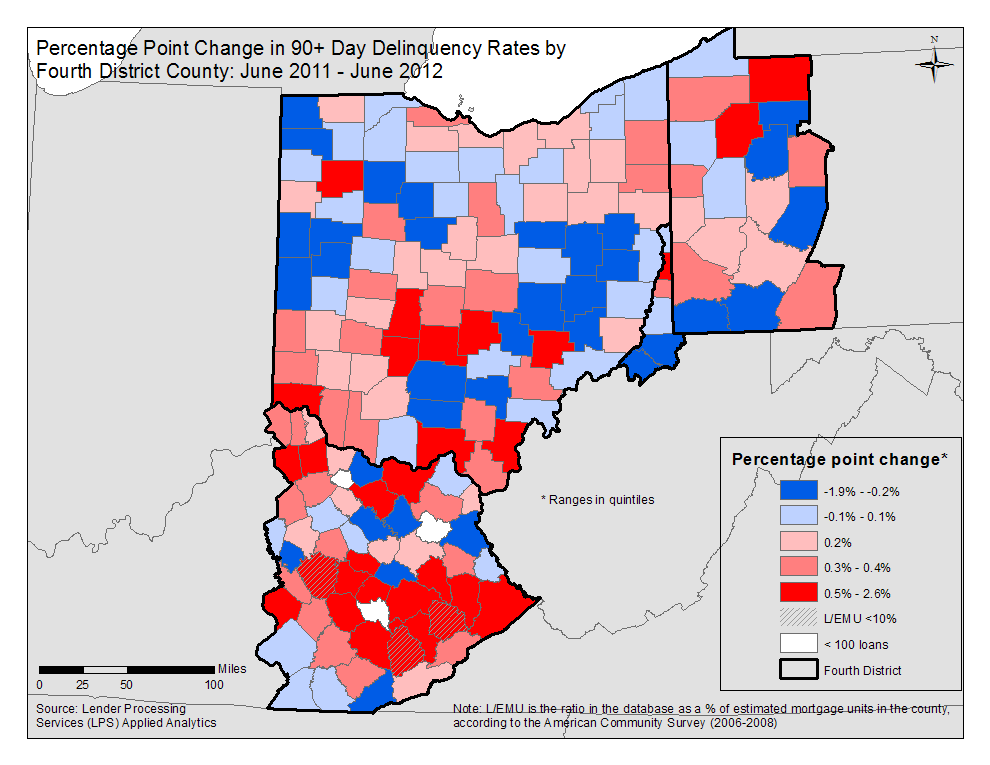
- Map: Percentage point change in 90+ day delinquency rates by Fourth District counties: June 2011 - June 2012
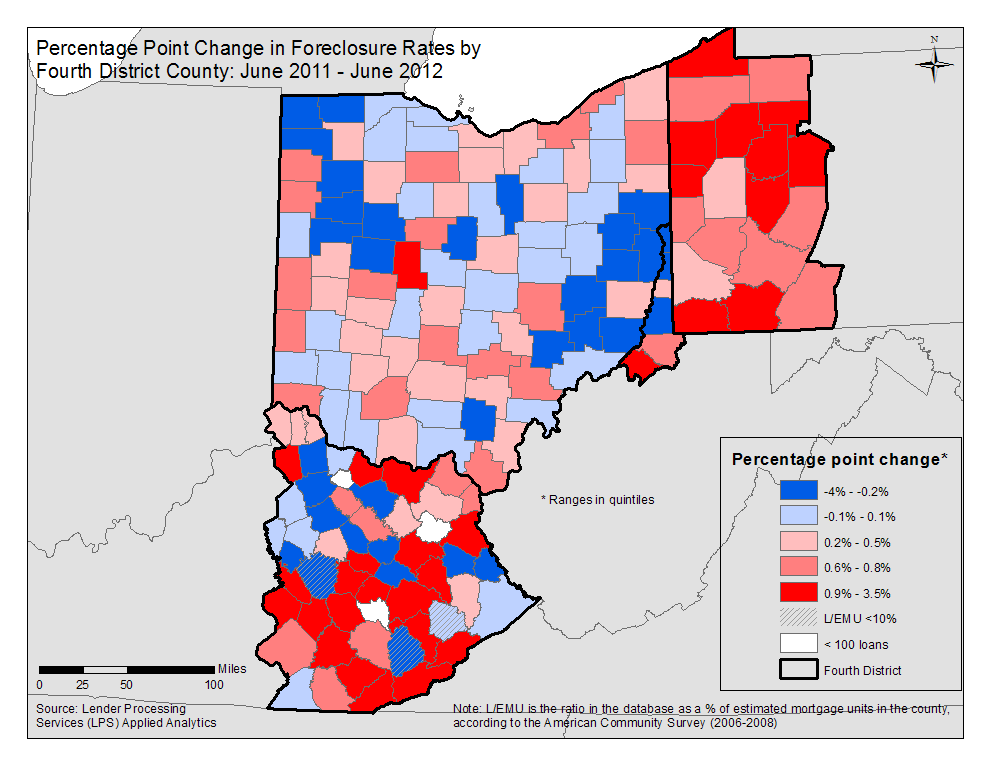
- Map: Percentage point change in foreclosure by Fourth District counties: June 2011 - June 2012
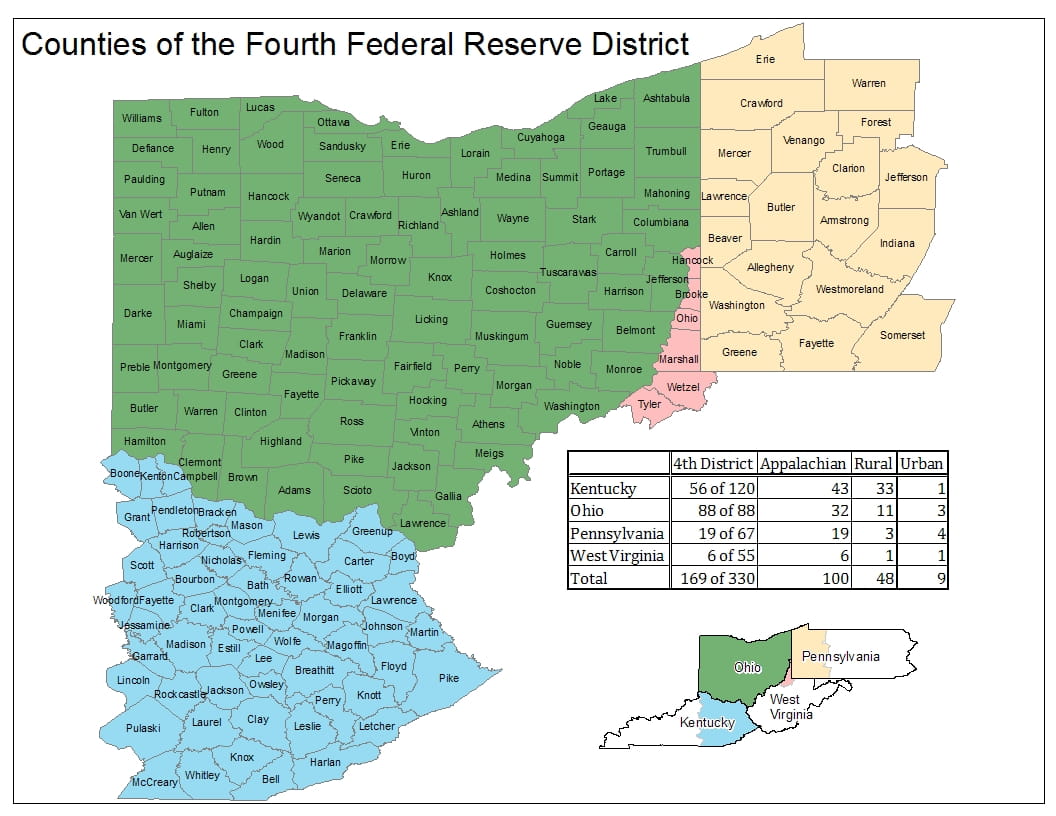
These data briefs, produced by the Federal Reserve Bank of Cleveland's Community Development team, provide periodic snapshots of mortgage lending activity and foreclosure patterns in our District using recently published data (check out this detailed, county-specific map of the 4th District). Delinquency and foreclosure data are from Lender Processing Services (LPS) Applied Analytics. The data include loan level servicing data for both securitized loans and loans held in portfolio from the top 10 residential mortgage servicers in the nation and others. Smaller servicers have less representation.
- Share