

- Share
Mortgage Lending Patterns in Fourth District Communities as of April 2010
Over the last four years, FHA-insured loans increased as a share of all loans by 29 percentage points from 8.2% to 37.3%. Given their popularity, how have these mortgages performed?

The views expressed in this report are those of the author(s) and are not necessarily those of the Federal Reserve Bank of Cleveland or the Board of Governors of the Federal Reserve System.
A look at the growing use of FHA-insured loans:
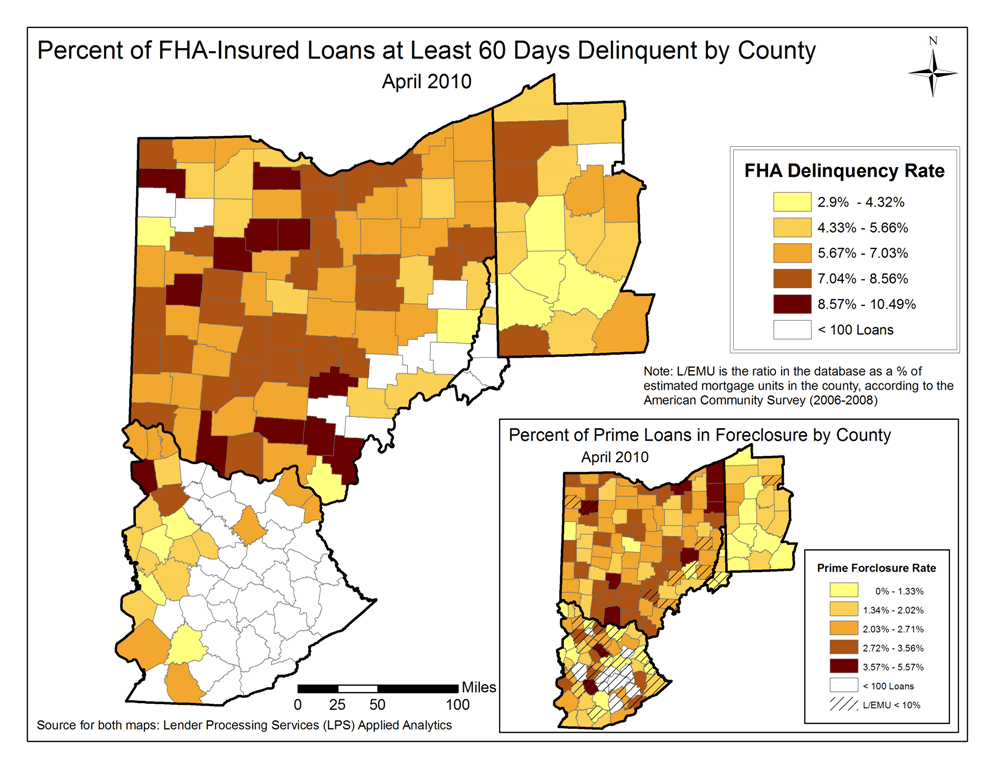
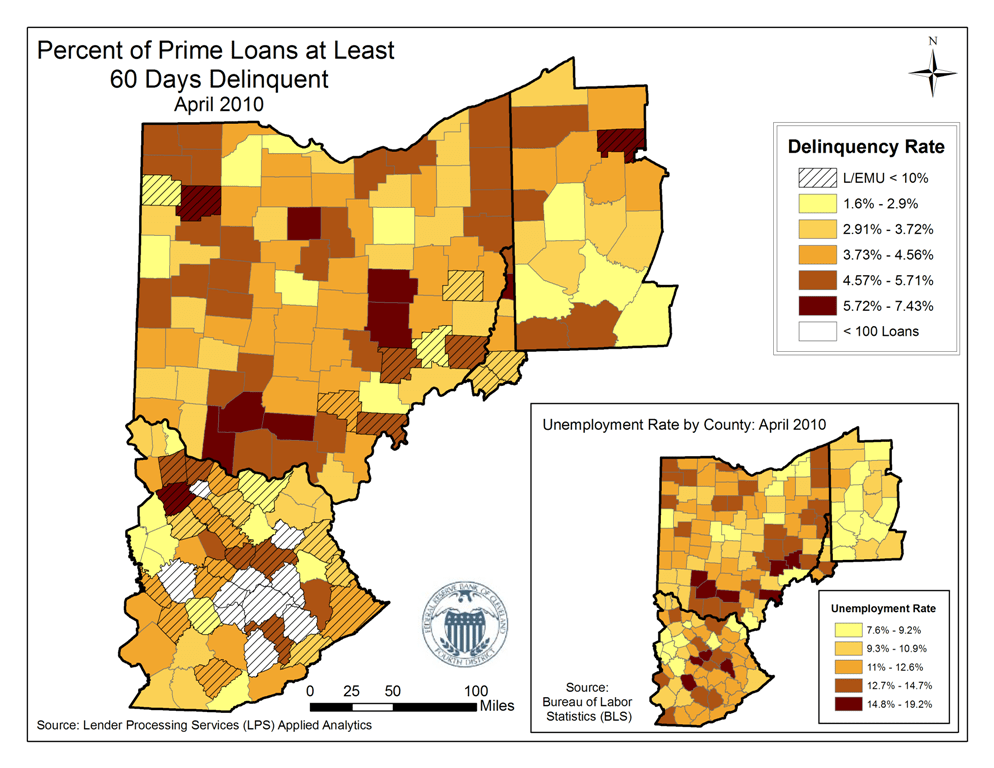
FHA-insured loans at least 60 days delinquent by county, as of April 2010
1. FHA-insured loan delinquency rates remain highest in rural counties, similar to trends exhibited by prime loans.
Figure 1: Percentage FHA-Insured Loans at Least 60 Days Delinquent by County April 2010
Note: L/EMU is the ratio in the database as a % of estimated mortgage units in the county, according to the American Community Survey (2006 - 2008)
Source for both maps: Lender Processing Services (LPS) Applied Analytics
Trends in the performance of FHA-insured loans
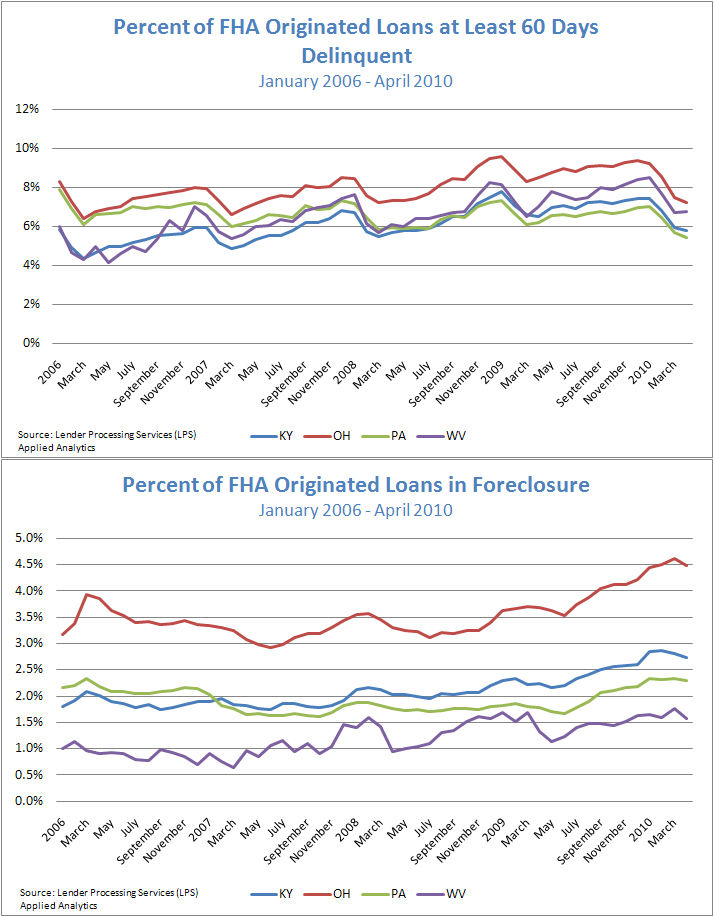
2. FHA-insured loans at least 60 days delinquent show a cyclical pattern that is higher than the delinquency rate of all prime loans.
3. The percentage of FHA-insured loans in foreclosure follows trends similar to prime loan performance, albeit at elevated rates.
Figure 2: Percent of FHA Originated Loans at Least 60 Days Delinquent
Source: Lender Processing Services (LPS) Applied Analytics
Figure 3: Percent of FHA Originated Loans in Foreclosure
Source: Lender Processing Services (LPS) Applied Analytics
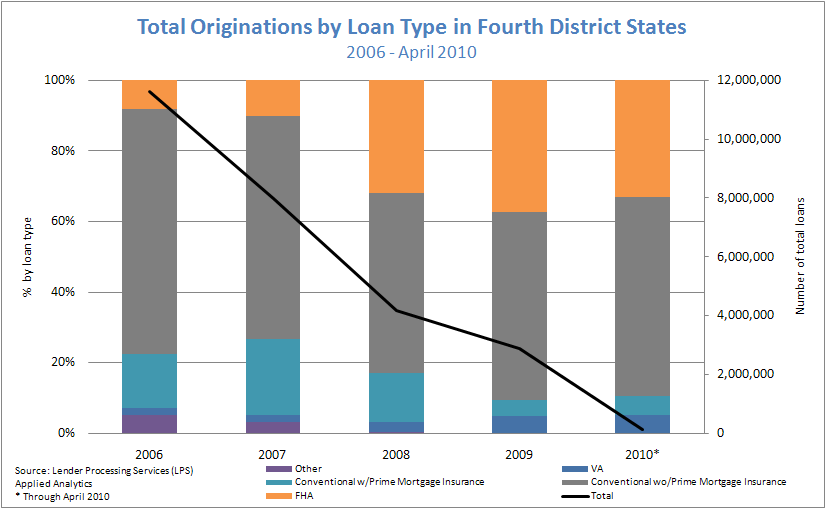
Total originations by loan type in the Fourth District
4. Over the last four years, FHA-insured loans increased as a share of all loans by 29 percentage points from 8.2% to 37.3%.
Figure 4: Total Originations by Loan Type in Fourth District States
2006 - April 2010
Source for both maps: Lender Processing Services (LPS) Applied Analytics
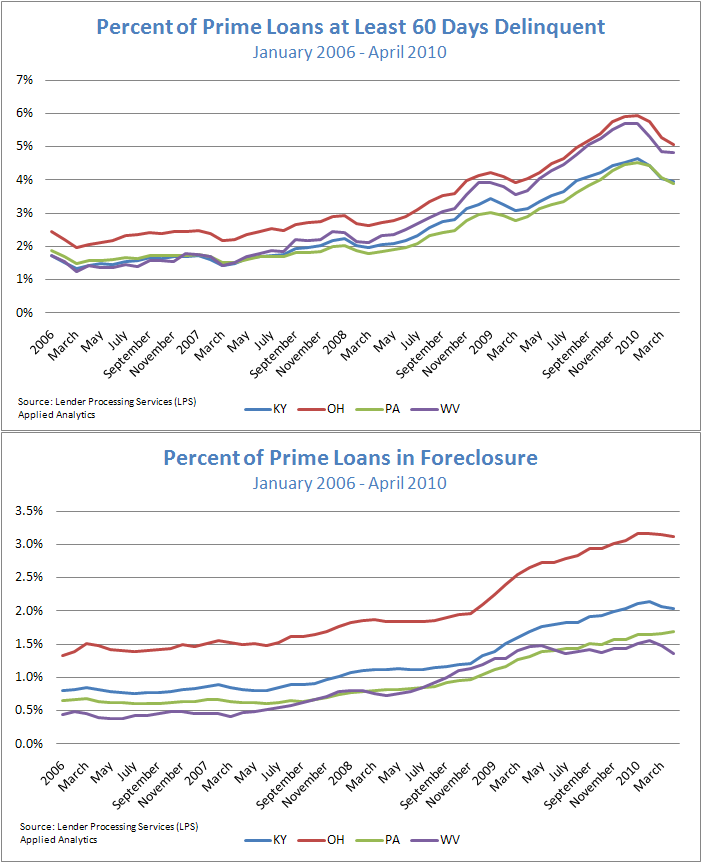
Trends in the performance of prime loans
5. The percent of prime loans at least 60 days delinquent are decreasing, but that may be due to the use of tax returns to remain current in mortgage payments. Prime loans in foreclosure remain elevated.
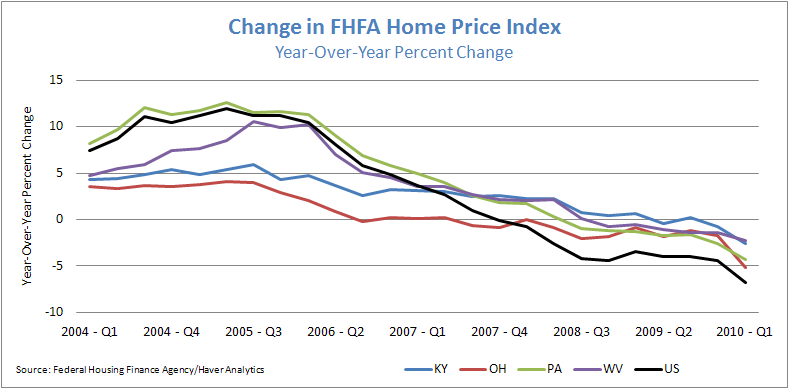
Change in home price index
6. According to the FHFA Home Price Index, home prices continue to fall in all Fourth District states as well as across the country: Kentucky prices are at 2007 levels, Pennsylvania and West Virginia are at 2006 levels, Ohio is at 2003 levels, and the U.S. is at 2005 levels.
These data briefs provide periodic snapshots of mortgage lending activity and foreclosure patterns in our District using the most recent data (check out this detailed, county-specific map of the 4th District). Delinquency and foreclosure data are from Lender Processing Services (LPS) Applied Analytics. The data include loan level servicing data for both securitized loans and loans held in portfolio from the top 10 residential mortgage servicers in the nation and others. Smaller servicers have less representation.