

Excess Savings and Consumer Behavior: Excess Compared to What?
How much accumulated savings do households hold, and what do these savings imply about future consumption? Economists typically consider excess savings when gauging the level of savings that households may use to maintain real consumption as costs rise. Economists have estimated strikingly different levels of currently held excess savings. We highlight the differences between measures of counterfactual savings—that is, the amount of savings households would be expected to hold barring unusual events—and their relevance in computing post pandemic excess savings. Furthermore, we show that, using counterfactual savings that rely on the idea of consumption smoothing, excess savings are currently positive in the case that households assume that recent income losses are transitory. These findings carry additional implications for expected personal consumption expenditure patterns.
The views authors express in Economic Commentary are theirs and not necessarily those of the Federal Reserve Bank of Cleveland or the Board of Governors of the Federal Reserve System. The series editor is Tasia Hane. This paper and its data are subject to revision; please visit clevelandfed.org for updates.
Introduction
Savings accumulated during the pandemic because of health policies1 and fear of infection that reduced consumption and because of government policies that attempted to sustain income levels (CARES Act, American Rescue Plan Act of 2021, among others). Some policymakers and market analysts interpreted this high level of accumulated savings as potential reserves that households might use to maintain consumption levels as costs rise. In fact, according to Barnes et al. (2022), between early 2020 and March 2022, the cumulative increase in bank deposits totaled nearly $4.9 trillion, representing the largest increase in bank deposits since data collection began in 1951. While households have partially drawn down their liquid assets, JP Morgan Chase Institute’s Household Pulse Report (Wheat and Deadman, 2023) shows that median cash balances are still 10 percent to 15 percent above their 2019 levels for every income quartile.2 Based on data from the Board of Governors of the Federal Reserve System’s Financial Accounts of the United States for households and nonprofit institutions serving households, released quarterly, our calculations show that households held about $6.1 trillion in savings in 2023:Q2.
Excess Savings: Concept and Calculations
How much of these savings comprise “excess savings” in the postpandemic economy? To answer this, one must clearly define “excess.” In other words, we must define an alternative or counterfactual level of savings to compare to the actual level of savings. There are two widely accepted definitions of excess savings relating to this period:
- Savings beyond what households would have if there had been no pandemic and none of the aforementioned policies had been implemented. In this case, the counterfactual savings would be the prepandemic savings level plus the savings that would have accumulated if savings grew at its prepandemic trend.
- Savings beyond what households would have chosen to save based on their situations and available information. In other words, the savings accrued because of restrictions on the economy that prevented households from consuming and saving their preferred amounts. In this case, to define counterfactual savings, we consider how households change their savings and consumption behavior as they receive unexpected income. Savings and consumption behavior will also depend on whether people expect additional payments to last (job promotion) or not (one-time bonus). In this case, savings should be considered “excess” only if something prevents individuals from making their preferred choice (for example, a lockdown preventing individuals from consuming the amount of goods and services they would prefer).
These definitions provide different counterfactual savings and consumption paths, or the amount of savings and consumption that would exist under the circumstances provided in either definition. Accordingly, estimates of excess savings and what to expect of accumulated savings as households respond to changes in the economy will vary depending on the definition.
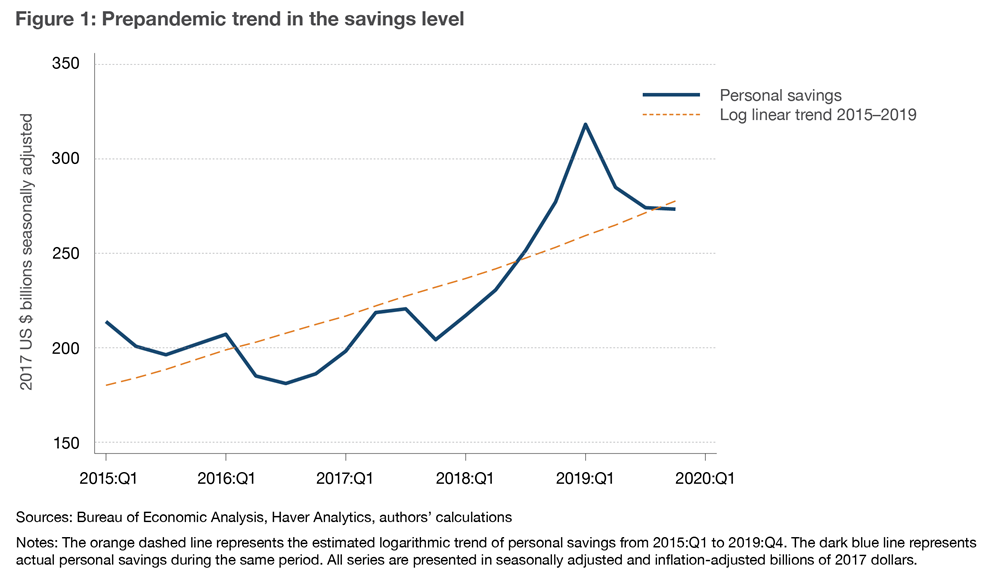
Three recent publications from the Federal Reserve System found significantly different levels of current excess savings. These studies differ methodologically by whether the study determines counterfactual savings using a prepandemic trend in the savings level or in the savings rate. That is, they calculate a growth trend on the total savings (level) or on the share of disposable income saved (rate) in a prepandemic period and assume that this growth trend would continue for the period 2020 forward if no pandemic had happened. The studies imposing a prepandemic trend in the savings level find positive current excess savings (Aladangady et al., 2022; Abdelrahman and Oliveira, 2023), while the study imposing a trend on the prepandemic savings rate finds negative current excess savings (de Soyres et al., 2023). The divergent results are the product of both different definitions of excess savings and different assumptions of household behavior. These differences have important implications for the expected future path of both savings and consumption in the current environment.
The use of a prepandemic trend in the savings level as counterfactual savings (the orange dashed line in Figure 1) is well-suited to a definition of excess savings as being savings beyond what households would have saved if there had been no pandemic and no stimulus payments. However, this counterfactual savings assumption disregards how households adjust their consumption and savings given an unexpected transitory windfall in income, such as the stimulus payments provided through the CARES Act and American Rescue Plan Act of 2021. If the counterfactual scenario is adjusted to align with the second definition of excess savings, one which includes stimulus payments, this approach assumes that households would have spent these transitory increases in income since counterfactual savings grows at a fixed schedule irrespective of transitory increases in income. Consequently, any increase in savings because of these transitory increases in income would be seen as a surprise that generates a surge in “excess savings.” However, it is clear from previous stimulus payments (in the form of tax rebates) that households tend to either save or pay down debt instead of increase consumption after receiving these payments (see Shapiro and Slemrod, 2009; Misra and Surico, 2014). Evidence from the most recent stimulus payments indicates that households again put money aside as so-called “rainy day” savings (Coibion et al., 2020). Since increased savings following an unexpected, one-time payment is expected household behavior, it would be odd to consider savings beyond the prepandemic trend as “excess” according to the second definition.
In contrast, the use of a prepandemic trend in the savings rate, rather than level, aligns with the second definition of excess savings because the methodology assumes that consumers adopt a particular rule of thumb regarding the percentage of income they will save and consume. In other words, when calculating the counterfactual level of savings used to determine excess savings, this approach assumes that households adjust their savings and consumption behavior in response to the CARES Act and the American Rescue Plan Act, but in a coarse manner. While there is some evidence that a fraction of consumers follows a particular rule of thumb (Campbell and Mankiw, 1989), the majority of the evidence found by Havranek and Sokolova (2020) contradicts this assumption. Consequently, this approach tends to underestimate how much households tend to save from unexpected transitory windfall in income. A significant portion of these expected savings resulting from transitory income shocks end up classified as “excess” or unexpected savings in this framework, a situation which leaves excess savings positive until 2021:Q3.
To capture households’ optimal behavior in estimating excess savings, we rely on the permanent income hypothesis (PIH), which also aligns with the second definition of excess savings because the PIH assumes that households adjust their savings to smooth consumption over time (Friedman, 1957). Thus, to smooth their consumption, households use their savings or borrow, as appropriate, when income is temporarily low and save when income is temporarily high. The PIH implies that during the pandemic, households should save most of the additional income received from government programs to use over time in order to keep their consumption smooth. Factors that prevented households from maintaining smooth consumption during 2020 and 2021 generate excess savings according to the PIH.
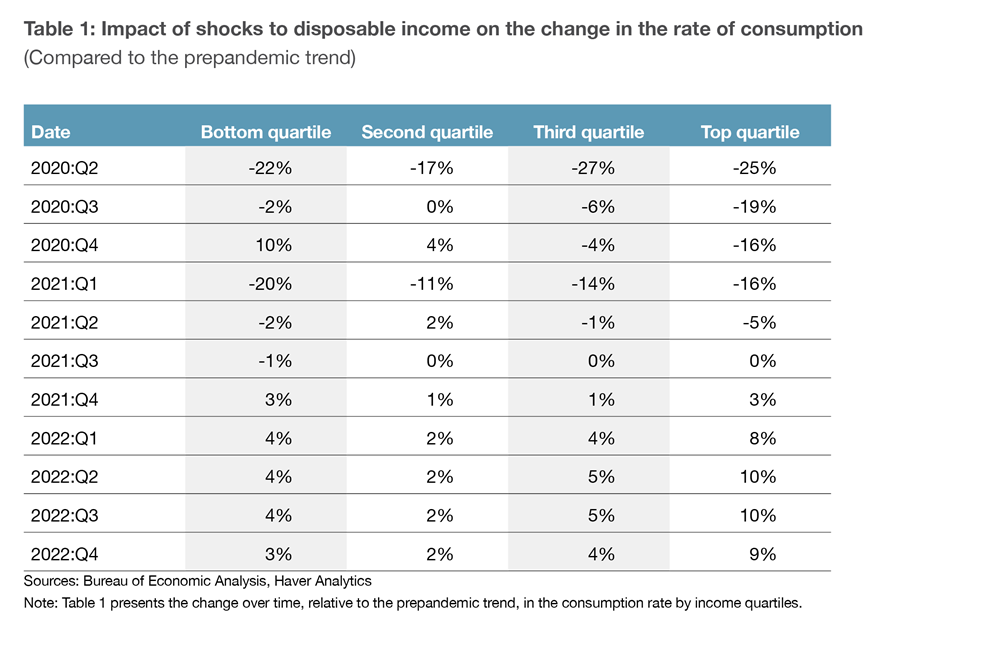
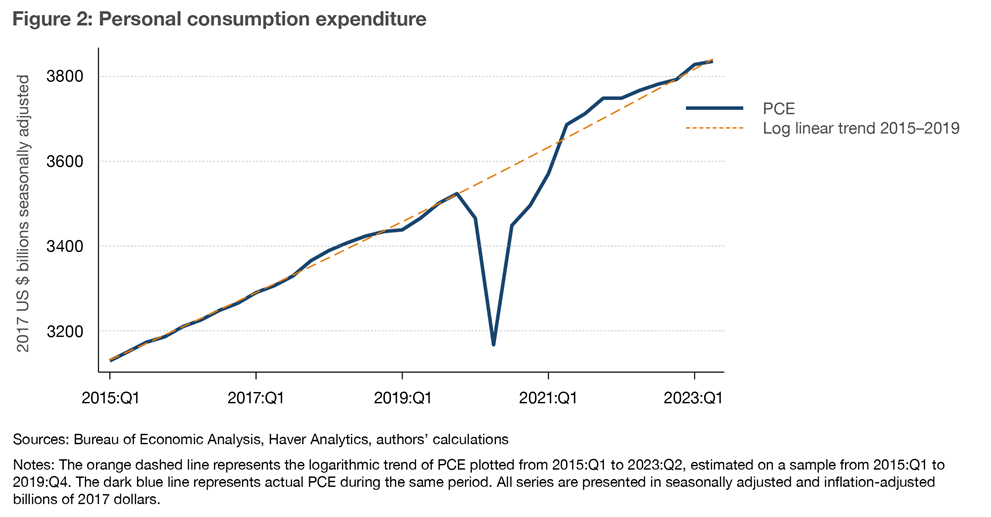
While this framework exploits households’ persistent and intuitive consumption behavior, it abstracts from credit and liquidity constraints and from heterogeneous behavior across income quartiles. For example, if a household lacks funds and cannot borrow in order to make a worthwhile purchase, any additional income received will likely be spent on this purchase instead of saved. Similarly, high-income individuals are more likely to save a higher percentage of any unexpected transitory windfalls in income than will those with a lower income. While abstracting from these dynamics could affect results, we believe their effects will be muted for two reasons. First, consumers in the bottom three income quartiles have similar consumption rates now relative to their consumption rates in 2021, as demonstrated in Table 1. Second, consumers returned to their trend level of prepandemic consumption (adjusted for inflation) once most health restrictions were lifted (see Figure 2).
Assuming that consumers want to smooth their consumption, we define counterfactual savings as
(1)
Counterfactual savings = net DPI - prepandemic trend in PCE level
where net DPI is the inflation-adjusted disposable personal income, net of personal interest payments and personal current transfer payments, and PCE is the inflation-adjusted personal consumption expenditure. Both are economic aggregates calculated by the Bureau of Economic Analysis (BEA). To calculate counterfactual savings, we assume that households consume so that PCE remains equal to its prepandemic trend (or follows the dashed orange line in Figure 2) with the remaining income saved. Figure 3(a) shows net DPI (dark blue line) and the prepandemic trend in PCE (dashed black line). The gray area between the black and dark blue lines is the counterfactual savings under the PIH, that is, the expected level of savings given that households want to smooth consumption. However, PCE deviated significantly from the trendline during 2020 (compare the solid red line in Figure 3(a) to the black dashed line) as pandemic restrictions and production-chain disruptions prevented households from consuming certain goods and services. As a result, actual savings (the difference between net DPI and PCE) deviated substantially from the counterfactual savings calculated based on the PIH. Figure 3(b) plots actual savings (dark blue line) against the counterfactual savings under the PIH (dashed orange line). The area between these two is excess savings according to the PIH in a particular quarter; most of the positive excess savings were accumulated in 2020. By 2021:Q1, the flow of excess savings approached zero, and by 2021:Q2, it was negative, but the gap is somewhat small since PCE is mostly back to prepandemic levels. Figure 4 shows cumulative excess savings starting in 2019:Q4. As demonstrated using the PIH to construct the counterfactual savings, cumulative excess savings remain positive and sizable.
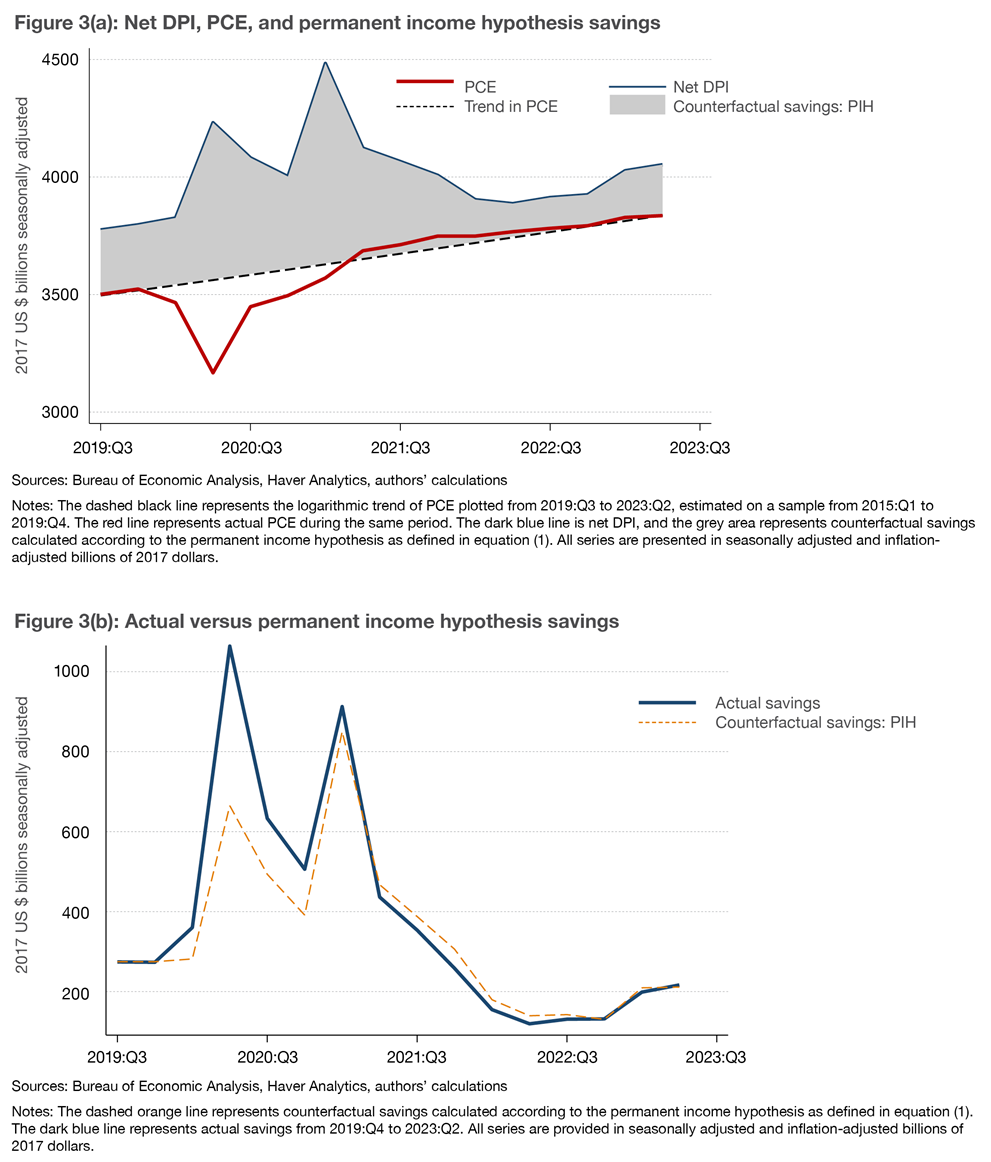
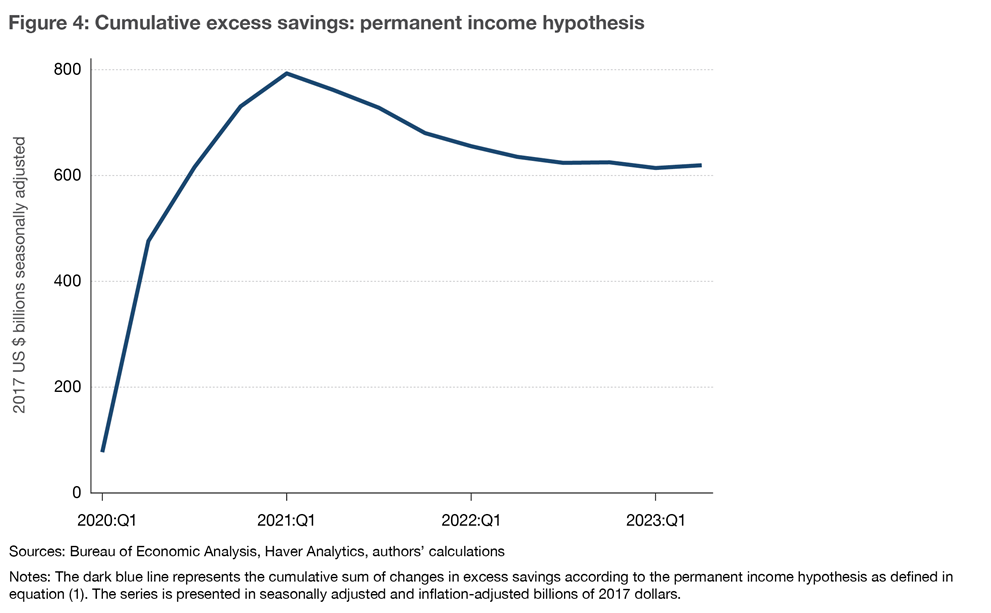
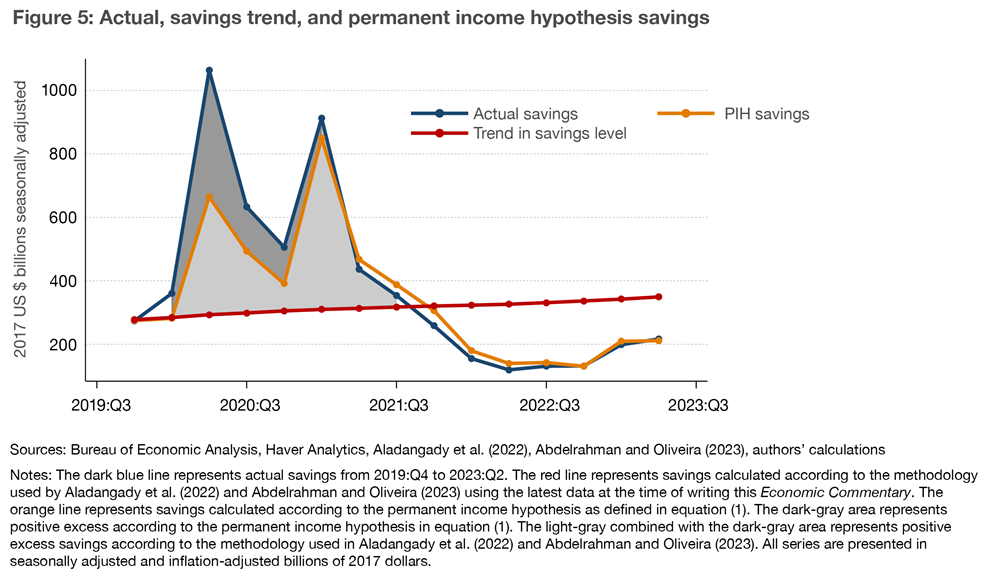
Figure 5 compares the counterfactual savings in Aladangady et al. (2022) and Abdelrahman and Oliveira (2023) against the counterfactual savings using the PIH and the actual savings from the BEA data. Notice that in the case of Aladangady et al. (2022) and Abdelrahman and Oliveira (2023), the counterfactual savings is the trend from the prepandemic savings level (the red line in Figure 5). Graphically, cumulative excess savings under this counterfactual combine both the light and dark gray areas in Figure 5 prior to 2021:Q3. Thereafter, as actual savings run below the trend, there is a deaccumulation of excess savings. In contrast, transitory shocks to income are saved under the PIH, so we see the counterfactual savings moving up with the fiscal actions that boosted disposable income (the orange line in Figure 5). Consequently, the only period in which we see significantly positive excess savings is in 2020:Q2 to 2020:Q4, the period in which real PCE significantly deviates from the prepandemic trend, as we show in Figure 2. Cumulative excess savings under the PIH represent only the dark gray area in Figure 5 because most of the savings that occurred would have been expected (and hence was not excess). From 2021:Q3 onward under the PIH, there is little deaccumulation, quite different from the case presented by Aladangady et al. (2022) and Abdelrahman and Oliveira (2023). The reason for this is that the counterfactual savings under PIH (orange line in Figure 5) takes into account the fact that households will optimally reduce savings in periods of temporarily lower income to smooth consumption. It is important that the income shock is perceived by households to be temporary in this calculation as otherwise households would deviate from their prepandemic consumption trend according to the PIH.
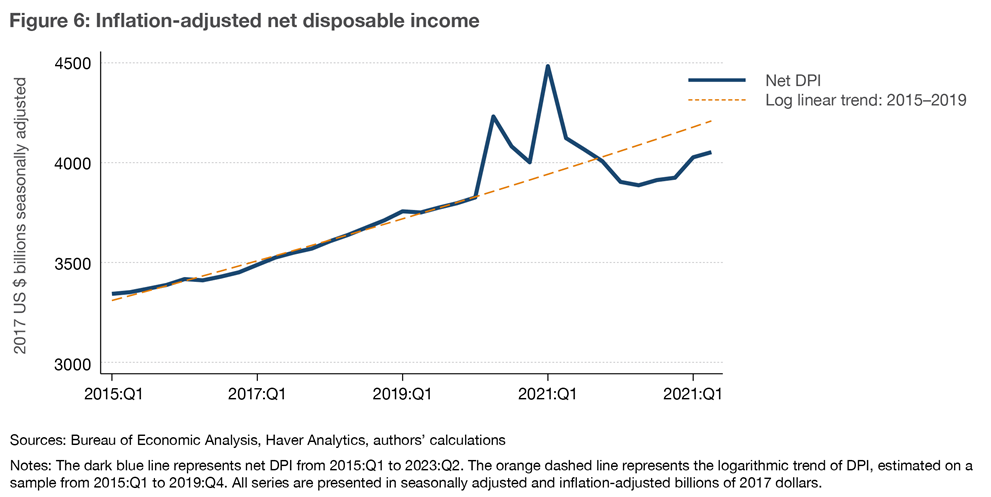
Another benefit of using the PIH as a counterfactual is that it guides our interpretation of incoming evidence. As we see in Figure 2, we have been back to the prepandemic trend in PCE since 2021:Q2, which is also when net DPI started drifting below its prepandemic trend, as shown in Figure 6. Following the PIH, these patterns indicate that households believe the negative shock of inflation on net DPI is temporary. Long-term inflation expectations were significantly lower than year-ahead expectations throughout this period, and consumers expect that changes in their financial situation in the next five years will be positive,3 a circumstance suggesting that consumers see recent shocks to their inflation-adjusted income as transitory. If households see these losses as transitory, it is unlikely that households will curb spending even if doing so requires reducing savings; the PIH implies households will seek to maintain inflation-adjusted consumption levels. In this case, the persistence of consumer spending may continue to drive inflation. That said, there is significant uncertainty regarding the likelihood that these losses to net DPI will be recouped. If households believe these losses will not be recovered, there will be a downward adjustment in PCE, and inflationary pressures may ease.
Conclusion
Many households accumulated savings during the pandemic that may help households boost their consumption, a situation which some policymakers and market analysts interpret as a potential source of inflationary pressure. Our calculations show that households in 2023:Q2 held about $6.1 trillion in savings. These accumulated savings may be helping households keep inflation-adjusted consumption levels at the prepandemic trend, even though net DPI has declined below the prepandemic trend. However, the discussion on excess savings fundamentally depends on the counterfactual savings measure used. In this Economic Commentary, we highlight the concept of consumption smoothing and how the PIH may aid in understanding households’ behavior when calculating excess savings following an income windfall. According to counterfactual savings determined by the PIH, excess savings are positive if households assume that the recent declines in disposable income are transitory. While there is evidence that households view recent declines in real income as transitory, implying continued inflationary pressure under the PIH, there is significant uncertainty regarding whether these declines will be recouped. If households believe they will not be recouped, household spending and inflationary pressures may ease.
References
- Abdelrahman, Hamza, and Luiz E. Oliveira. 2023. “The Rise and Fall of Pandemic Excess Savings.” FRBSF Economic Letter 2023 (11). https://ideas.repec.org/a/fip/fedfel/96090.html.
- Aladangady, Aditya, David Cho, Laura Feiveson, and Eugenio Pinto. 2022. “Excess Savings during the COVID-19 Pandemic.” FEDS Notes, October. https://doi.org/10.17016/2380-7172.3223.
- Barnes, Mitchell, Wendy Edelberg, Sara Estep, and Moriah Macklin. 2022. “Bolstered Balance Sheets: Assessing Household Finances since 2019.” Economic Analysis. Brookings. https://www.brookings.edu/articles/bolstered-balance-sheets-assessing-household-finances-since-2019/.
- Campbell, John Y., and N. Gregory Mankiw. 1989. “Consumption, Income, and Interest Rates: Reinterpreting the Time Series Evidence.” NBER Macroeconomics Annual 4: 185–216. https://doi.org/10.1086/654107.
- Coibion, Olivier, Yuriy Gorodnichenko, and Michael Weber. 2020. “How Did US Consumers Use Their Stimulus Payments?” Working paper 27693. National Bureau of Economic Research. https://doi.org/10.3386/w27693.
- De Soyres, Francois, Dylan Moore, and Julio Ortiz. 2023. “Accumulated Savings during the Pandemic: An International Comparison with Historical Perspective,” June. https://doi.org/10.17016/2380-7172.3326.
- Friedman, Milton. 1957. “The Permanent Income Hypothesis.” In A Theory of the Consumption Function, 20–37. Princeton University Press. https://doi.org/10.2307/j.ctv39x7zh.6.
- Havranek, Tomas, and Anna Sokolova. 2020. “Do Consumers Really Follow a Rule of Thumb? Three Thousand Estimates from 144 Studies Say ‘Probably Not.’” Review of Economic Dynamics 35 (January): 97–122. https://doi.org/10.1016/j.red.2019.05.004.
- Lunsford, Kurt G. 2023. “The Discrepancy between Expenditure- and Income-Side Estimates of US Output.” Economic Commentary, no. 2023-01 (January). https://doi.org/10.26509/frbc-ec-202301.
- Misra, Kanishka, and Paolo Surico. 2014. “Consumption, Income Changes, and Heterogeneity: Evidence from Two Fiscal Stimulus Programs.” American Economic Journal: Macroeconomics 6 (4): 84–106. https://doi.org/10.1257/mac.6.4.84.
- Shapiro, Matthew D., and Joel Slemrod. 2009. “Did the 2008 Tax Rebates Stimulate Spending?” American Economic Review 99 (2): 374–79. https://doi.org/10.1257/aer.99.2.374.
- Wheat, Chris, and Erica Deadman. 2023. “Household Pulse: Balances through March 2023.” JPMorgan Chase Institute. https://www.jpmorganchase.com/institute/research/household-income-spending/household-pulse-cash-balances-through-March-2023.
Endnotes
- For example, lockdowns and restrictions on the number of occupants in restaurants and at gatherings. Return to 1
- JP Morgan and Chase Institute’s database includes information for roughly 9 million Chase customers. Return to 2
- University of Michigan Survey of Consumers. Return to 3
Suggested Citation
DeLuca, Martin, and Roberto B. Pinheiro. 2023. “Excess Savings and Consumer Behavior: Excess Compared to What?” Federal Reserve Bank of Cleveland, Economic Commentary 2023-19. https://doi.org/10.26509/frbc-ec-202319
This work by Federal Reserve Bank of Cleveland is licensed under Creative Commons Attribution-NonCommercial 4.0 International


- Share