

- Share
Trends in Revenues at US Colleges and Universities, 1987-2013
This Economic Commentary studies trends in inflated-adjusted revenues per student at US colleges and universities in broad revenue categories between 1987 and 2013. The findings show that, as is widely perceived, tuition revenue has risen over time at both public and private institutions. In recent years, tuition revenue at public institutions has been nearly as large a source of revenue as state and local government funding has been. Revenue from state and local governments has fluctuated at public institutions but has generally fallen over time, whereas funding from the federal government has risen. Investment returns are a large and highly variable source of revenue, especially for private institutions.
The views authors express in Economic Commentary are theirs and not necessarily those of the Federal Reserve Bank of Cleveland or the Board of Governors of the Federal Reserve System. The series editor is Tasia Hane. This paper and its data are subject to revision; please visit clevelandfed.org for updates.
Spending by colleges and universities in the United States has risen in a variety of expenditure categories (Hinrichs 2016b). How are these expenditures financed? In other words, from what sources do institutions of higher education receive their revenue? It is widely perceived that tuition has been rising and state support for public universities has been falling, but how do different sources of revenue compare to each other and how has this changed over time?
To answer these questions, this Commentary studies the inflation-adjusted per-student revenues received by US colleges and universities in broad revenue categories between 1987 and 2013. The findings show that tuition revenue per student has risen at both public and private institutions over time. In recent years, tuition revenue at public institutions has been nearly as large a source of revenue as state and local government funding has been. Revenue from state and local governments has fluctuated but has generally fallen over time at public institutions, whereas funding from the federal government has risen. Investment returns are a large and highly variable source of revenue, especially for private institutions.
In an earlier Commentary (Hinrichs 2016a), I studied the employment mix in higher education. A second Commentary (Hinrichs 2016b) studied expenditures. In studying revenues, this Commentary adds to the earlier two Commentaries to form a more complete picture of higher education finance.
Delta Cost Project Data
I use revenue data from the Delta Cost Project. The data are derived from the Integrated Postsecondary Education Data System (IPEDS) surveys, which are conducted annually by the US Department of Education’s National Center for Education Statistics. IPEDS has extremely broad coverage because colleges and universities that participate in federal student aid programs are required to respond to the surveys. The IPEDS surveys have changed somewhat over time, and the IPEDS finance questions also differ based on the accounting standard used by an institution. The Delta Cost Project attempts to combine data from the various versions of the IPEDS surveys in a consistent manner.
The Delta Cost Project has conducted a number of original analyses of higher education finance in the United States. These analyses, as well as the Delta Cost Project data, can be found at http://www.deltacostproject.org.
One difference between this analysis and those of the Delta Cost Project is that I study a larger set of years than the individual Delta Cost Project reports do. Furthermore, I use all available observations rather than limiting the sample to institutions that appear in the data every year. Moreover, I focus on means across all students rather than on medians across institutions.
I study revenue per student in the following five major revenue categories:
- Tuition
- Federal appropriations, grants, and contracts
- State and local appropriations, grants, and contracts
- Private gifts
- Investment return.
One note about these categories is that the measure of tuition revenue that I use excludes grants to students made directly by the institution. In addition, the variable measuring revenue from federal sources excludes Pell grants.
I use the Consumer Price Index to convert values to 2013 dollars per full-time equivalent student. The analysis includes only four-year public institutions and not-for-profit private institutions in the 50 states and the District of Columbia. It excludes for-profit private institutions, two-year and less-than-two-year institutions, and institutions that are in US territories such as Puerto Rico or associated states such as the Marshall Islands. The analysis is based on the fiscal year, beginning with the 1987 fiscal year and ending with the 2013 fiscal year. As in Hinrichs (2016b), I exclude from the analysis institutions that have revenue variables reported as missing. However, this choice has little impact on the results.
Trends in Revenues at Colleges and Universities
Figure 1 shows that tuition revenue per student at public universities has risen dramatically during the 1987–2013 time period. The level was around $3,600 in 1987 but had reached $9,300 by 2013. Tuition revenue per student at public institutions has increased every year, although the pace of the year-over-year increase in dollar terms picked up around 2003.
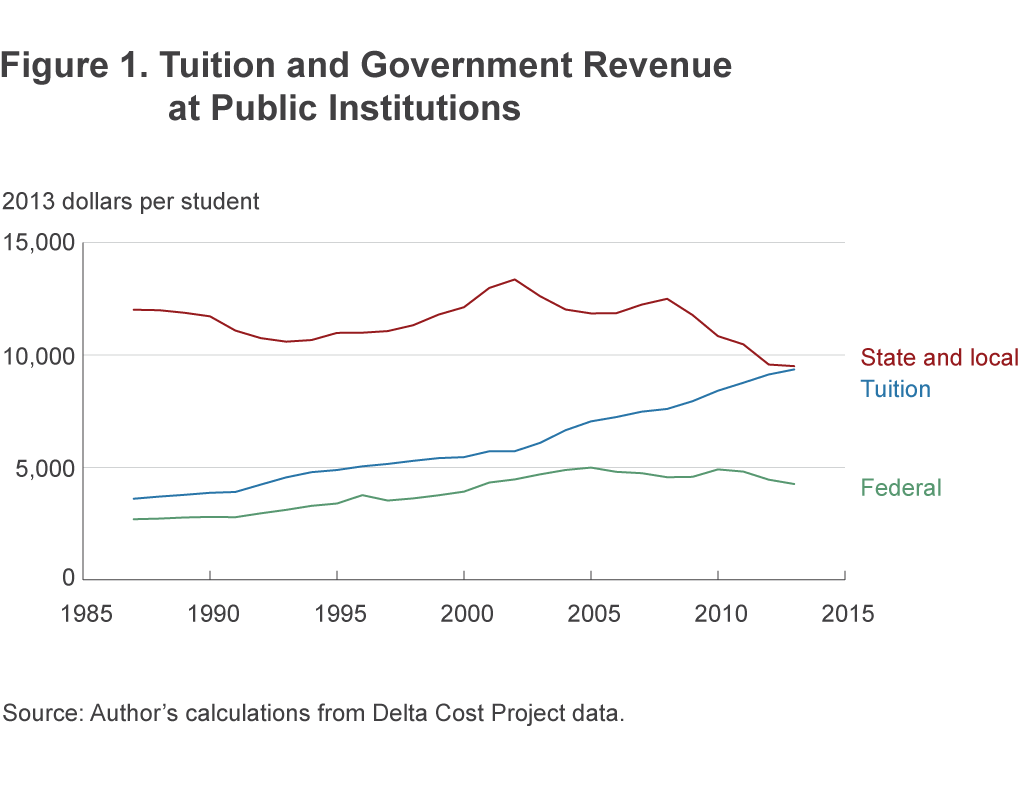
While tuition revenue per student has continually risen at public universities, revenue from state and local governments has fluctuated but has generally fallen over time. There was a period of increase from 1993 through 2002 and another from 2005 through 2008. The other time periods shown in the figure were periods of decline, and in 2013 this variable reached its lowest level of the 1987–2013 period. The trends for tuition revenue and revenue from state and local sources are quite different for public colleges and universities. Revenue from state and local sources was more than three times the level of revenue from tuition for public institutions in 1987, but by 2013 tuition revenue was nearly equal to revenue from state and local sources.
Despite a small decline in recent years, revenue from the federal government has generally risen over time, even as revenue from state and local governments has fallen. However, the increase in revenue from the federal government has not been as large as the increase in tuition revenue.
Figure 2 shows that tuition revenue at private institutions has risen over the years, just as it has at public institutions. But a comparison of figure 2 to figure 1 shows that the level of tuition revenue per student is higher at private institutions than at public institutions. In fact, the level of tuition revenue per student at private institutions in 1987 was substantially higher than the level at public institutions in 2013. The value at private institutions has risen continually and had reached nearly $20,000 per student by 2013.
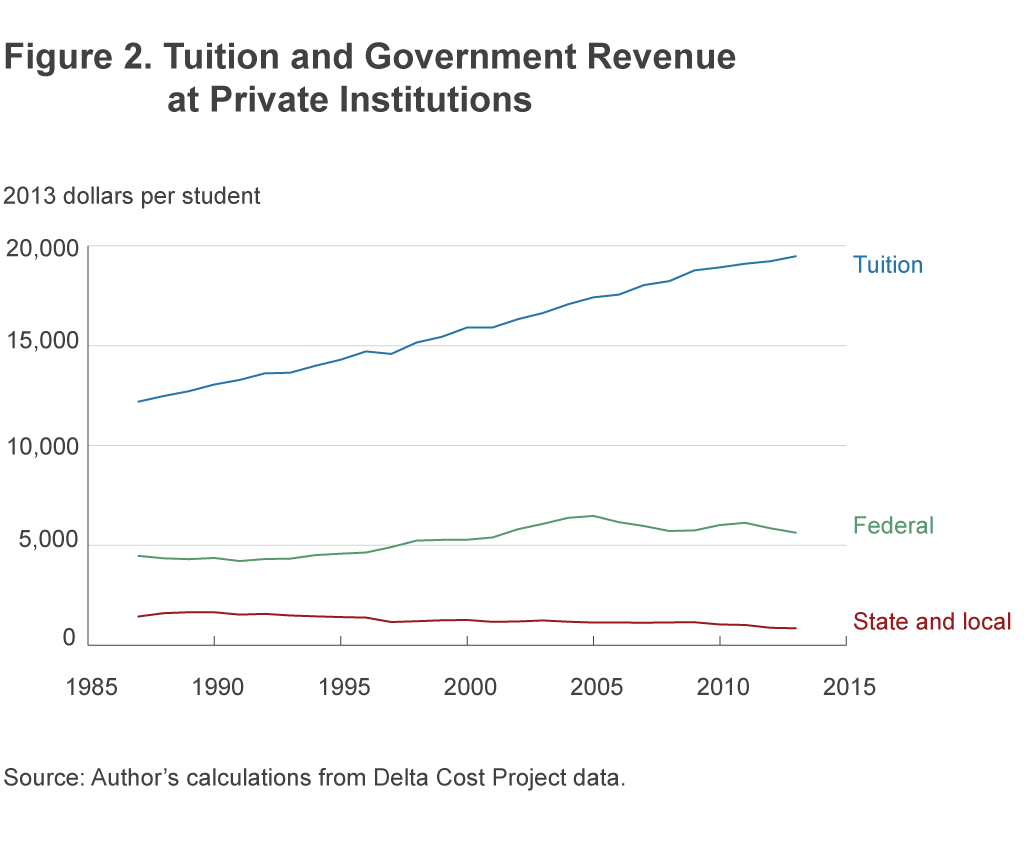
Private institutions are not as reliant on revenue from state and local governments as public institutions are. However, they did receive around $850 of revenue per student from state and local governments in 2013, a figure which has fallen somewhat over time. The federal government is a fairly large source of revenue for private institutions, providing around $5,600 per student in 2013.
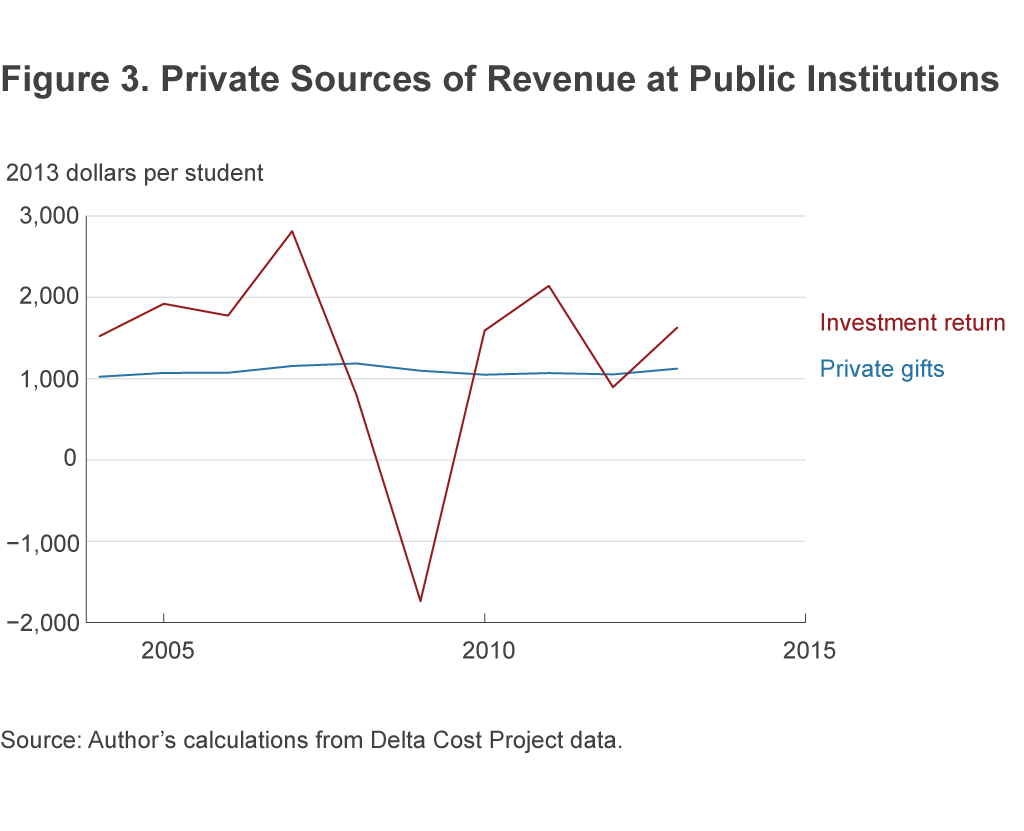
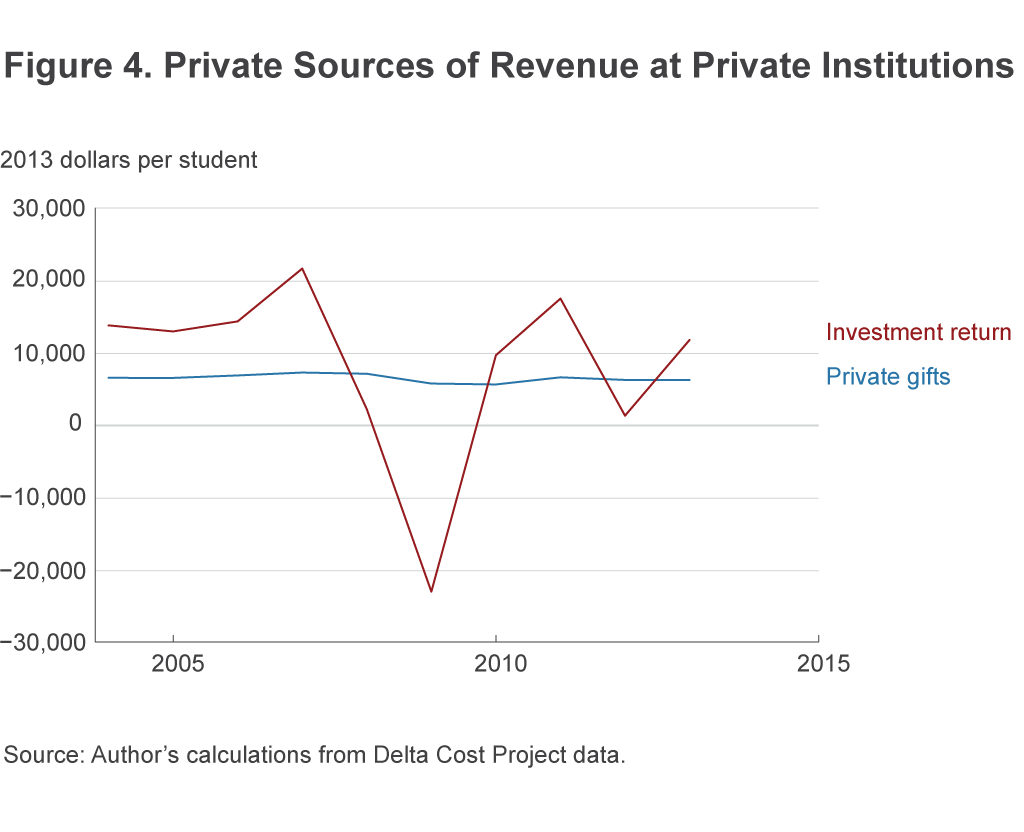
The way that colleges report private sources of revenue such as donations and endowment earnings to IPEDS has changed in ways that complicate comparisons across institutions or over time. To examine these sources of revenue, I thus focus on a more limited set of years in which the data are likely more comparable, 2004–2013. Although some caution is still warranted in interpreting the results, figures 3 and 4 show that investment returns are a large but volatile source of revenue for colleges and universities in the United States. This is especially true for private institutions. Investment returns for private institutions were nearly $22,000 per student during the 2007 fiscal year, but they had fallen well into negative territory during the recession two years later. Public institutions also saw a swing from positive to negative, albeit with smaller magnitudes. Finally, private gifts are a large source of revenue for private institutions and less so for public institutions. The value of private gifts has fluctuated somewhat over time with the overall state of the economy, although the fluctuation is not nearly as large as the fluctuation in investment returns.
Conclusion
The results of this analysis show that tuition revenue per student has risen dramatically from 1987 to 2013 at both public and private colleges and universities. Meanwhile, revenue from state and local governments has generally fallen over time at public institutions, to the point that revenue from state and local governments at these institutions has recently been only slightly higher than revenue from student tuition. While funding from state and local governments has fallen, funding from the federal government has risen. For private institutions, investment returns are a large and highly variable source of revenue.
Unless colleges are able to reduce spending, it is likely that a reduction in revenue from one source will be met with an increase from another source. For example, if state and local support for higher education continues to fall, tuition may continue to rise.
References
- Hinrichs, Peter, 2016a. “Trends in Employment at US Colleges and Universities, 1987–2013,” Federal Reserve Bank of Cleveland, Economic Commentary, 2016-05.
- Hinrichs, Peter, 2016b. “Trends in Expenditures by US Colleges and Universities, 1987–2013,” Federal Reserve Bank of Cleveland, Economic Commentary, 2016-10.
Suggested Citation
Hinrichs, Peter L. 2017. “Trends in Revenues at US Colleges and Universities, 1987-2013.” Federal Reserve Bank of Cleveland, Economic Commentary 2017-05. https://doi.org/10.26509/frbc-ec-201705
This work by Federal Reserve Bank of Cleveland is licensed under Creative Commons Attribution-NonCommercial 4.0 International

