

- Share
Trends in Employment at US Colleges and Universities, 1987–2013
This Economic Commentary studies employment at colleges and universities in the United States between 1987 and 2013. Some of the results from this analysis are in line with conventional wisdom. For example, I document that a declining proportion of faculty are full-time employees. On the other hand, some of the results are counter to popular belief. For example, I find that the share of college employees who are executives, administrators, or managers has not changed appreciably over time.
The views authors express in Economic Commentary are theirs and not necessarily those of the Federal Reserve Bank of Cleveland or the Board of Governors of the Federal Reserve System. The series editor is Tasia Hane. This paper and its data are subject to revision; please visit clevelandfed.org for updates.
A number of commentators have argued that the priorities of colleges and universities in the United States are misplaced. One area of concern is the growth of amenities, such as recreation centers and lavish dormitories.1 Additionally, some have argued that a proliferation of administrators is responsible for the rising cost of college.2 Meanwhile, there is also concern about the increasing role of part-time adjuncts and other nontraditional faculty.3
Many of the issues in higher education that have caused concern are related to employment, and much of what is known about these issues is based on anecdote or on a limited use of data. There has been little systematic study of employment in higher education.
This Economic Commentary explores trends in employment at colleges and universities in the United States between 1987 and 2013. Some of the results from this analysis are in line with conventional wisdom. For example, I document that a declining proportion of faculty are full-time employees. On the other hand, some of the results are counter to popular belief. For example, I find that the share of college employees who are executives, administrators, or managers has not changed appreciably over time.
IPEDS Fall Staff Survey
I use data from the Integrated Postsecondary Education Data System (IPEDS) Fall Staff survey. IPEDS is conducted by the National Center for Education Statistics in the US Department of Education. It is roughly a census of colleges and universities, and thus coverage is very broad. I use data on fall employment by occupational category at four-year colleges in the United States in the odd-numbered years between 1987 and 2013.4 I drop data from 1991 due to data irregularities.5 The number of institutions covered by this analysis rises over time from 2,585 in 1987 to 3,065 in 2013.
Between 1987 and 2011, the IPEDS data report for each university the number of full-time and the number of part-time employees in the following seven mutually exclusive and exhaustive categories:
- Faculty
- Executive/administrative/managerial
- Other professionals
- Technical and paraprofessionals
- Clerical and secretarial
- Skilled crafts
- Service/maintenance.6
In 2012, the employment categorization in IPEDS changed dramatically. Neither of the two IPEDS categorizations is a partition of the other, which complicates comparisons of the 2013 data to the 1987–2011 data. However, the newer categorization includes more categories than the earlier categorization, which may allow for a better accounting of employment even though the data are not comparable across years. The new employment categories are again mutually exclusive and exhaustive:
- Instructional staff
- Research staff
- Public service staff
- Librarians, curators, and archivists7
- Student and academic affairs and other education service occupations
- Management occupations
- Business and financial operations occupations
- Computer, engineering, and science occupations
- Community, social service, legal, arts, design, entertainment, sports, and media occupations
- Healthcare practitioners and technical occupations
- Service occupations
- Sales and related occupations
- Office and administrative support occupations
- Natural resources, construction, and maintenance occupations
- Production, transportation, and material moving occupations.
The National Center for Education Statistics provides a rough crosswalk between the earlier and later IPEDS employment classification on its website.8 I provide further information in the data appendix on the guidance given in the survey instructions regarding the distinctions between the various employment categories.
Trends in Employment Shares
The faculty group is the largest of IPEDS’ seven pre-2013 categories, and it has been growing relative to the other groups (figure 1). Although the largest group, faculty still comprise only 40 percent of total employees in 2011.
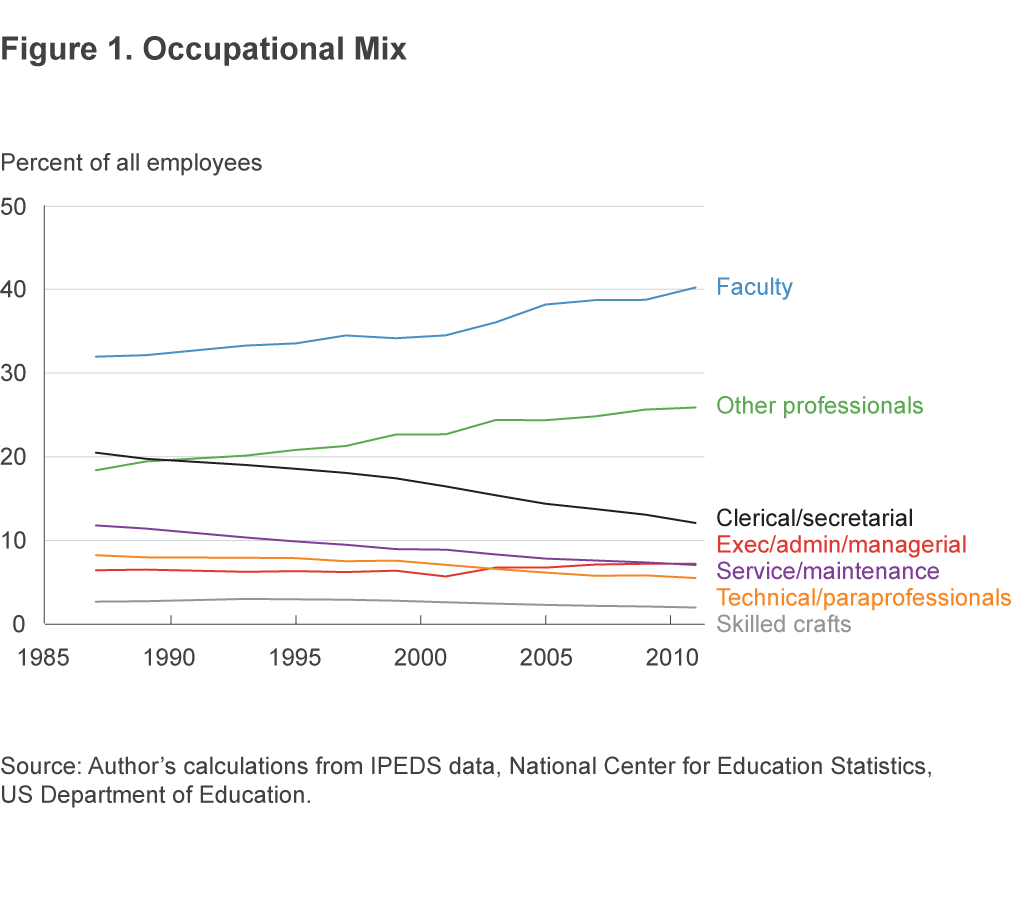
Another category that has grown steadily relative to the others is other professionals, which includes a broad set of workers, including human resources specialists, computer specialists, lawyers, and librarians. This category grew from 18 percent of employees in 1987 to 26 percent in 2011. The growth of this category suggests that there has been an increase in the number of support staff who themselves are college educated. Whether the increase is seen as desirable or undesirable may depend on which occupations within the category are responsible for the increase, but this cannot be determined from the 1987–2011 data. The 2013 data that I discuss later may provide some insight into the relative sizes of several occupations within this category.
In contrast to faculty and other professionals, the share of employees who are in the clerical and secretarial category has steadily fallen, from 20 percent in 1987 to 12 percent in 2011. The other categories have remained roughly flat, although there is a slight decline in the relative size of the service/maintenance category. The reasons for this decline are not discernable from the IPEDS data alone, although one possibility is the type of on-site outsourcing discussed by Goldschmidt and Schmieder (2015). Finally, perhaps counter to conventional wisdom, the share of employees in executive, administrative, and managerial jobs has not risen dramatically over time.
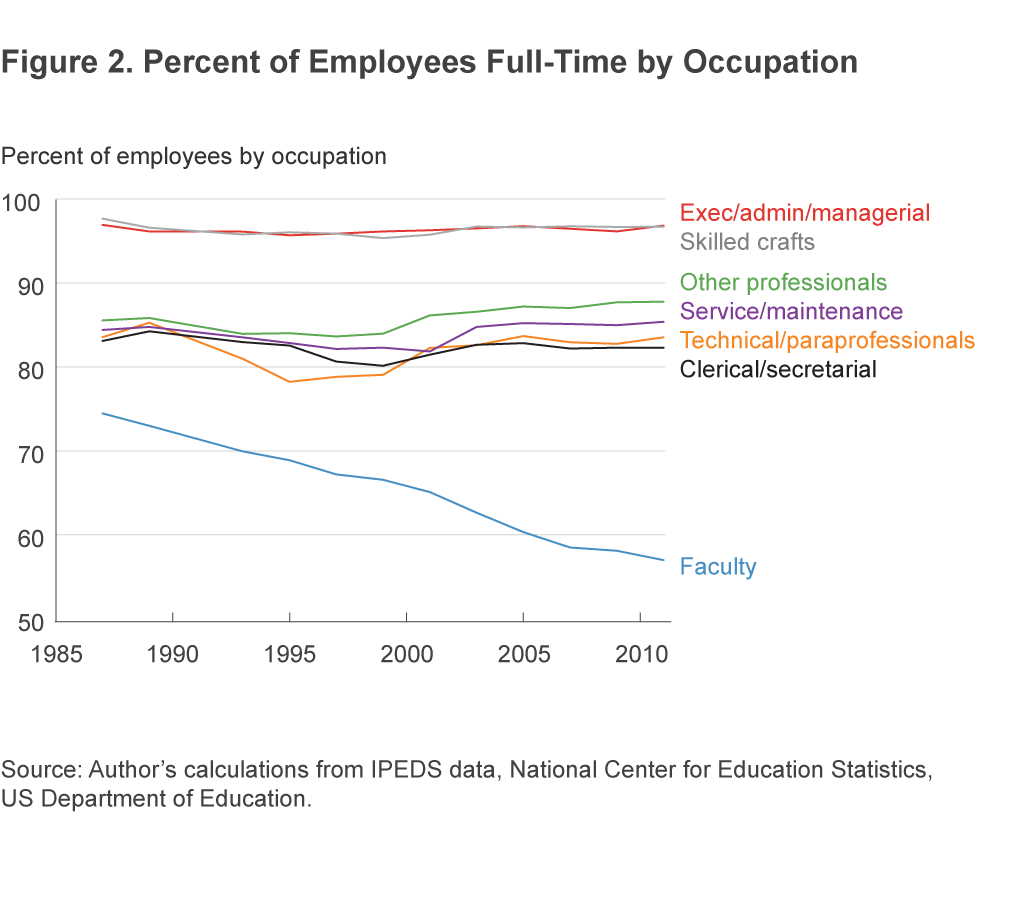
The share of faculty who are full-time employees has indeed fallen over time (figure 2). On the other hand, the shares of employees in the other categories who work full time have not changed appreciably.
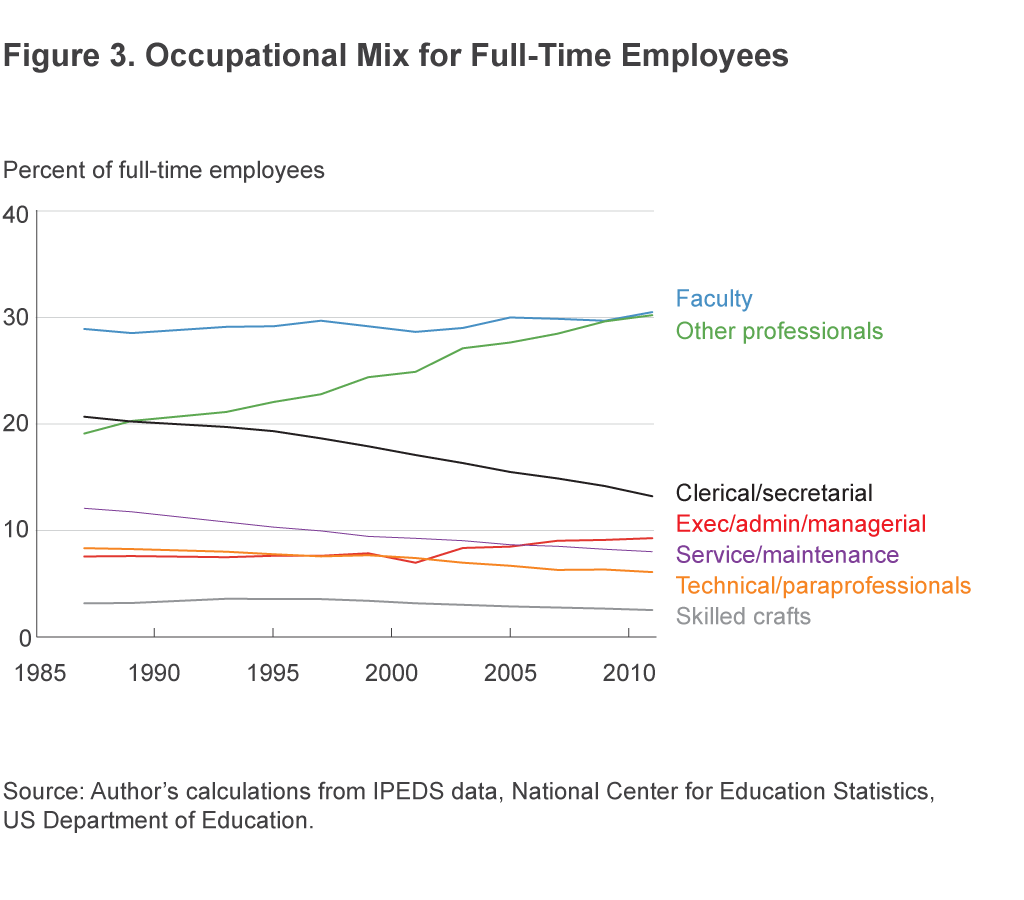
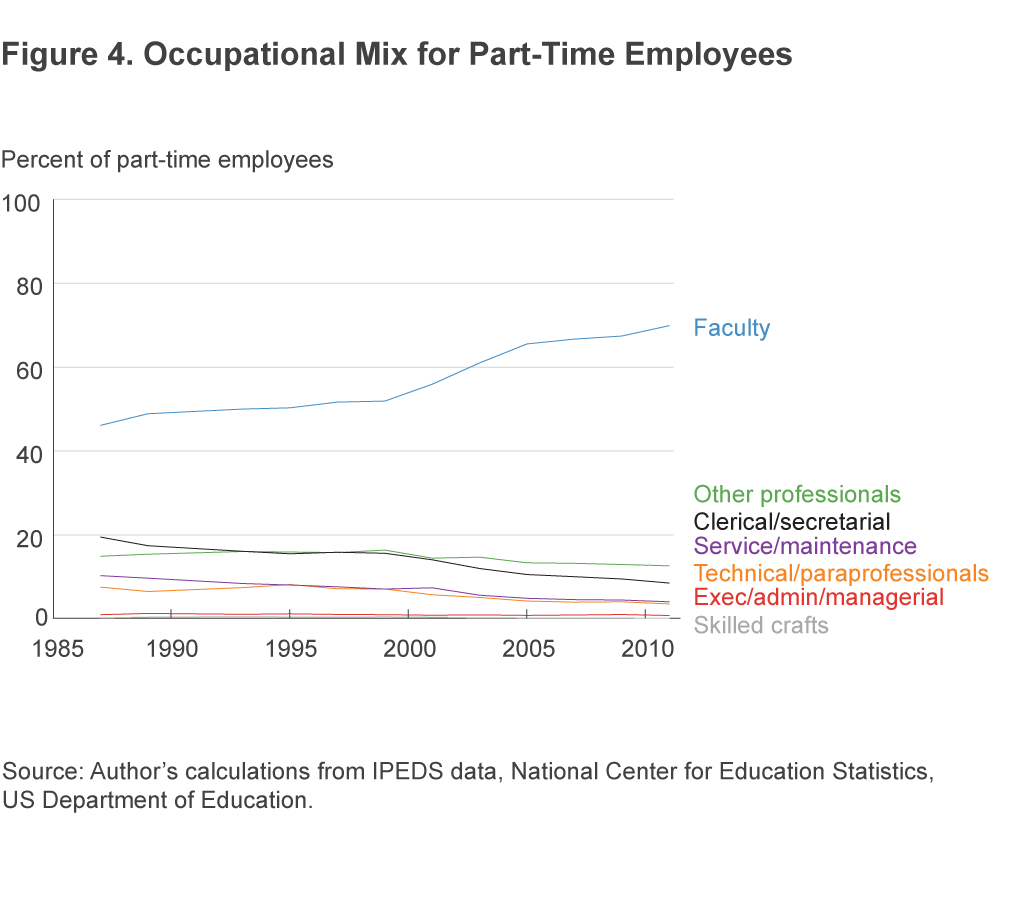
In recent years there has been roughly an equal number of full-time employees who are faculty and who are in the other professionals category (figure 3). Moreover, figure 3 reflects the fact that the growth in the other professionals category observed in figure 1 is coming about due to growth in full-time employees in this category, whereas figure 4 reflects the fact that the growth in faculty seen in figure 1 can be accounted for by growth in part-time faculty. However, the share of full-time employees who are faculty has not changed dramatically. Additionally, the shares of part-time employees and full-time employees who are administrators have also stayed steady. These patterns suggest that the number of full-time equivalent faculty may have actually risen relative to the number of full-time equivalent administrators.
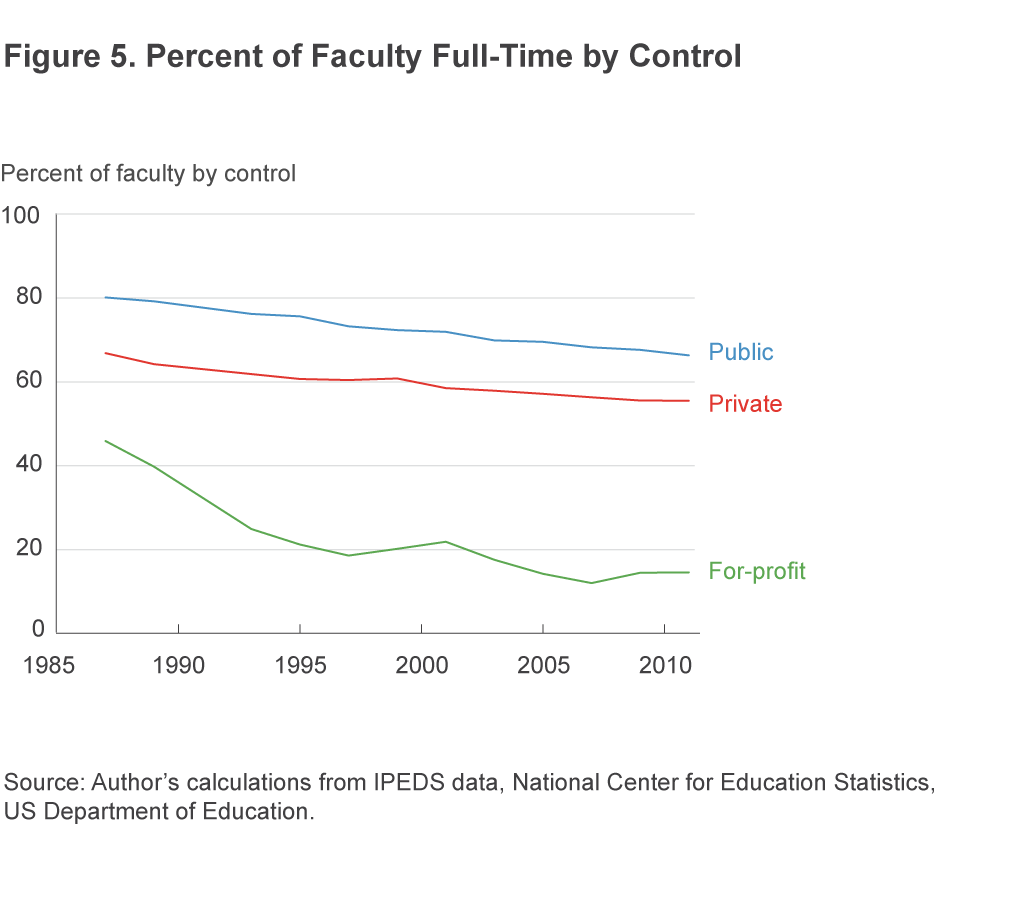
The shares of faculty who are full-time employees differ by institutional control—public, not-for-profit private, and for-profit. The percentage of full-time faculty is higher in the public sector than in the private sector, which is in turn higher than in the for-profit sector (figure 5). Furthermore, the decline in the share of full-time faculty discussed above has occurred in every sector. It is not, for example, solely an artifact of the growing size of the for-profit sector, which employs a higher share of part-time faculty than the other two sectors do.
The data using the new IPEDS classification scheme are consistent with the results using the earlier scheme. About 41 percent of employees are instructional staff, research staff, or public service staff in 2013 (table 1).9 But even though the instructional staff category represents only 37 percent of employees overall, this is still the largest employment category by a wide margin. The next-largest categories are office and administrative support (13 percent); management occupations (8 percent); computer, engineering, and science occupations (7 percent); and service occupations (7 percent).
| Occupational category | Overall | Full-time | Part-time |
|---|---|---|---|
| Instructional staff | 37 | 27 | 66 |
| Research staff | 3 | 3 | 2 |
| Public service staff | 1 | 1 | 1 |
| Librarians, curators, and archivists | 1 | 2 | 1 |
| Student and academic affairs | 4 | 4 | 4 |
| Management occupations | 8 | 10 | 1 |
| Business and financial operations | 6 | 7 | 2 |
| Computer, engineering, and science | 7 | 9 | 3 |
| C/SS/L/A/D/E/S/M* | 5 | 6 | 3 |
| Healthcare practitioners and technical | 4 | 4 | 3 |
| Service occupations | 7 | 8 | 4 |
| Sales and related occupations | 0 | 0 | 0 |
| Office and administrative support | 13 | 15 | 8 |
| Natural resources, construction, and maintenance | 2 | 3 | 0 |
| Production, transportation, and material moving | 1 | 1 | 0 |
*Note: C/SS/L/A/D/E/S/M stands for community, social service, legal, arts, design, entertainment, sports, and media occupations.
Source: Author’s calculations from IPEDS data, National Center for Education Statistics, US Department of Education.
Who exactly are the other professionals in the 1987–2011 data? Some information about this may be gleaned by examining the occupational mix in 2013 along with the crosswalk between the earlier and later IPEDS employment classification mentioned earlier. In particular, the category computer, engineering, and science occupations and the category business and financial operations occupations both have fairly large employment shares (7 percent and 6 percent, respectively) and both, according to the aforementioned crosswalk, include employees that would be included in the other professionals category. In the case of the post-2012 business and financial operations occupations category, all of the employees in that category would have been included in the pre-2012 other professionals category. This suggests that a fairly high share of the other professionals are individuals who work in business and financial operations occupations.
On the other hand, the post-2012 computer, engineering, and science occupations category also includes employees who would fall under the technical and paraprofessional category. Moreover, it is not clear from the data how many of the computer, engineering, and science occupations employees would be considered other professionals and how many would fall under the technical and paraprofessional category. The fact that the workers in the post-2012 computer, engineering, and science occupations category would fall under multiple pre-2012 categories illustrates the difficulty of making comparisons between the pre-2012 data and the post-2012 data.
When comparing the results for 2013 across the three sectors, it is clear that the employment mix at for-profits is quite different than the employment mix of the other two sectors (table 2). Instructional staff comprise a higher percentage of employees at for-profits than in the other two sectors, although this is due to the prevalence of part-time instructional staff at for-profits. In contrast to public colleges and private colleges, for-profits employ virtually no research staff. For-profits also have a lower share in the business and financial operations category; the computer, engineering, and science occupations category; the service occupations category; and the healthcare practitioners and technical occupations category compared to the other two sectors. For-profits have a higher share of employees in the student and academic affairs category and the sales and related occupations category. These differences are generally in line with the business model of for-profits described by Deming, Goldin, and Katz (2012).
| Occupational category | All employees | Full-time employees | ||||
|---|---|---|---|---|---|---|
| Public | Private | For-profit | Public | Private | For-profit | |
| Instructional staff | 34 | 38 | 63 | 28 | 27 | 22 |
| Research staff | 3 | 3 | 0 | 3 | 3 | 0 |
| Public service staff | 1 | 1 | 0 | 1 | 1 | 0 |
| Librarians, curators, and archivists | 1 | 2 | 1 | 1 | 2 | 1 |
| Student and academic affairs | 4 | 4 | 6 | 3 | 3 | 12 |
| Management occupations | 7 | 9 | 7 | 8 | 12 | 15 |
| Business and financial operations | 7 | 5 | 3 | 8 | 7 | 6 |
| Computer, engineering, and science | 9 | 7 | 1 | 10 | 8 | 3 |
| C/SS/L/A/D/E/S/M* | 5 | 5 | 4 | 5 | 6 | 9 |
| Healthcare practitioners and technical | 5 | 4 | 0 | 5 | 4 | 0 |
| Service occupations | 8 | 7 | 1 | 9 | 8 | 2 |
| Sales and related occupations | 0 | 0 | 2 | 0 | 0 | 4 |
| Office and administrative support | 14 | 13 | 12 | 14 | 15 | 25 |
| Natural resources, construction, and maintenance | 3 | 2 | 0 | 4 | 2 | 0 |
| Production, transportation, and material moving | 1 | 0 | 0 | 1 | 0 | 0 |
*Note: C/SS/L/A/D/E/S/M stands for community, social service, legal, arts, design, entertainment, sports, and media occupations.
Source: Author’s calculations from IPEDS data, National Center for Education Statistics, US Department of Education.
Conclusion
The results of this analysis suggest that the share of employees at colleges who are administrators has not been much higher in recent years than it was in 1987. There has been growth, though, in the other professionals employment category. This growth is potentially related to a growth of amenities and other programs outside of the teaching and research that have been the traditional focus of colleges and universities, although this is difficult to ascertain due to the broad nature of this category. An additional result in the analysis is that the share of faculty who are full-time employees has been declining. This decline has occurred within the public sector, the private sector, and the for-profit sector.
One limitation of the analysis here is that it considers only employment and not spending on salaries, amenities, or anything else. However, I plan to address spending by colleges and universities in a future Economic Commentary.
Footnotes
- See http://college.usatoday.com/2014/05/19/colleges-or-country-clubs-students-discuss/ on the growth of amenities and Jacob, McCall, and Stange (2013) for an academic study on the issue. Return to 1
- As one example, see http://www.nytimes.com/2015/04/05/opinion/sunday/the-real-reason-college-tuition-costs-so-much.html?_r=1. Return to 2
- See, for example, http://www.theatlantic.com/education/archive/2015/05/the-cost-of-an-adjunct/394091/. Return to 3
- Data on fall employment in even-numbered years are available beginning in 2002, although completion of the Fall Staff survey is optional in these years. Return to 4
- More information on the data irregularities in 1991 is provided in the data appendix. Return to 5
- The faculty category changes over time to “instruction/research/public service.” Moreover, in 2001 only, an eighth category, other administrative, is also included in the data. This category, which represents 2 percent of employment in the sample in 2001, is excluded from the figures shown here. Thus, employment shares in 2001 do not add up to 100 percent. Return to 6
- For larger institutions, the data are reported in three categories: archivists, curators, and museum technicians; librarians; and library technicians. I combine these three categories in order to report the results consistently between larger and smaller institutions. However, amongst larger institutions, the majority of employees in the three categories are in the librarians category, although the library technicians category is also well represented. The archivists, curators, and museum technicians category is very small. Return to 7
- The crosswalk between the earlier and later IPEDS employment classification is available at https://nces.ed.gov/ipeds/resource/download/IPEDS_HR_2012-13_compared_to_IPEDS_HR_2011-12.pdf. Return to 8
- Most faculty are included in the instructional staff category, but they may also be included in the research staff and public service staff categories. However, the IPEDS instructions say that employees whose job is a mix of teaching, research, and service that cannot be disentangled are supposed to be included in the instructional staff category. Return to 9
References
- Deming, David J., Claudia Goldin, and Lawrence Katz (2012), “The For-Profit Postsecondary School Sector: Nimble Critters or Agile Predators?” Journal of Economic Perspectives, 26:1, 139–164.
- Goldschmidt, Deborah and Johannes F. Schmieder (2015), “The Rise of Domestic Outsourcing and the Evolution of the German Wage Structure,” National Bureau of Economic Research, Working Paper no. 21366.
- Jacob, Brian, Brian McCall, and Kevin M. Stange (2013), “College as Country Club: Do Colleges Cater to Students’ Preferences for Consumption?” National Bureau of Economic Research, Working Paper no. 18745.
Data Appendix
I use data from the Integrated Postsecondary Education Data System for the odd-numbered years between 1987 and 2013, with the exception of 1991. As noted in footnote 4, data for fall employment in even-numbered years are available beginning in 2002, but completion of the Fall Staff survey is optional in those years. For most even-numbered years, the number of four-year institutions that completed the survey is over half the number from the adjacent odd years. The exceptions are 2002 and 2004, years for which the sample size is less than half the size in the adjacent odd years. My results do not change appreciably when data for even years are included in the analysis, suggesting that the institutions that complete the Fall Staff survey when not required may be representative of institutions overall.
I do not use data from 1991 because the data on part-time employees in the technical and paraprofessionals category in this year are potentially reversed with the data on part-time employees in the clerical and secretarial category. The results for these two categories in 1991 do not fit the trend from other years but do actually fit the trend of the other category. The reversal of data can be easily verified in at least one case by comparing the completed survey form for the University of Kentucky available at https://www.uky.edu/IRPE/staff/eeo/eeo1991-1992.pdf to the data reported by the National Center for Education Statistics at https://nces.ed.gov/ipeds/datacenter/.
More information on the various categories in the two IPEDS employment classifications can be found by looking at the archived survey forms at http://nces.ed.gov/ipeds/InsidePages/ArchivedSurveyMaterials.
Three points of clarification about the 1987–2011 employment classification are in order here. First, the other professionals category includes a variety of occupations that require at least a bachelor’s degree or its equivalent, while the technical and paraprofessionals category includes a variety of occupations that would require the equivalent of a degree or certificate lower than a bachelor’s degree.
Second, the skilled crafts category includes employees whose jobs “require special manual skills and a thorough and comprehensive knowledge of the processes involved in the work,” whereas the service/maintenance category includes employees whose jobs require “limited degrees of previously acquired skills and knowledge.”
Third, according to the notes on the 2001 survey form, the other administrative category includes “all persons whose assignments require management of the institution, or a customarily recognized department or subdivision thereof, but who are subordinate to employees classified as executive and managerial.” I drop the other administrative category from the analysis.
The categories in the 2013 IPEDS classification are arguably more specific than the categories in the 1987–2011 classification, but a couple points of clarification are in order. First, the service occupations category includes a variety of service workers, including cafeteria workers as well as building and grounds cleaning staff.
Second, faculty members can be included in the instructional staff, research staff, and public service staff categories. These categories may also include nonfaculty. The instructional staff category includes employees whose jobs involve a combination of instruction, research, and public service. The research category includes employees who are primarily involved in research. The public service category includes employees who are primarily involved in public service, including extension faculty and continuing education faculty.
Suggested Citation
Hinrichs, Peter L. 2016. “Trends in Employment at US Colleges and Universities, 1987–2013.” Federal Reserve Bank of Cleveland, Economic Commentary 2016-05. https://doi.org/10.26509/frbc-ec-201605
This work by Federal Reserve Bank of Cleveland is licensed under Creative Commons Attribution-NonCommercial 4.0 International

