

- Share
Forecasting Unemployment in Real Time during the Great Recession: An Elusive Task
With the unemployment rate becoming a prominent factor in monetary policy decisions in recent years, forecasting the path of the rate in the near term has taken on a new urgency. How well do our current methods do in this task? We look at the performance of various publicly available forecasts, along with some econometric models, and evaluate their success at forecasting the unemployment rate in real time around the Great Recession. Unfortunately, the forecasting approaches we analyze performed very poorly until the beginning of the recovery. We discuss some possible reasons for this poor forecast performance.
The views authors express in Economic Commentary are theirs and not necessarily those of the Federal Reserve Bank of Cleveland or the Board of Governors of the Federal Reserve System. The series editor is Tasia Hane. This paper and its data are subject to revision; please visit clevelandfed.org for updates.
The unemployment rate has always been a focal point of discussions about the state of the economy because it provides a timely measure of the overall health of the labor market, and hence aggregate economic activity. In the aftermath of the Great Recession, many researchers, analysts, and policymakers have taken a keener interest in the unemployment rate not only as a gauge of current economic conditions, but also as a variable of interest for forecasting.
Forecasting the unemployment rate in the near future gained further urgency as the Federal Open Market Committee (FOMC) decided to tie its asset purchases to a “substantial improvement” in labor market conditions in September 2012.1 Furthermore, in December 2012, it made tightening of the Fed’s policy rate conditional on the level of the unemployment rate.2
In thisEconomic Commentary, we evaluate our ability to forecast the unemployment rate in real time. We look at the performance of various publicly available forecasts around the Great Recession, along with econometric models that have shown some promise in improving forecast accuracy in the literature. Unfortunately, the forecasting approaches we analyze performed very poorly, in real time, until the beginning of the recovery. We show that the Great Recession led to a larger-than-normal increase in the unemployment rate, which was partly behind this poor forecast performance. We also examine the role that data revisions may play in the forecasting process and argue that this might have contributed to the poor forecasting performance early in the recession.
Four Unemployment Forecasts
The public sources we look at are the Federal Reserve Bank of Philadelphia’s Survey of Professional Forecasters (SPF) and the Federal Reserve Board’sGreenbook. The SPF gathers forecasts from its participants on a quarterly basis, usually at the end of the first month of each quarter, and releases the information to the public by the middle of the following month. TheGreenbook contains the Federal Reserve Board staff’s summary of economic conditions and forecasts and is distributed to FOMC participants, roughly a week prior to the meetings. These forecasts are released to the public with a five-year lag, making 2009 the last forecast year we have available.
We also look at two forecasting models that rely on the use of unemployment flows data. One is based on Barncihon and Nekarda (2012), who use job finding and separation rates, in addition to the unemployment rate, initial unemployment insurance claims, and job vacancy rates, to forecast the unemployment rate. The model has been proven to improve the accuracy of forecasts for the current quarter and one quarter ahead. We refer to this approach as the VAR model hereafter, as it relies on a vector autoregression. The other is Tasci (2012), which is a more structural approach. Meyer and Tasci (2015) show that this model might further improve forecast accuracy beyond the very near term and around business cycle turning points (especially after recession troughs). We call this model the FLOW-UC model, as it formulates an unobserved components approach for job finding and separation rates in predicting the unemployment rate.
Real-Time Forecast Performance
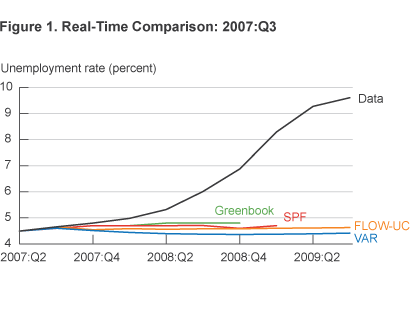
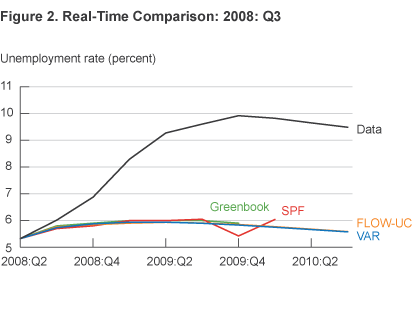
The Great Recession poses a particular challenge to any forecasting approach that relies on historical patterns to predict the unemployment rate in the future—as all of our approaches do. During the recession, the unemployment rate rose more than the decline in GDP would have predicted based on the historical trend. The difficulty this poses for forecasting can be seen in figures 1 and 2, which compare predictions for the unemployment rate from the SPF, the Greenbook, the VAR model, and the FLOW-UC model to the actual data. In general, the predictions undershot the realized unemployment rate throughout the recession. This could be due in part to the disproportionate rise in the unemployment rate relative to the drop in GDP, as well as a consistent overestimation of current GDP growth.
Just before and during the Recession
Figure 1 shows forecasts made with real-time data in the third quarter of 2007.3 This is just before the recession hit, and unsurprisingly none of the forecasts accurately predicted the sudden rise in the unemployment rate. At that point in the cycle, there was no clear indication that we would enter a recession, and the unemployment rate was close to its historic lows, around 4.7 percent (average in 2007:Q3). This is to be expected because forecasts tend to extrapolate future trends from past ones, and a recession is, in some sense, a sudden change in the recent trend. In fact, figure 1 can be viewed as a simple manifestation of this problem with forecasting a recession.
By the third quarter of 2008, during the midst of the recession (figure 2), the forecasts were not faring much better. The unemployment rate had gone from 4.8 percent in 2007:Q4 to 5.3 percent in 2008:Q2, with some softening in the growth rate of real output. However, as of 2008:Q3, estimates of real output for the previous two quarters suggested 0.9 percent and 1.9 percent growth, respectively, far from indicating a severe recession. Consequently, none of the forecasts predicted unemployment going above 6 percent at any time in the foreseeable future, while in reality it neared 10 percent at the end of 2009. Once again, none of the forecasts stands out in terms of predictive power.
At the End of the Recession
The recession ended in 2009:Q2, but the unemployment rate kept increasing for two quarters thereafter. 4 This is not uncommon, as the unemployment rate lags the cycle in general. Once the recession ended, most forecasts fared much better (figure 3), with the SPF performing the best and generally falling in line with the data. TheGreenbook and the FLOW-UC model continued to under-predict future unemployment rates, although not as drastically as during the recession. The VAR model ended up overshooting actual unemployment data quite a bit, ending up past 13 percent by mid-2011.
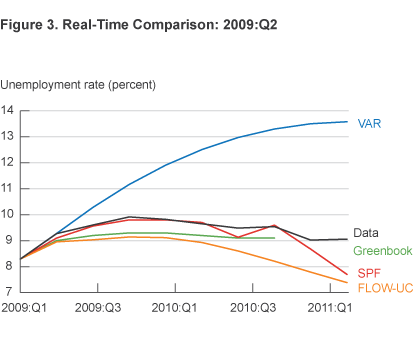
Here we would have expected the FLOW-UC model to improve forecast accuracy relative to the VAR model, especially beyond the immediate future. This is because we are further away from the long-run trend for the unemployment rate (i.e. the “natural” rate), which the VAR is somewhat agnostic about. The FLOW-UC model has a built-intendency to converge to the trend, and this feature seems to help distinguish it from the VAR at the onset of the recovery. Nevertheless, theGreenbook and SPF forecasts seem to fare better than the model-generated forecasts in terms of accuracy in this particular episode.
After the Recession
Over the course of 2009, the unemployment rate rose from 7.3 percent to 9.9 percent (hitting 10 percent in October). Such levels had not been reached since the late 1980s. Forecasters gradually adapted to this new reality by revising their forecasts with the recent behavior of the unemployment rate.
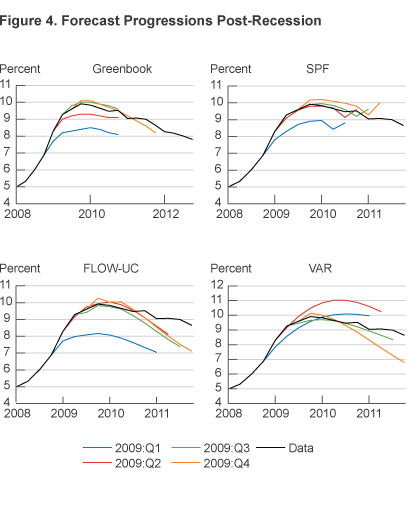
Figure 4 displays the improved accuracy of each forecast from quarter to quarter, starting in 2009:Q1. All forecasts undershot the unemployment rate for the near future as of 2009:Q1. For the VAR, the undershooting stops with the longer-forecast horizons. Additional information seems to improve the forecast performance for theGreenbook and the SPF, as well as the FLOW-UC model, as we come to 2009:Q2. For the VAR model, the initial undershooting briefly turns into overshooting. In fact, the VAR’s performance for longer horizons (6-to-8 quarters ahead) varies quite a bit from one quarter to the next in real time.
Summary of Forecasting Performance
The results presented in figures 1-3 suggest that before the crisis, all of the forecasting approaches failed to detect the severity of the recession ahead of time and produced overly optimistic estimates of the unemployment rate. As the crisis came to a close, forecast accuracy improved substantially, although no one forecast source stands out as uniformly superior. These figures as a whole show how hard it is to gauge the improvement in the labor market in real time, especially when the economy is going through a major recession. As they grappled with the full picture, both professional forecasts and model-based ones adapted, gradually improving their accuracy.
Real-Time Data Releases
Some of the forecast errors in the approaches we have discussed might be due to the information content of the initial data release. Most macroeconomic variables are substantially revised in the months following their initial release. Figure 5 shows this fact graphically with a comparison of real GDP estimates. The real-time data has consistently overestimated real GDP growth (year-over-year), relative to what we know now.
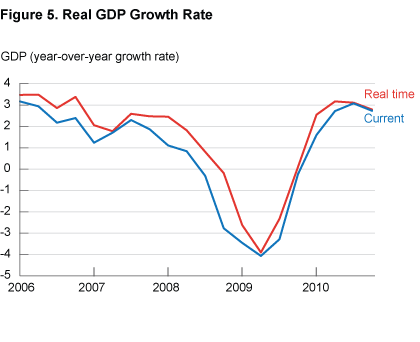
For instance, for most of 2008, the Bureau of Economic Analysis (BEA) reported that GDP growth year-over-year slowed, but real-time data releases did not register a negative number until 2008:Q4. Even then, it was only a 0.2 percent decline. However, with the current vintage of the data, we now know that by that point, year-over-year growth was a dismal -2.7 percent. This discrepancy surely contributed to the overly optimistic forecasts in figures 1 and 2. On the other hand, it is hard to argue that inaccurate real-time data was the main driver of the poor forecast performance by late 2009, when the revised data differed little from the real-time data.
This divergence between the real-time and revised data around recessions has been somewhat of a pattern in previous business cycle episodes as well. Figure 6 shows how the GDP decline from peak to trough has changed from the initial release to the current vintage, for both GDP and unemployment. Unemployment data comes from the household survey, which is not subject to many revisions, except the occasional correction for population controls. Some of the revisions to the GDP estimates, on the other hand, have been substantial. For instance, the 1973-75 recession initially was reported to be very deep, registering a 7.5 percent decline in real GDP from the prior peak to the trough. According to the current vintage of the data, the recession was much less severe, with real GDP declining 3.1 percent. Revisions can also go the other direction, as was the case with the Great Recession. Real-time data indicated a 3.7 percent decline, but the current vintage reveals a more severe downturn, with a 4.2 percent decline.
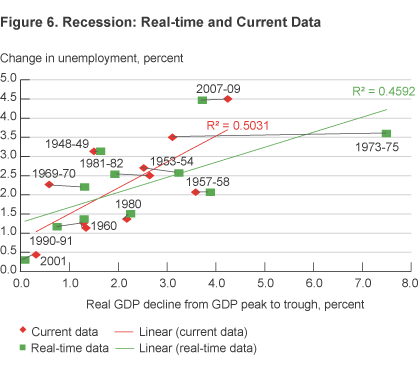
We expect a positive relationship between the magnitude of the GDP contraction and the unemployment change during a recession. This is in fact the case in the previous 11 recessionary episodes of the post-WWII period. Figure 6 shows that the relationship was somewhat stronger with the revised data, even though not significantly different. Since forecasters rely on past trends to predict the future, if the recent data about the economy miss the “real” picture with the initial release, forecasters will have an additional challenge predicting the evolution of the unemployment rate throughout a recession. Hence, part of the poor performance of the four forecasts we have looked at, to some extent, might be attributed to the inaccurate measurement of the true growth in the economy in real-time.
There is potentially another reason behind the dismal performance of the four forecasts (especially for figures 1 and 2)—the unusual severity of the Great Recession. Figure 6 shows that this recession was an outlier. Based on the initial data release for GDP, the historical relationship between GDP and the unemployment rate (roughly given by the trend line) would have predicted a significantly smaller increase in the unemployment rate. Therefore, part of the weakness in forecast accuracy was due to the disproportionately larger deterioration in the labor market during the last recession relative to previous experience.5
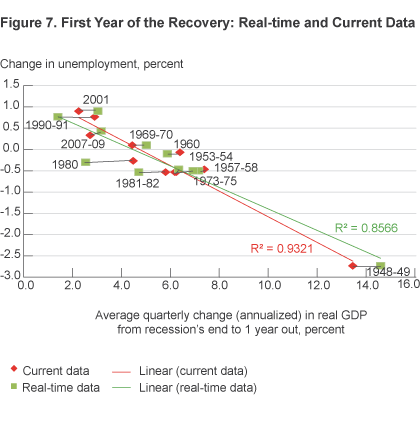
One can look at the same relationship over the ensuing recovery period. Figure 7 recreates the same graph, this time looking from the end of the recession to 1 year into the recovery. Once again, estimates of GDP and the unemployment rate change from the first release to the most recent revision, although not as dramatically as during the recession. The trend line once again shifts, again yielding a stronger relationship with the current data. More importantly, we see a much tighter relationship between unemployment and GDP during the recovery episodes. The stronger predictive power of the historical trends, combined with relatively muted revisions in the real-time data, provides us with relatively better performances for all four forecasting approaches by the end of the recession (figures 3 and 4).
Conclusion
Forecasts of labor market conditions, the unemployment rate in particular, have been at the center of many recent policy discussions. Unfortunately, even though we have some useful approaches to forecasting the unemployment rate, none of them performed very well during the Great Recession and the following recovery. The exceptionally adverse effects of the recession, in conjunction with relatively sizable revisions to the real-time data, presented several challenges for forecasters. It would be naïve to expect these challenges to disappear the next time around.
Footnotes
- See the FOMC statement dated September 13, 2012, at http://www.federalreserve.gov/newsevents/press/monetary/20120913a.htm. Return to 1
- See the FOMC statement dated December 12, 2012, at http://www.federalreserve.gov/newsevents/press/monetary/20121212a.htm. Return to 2
- Note that, because of the timing of the SPF and the Greenbook forecasts, there will be minor differences in the actual information set when the forecast is made. We tried to time every other forecast around the date of the SPF, as much as possible for each quarter. Return to 3
- The NBER Committee declared the announcement for the end of the recession in September 2010. Return to 4
- In a formal evaluation of the class of models that are frequently used in the literature, Aastevit et.al. (2015) show that the historical relationships between several macroeconomic variables did not stay stable during the crisis period. This turns out to be more pronounced for the forecast of the unemployment rate, as we find in this Commentary. Return to 5
References
- Tasci, Murat, 2012. “The Ins and Outs of Unemployment in the Long Run: Unemployment Flows and the Natural Rate,” Federal Reserve Bank of Cleveland, Working Paper. No. 12-24R.
- Meyer, Brent, and Murat Tasci, 2015. “Lessons for Forecasting Unemployment in the U.S.: Use Flow Rates, Mind the Trend,” Federal Reserve Bank of Cleveland, Working Paper. No. 15-02.
- Barnichon, Regis, and Christopher J. Nekarda, 2012. “The Ins and Outs of Forecasting Unemployment,” Brookings Papers on Economic Activity, Fall, 83-131.
- Aastevit, Knut Ave, Andrea Carriero, Todd E. Clark, and Massimiliano Marcellino, 2015. “Have Standard VARs Remained Stable since the Crisis?” Federal Reserve Bank of Cleveland, Working Paper. No. 14-11R.
Suggested Citation
Tasci, Murat, and Caitlin Treanor. 2015. “Forecasting Unemployment in Real Time during the Great Recession: An Elusive Task.” Federal Reserve Bank of Cleveland, Economic Commentary 2015-15. https://doi.org/10.26509/frbc-ec-201515
This work by Federal Reserve Bank of Cleveland is licensed under Creative Commons Attribution-NonCommercial 4.0 International

