

Has Bank Consolidation Changed People’s Access to a Full-Service Bank Branch?
Consolidation—the combining of banking institutions via mergers and acquisitions—became widespread in the 1980s and continued into the 1990s and 2000s as regulatory changes permitted banks to operate in multiple states and technology enabled banking institutions to provide services at lower costs (Rhoades, 1996; Adams, 2012; Wheelock, 2011). While the benefits of consolidating are clear for an institution, the benefits (and costs) for the consumer are less clear, especially as media headlines often associate consolidation with the closing of bank branches.
Consolidation—the combining of banking institutions via mergers and acquisitions—became widespread in the 1980s and continued into the 1990s and 2000s as regulatory changes permitted banks to operate in multiple states and technology enabled banking institutions to provide services at lower costs (Rhoades, 1996; Adams, 2012; Wheelock, 2011). While the benefits of consolidating are clear for an institution, the benefits (and costs) for the consumer are less clear, especially as media headlines often associate consolidation with the closing of bank branches.
Despite the increased use of online or digital banking services, research shows that customers continue to value in-person interaction for many of their banking needs. Most consumers prefer to perform certain types of transactions such as opening accounts, resolving account problems, and transferring large sums in person rather than online (Kirk et al., 2018). Consumers also visit bank branches for financial advice because such services are often less comprehensive, less user-friendly, or even nonexistent in an online environment (Srinivas and Wadhwani, 2019). Bank branches are likewise extremely important to small businesses, which rely on their local banks for essential transactions such as regular deposits, payroll services, and loans and lines of credit (Mitchell et al., 2021).
In this analysis, we use data on full-service bank branches to gain insights into how bank consolidations affect customers.1 First, we show that as consolidation within the banking industry has continued, the total number of branches an institution has to meet its customers’ banking needs has increased. We also examine a recent history of bank branch openings and closings to further understand the increase in the total number of branches. And, lastly, we look to see if access to banking services has changed for consumers in urban and rural areas. Data used in this analysis are from the FDIC’s Summary of Deposits and Reports of Structure Changes, the US Census Bureau, and the US Department of Agriculture.
Findings
- As consolidation has continued, the number of banking institutions has declined since 2000, and this decline seems to have accelerated during the 2010s. The number of institutions has declined by more than 2,300 during the past 20 years, with most of this decline happening in the past 10 years.
- The total number of full-service bank branches increased from roughly 67,000 to 84,000 during the 2000s but declined to 77,000 branches in 2020.
- Consolidation has resulted in banking institutions’ increasing their number of branches—from 11 to 19 full-service branches on average.
- Bank branching behavior (openings and closings) changed during the study period. Annual net increases in branches experienced during the 2000s turned into net losses as branch openings declined significantly and closings picked up modestly during the 2010s.
- Over the past 20 years, the nearest full-service branch for urban consumers has been stable at 1.5 miles, while it has improved (4.6 to 4.3 miles) for rural consumers.
Continued Consolidation Increased Number of Branches per Institution
Consolidation trends within the banking industry has continued. Table 1 shows that the number of banking institutions has continued to decline since 2000, and that decline seems to have accelerated during the 2010s. During the 2000s, the number of institutions declined by 725, or 11.5 percent; however, during the 2010s, the number of institutions dropped sharply by 1,616, or 28.9 percent. Overall, the number of institutions declined by more than 2,300 institutions during the past 20 years, with most of the decline happening in the past 10 years.
| Year | Institutions | Number of Full-Service Bank Branches |
Average Number of Branches per Institution |
|---|---|---|---|
| 2000 | 6,326 | 66,845 | 11 |
| 2010 | 5,601 | 83,552 | 15 |
| 2020 | 3,985 | 76,757 | 19 |
Source: Quarterly Census of Employment and Wages (Bureau of Labor Statistics)
Though the number of institutions declined, the number of full-service branches increased over the last 20 years, though not in a linear fashion. The total number of branches increased 25.0 percent from 66,845 to 83,552 branches during the 2000s. Conversely, the following 10-year period saw the total number of branches fall 8.1 percent to 76,757 branches. This pattern suggests that as consolidations have taken off in the 2010s, institutions may be more diligently assessing their footprints and closing overlapping or redundant branches.
As consolidation continued, the number of branches per institution has increased, resulting in larger networks of branches for customers to meet their banking needs. Table 1 shows that the average number of branches an institution possesses has grown significantly since 2000. On average, an institution went from having 11 branches in 2000 to 19 branches in 2020, an increase of more than 70 percent in 20 years.
Changes in Bank Branch Openings versus Closings
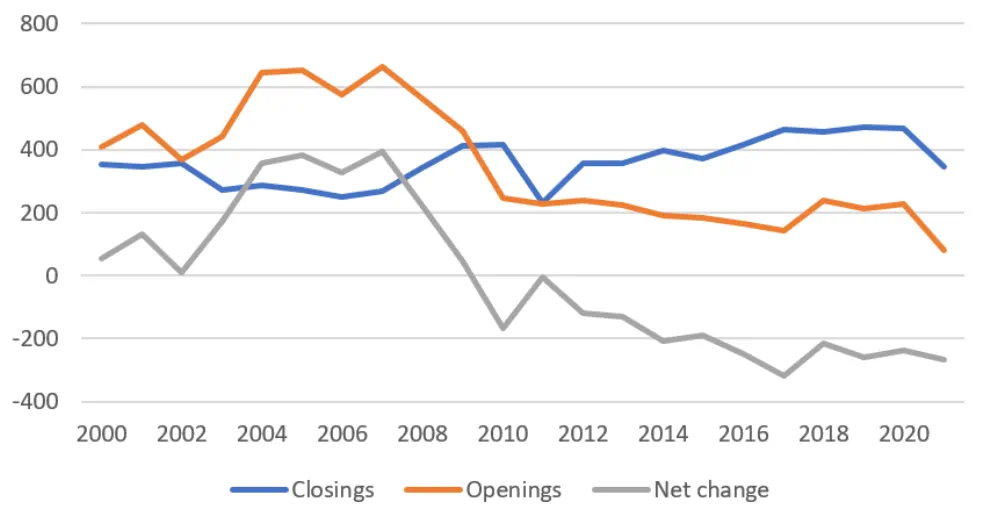
To better understand the nonlinear increase in total number of bank branches, we examined bank branch openings and closings trends for the same 20 years (2000–2020). [FIGURE 1] shows that during the 2000s, 525 branches opened and 315 branches closed, resulting in a net positive of 210 branches on average. Then in the 2010s, annual branch closings (393) overtook annual branch openings (207) and resulted in a net loss (185) of bank branches.2 Importantly, this net loss of bank branches appears to be more attributable to a decline in openings than an increase in closings: the 2010s annual averages for branch openings decreased 60 percent from the 2000s annual average, while closings increased 24 percent. This change provides some additional evidence that institutions are adding branches through acquisition rather than new openings and that some institutions have been diligently assessing their footprint and adjusting the number of their branch locations to remain accessible to their customers.
Consumer Access to Full-Service Branches in Rural and Urban Areas
Given the trends described in the data above, we were interested in determining if the change in number of bank branches has affected consumer access. We can create two metrics to analyze changes in consumer access. The first is the number of bank branches per 10,000 people; because population is not uniformly distributed across the country (or within states or counties), raw numbers of bank branches do not tell the whole story. Second, we compute the average distance to the nearest branch to give a sense of how readily consumers can physically access a branch location.3 This measure does not distinguish between branches of different institutions, but, rather, reflects the overall branch network in a location. We also look at branch accessibility in both urban and rural areas because the concept of accessibility varies between locations. For example, Table 2 shows that while rural areas have more branches per capita than urban areas, rural consumers must travel roughly three miles farther than urban consumers to get to the nearest branch.
| # of Branches Per 10,000 | Average Distance to Nearest Branch | |||
|---|---|---|---|---|
| Year | Urban | Rural | Urban | Rural |
| 2000 | 2.1 | 3.7 | 1.5 | 4.6 |
| 2010 | 2.6 | 3.8 | 1.5 | 4.5 |
| 2020 | 2.2 | 3.5 | 1.5 | 4.3 |
Sources: Federal Deposit Insurance Corporation: Summary of Deposits, US Census Bureau, US Department of Agriculture
During the past 20 years, we find relatively little change in consumer access in urban areas. Consistent with the number of closings and openings shown above, urban consumers saw the number of branches per capita increase during the 2000s and decrease during the 2010s. However, despite those changes, the number of branches an urban consumer has access to has increased only slightly (from 2.1 to 2.2 branches per 10,000 people), and the average distance to the nearest branch has been stable at 1.5 miles. Within urban areas, we found that the average distance to a branch remained at 1.0 mile for low- and moderate-income communities, while middle-income communities saw the distance fall from 1.8 to 1.5 miles, and upper-income neighborhoods saw this distance increase from 1.6 to 1.7 miles during the past 20 years.
In the same period, rural areas saw the same fluctuations in the number of branches per capita: increases during the 2000s followed by decreases during the 2010s. However, though rural customers saw the branches per capita decline (from 3.7 to 3.5 branches per capita), they also saw their access increase: the distance to the nearest branch decreased by 0.3 miles to 4.3 miles during the same period.
Conclusion
As the consolidation within the banking industry during the 2000s accelerated in the 2010s, the total number of bank branches per institution increased, resulting in a larger number of branches to meet their customers’ banking needs. We also provide evidence that institutions have been increasing their number of branches via consolidation, rather than via opening new branches. Annual net increases in branches experienced during the 2000s turned into net losses as branch openings decreased significantly and closings picked up modestly during the 2010s. Despite these developments, this analysis indicates that, on average, urban consumers have not experienced a significant change in their ability to access a full-service bank branch, and rural consumers saw full-service branches become more accessible. Overall, this analysis suggests that even though consolidation may create fewer choices of banking institutions, it provides consumers access to larger networks of branches and has caused no significant change in a customer’s physical proximity to branches on average.
The views expressed in this report are those of the author(s) and are not necessarily those of the Federal Reserve Bank of Cleveland or the Board of Governors of the Federal Reserve System.
Footnotes
- The Federal Deposit Insurance Corporation (FDIC) defines a full-service branch as a bank location that accepts deposits, offers loan services, allows users to open and close accounts, and has standard hours and full-time staff. Return to 1
- These annual averages do not align with decadal change total number of bank branches in Table 1 because they are different sources of FDIC data; however, the patterns are consistent. Data featured in Table 1 are from the Summary of Deposits, which one can think of as a snapshot in time, while data in Figure 1 are from the Reports on Structure Changes, which is a running record of branch openings and closings. Return to 2
- The average distance to the nearest branch metric is computed by first finding the distance to the nearest branch from the centroid of each census tract and then taking the population weighted average. Return to 3
References
- Adams, Robert M. 2012. “Consolidation and Merger Activity in the United States Banking Industry from 2000 through 2010.” Finance and Economics Discussion Series 2012–051. Board of Governors of the Federal Reserve System. https://doi.org/10.17016/FEDS.2012.51.
- Kirk, Peter, Martin Folino, Can Kekavi, Fergus Gordon, Adrien Kirschfink, Nic Preece, Alex Trott, Richard Benson, and Robin Bevan. 2018.“From Branches to Experience Centres: Leading the Way in the Transformation of the Branch Network into Experience Stores.” Accenture Research. https://www.accenture.com/_acnmedia/PDF-135/Accenture-Bank-Branch-Digital-Disruption-from-Transactions-to-Conversations.pdf.
- Mitchell, Bruce C. 2021. “Relationships Matter: Small Business and Bank Branch Locations.” Washington, DC: National Community Reinvestment Coalition. https://ncrc.org/relationships-matter-small-business-and-bank-branch-locations/.
- Rhoades, Stephen A. 1996. “Bank Mergers and Industrywide Structure, 1980-94.” Staff Studies 169. Board of Governors of the Federal Reserve System. https://ideas.repec.org/p/fip/fedgss/169.html.
- Srinivas, Val, and Richa Wadhwani. 2019. “Recognizing the Value of Bank Branches in a Digital World.” Deloitte Insights. Deloitte Center for Financial Services. https://www2.deloitte.com/us/en/insights/industry/financial-services/bank-branch-transformation-digital-banking.html.
- Wheelock, David C. 2011. “Banking Industry Consolidation and Market Structure: Impact of the Financial Crisis and Recession.” Review 93 (6): 419–38. https://doi.org/10.20955/r.93.419-438.
Suggested Citation
Fee, Kyle D., and Erik Tiersten-Nyman. 2021. “Has Bank Consolidation Changed People’s Access to a Full-Service Bank Branch?” Federal Reserve Bank of Cleveland, Community Development Reports. https://doi.org/10.26509/frbc-cd-20211006
- Share