

- Share
Education and Employment Opportunities for Younger Workers in Kentucky Metro Areas
In this data brief, we describe changes in the labor market of Kentucky’s metros during the recession and recovery period of 2006-2011. Educational levels of young workers remained virtually unchanged during this period, yet compared to all U.S. metros, the Kentucky metro labor market has a lower high school drop-out share and a higher share of post-graduate degree workers. Occupations available to non-college bound youth, such as Transportation, Healthcare Support, Personal Care, and Food Preparation & Services, grew in employment but experienced decreases in real wages.

The views expressed in this report are those of the author(s) and are not necessarily those of the Federal Reserve Bank of Cleveland or the Board of Governors of the Federal Reserve System.
In this data brief, we describe changes in the labor market of Kentucky's metros during the recession and recovery period of 2006-2011. Educational levels of young workers remained virtually unchanged during this period, yet compared to all U.S. metros, the Kentucky metro labor market has a lower high school drop-out share and a higher share of post-graduate degree workers. Occupations available to non-college bound youth, such as Transportation, Healthcare Support, Personal Care, and Food Preparation & Services, grew in employment but experienced decreases in real wages.
In this data brief, we examine the educational attainment levels, employment status, and occupations of workers in Kentucky's metropolitan areas. Our analysis focuses primarily on the job prospects for those aged 18 to 35 - referred to herein as "young workers" or "young" - with no post-secondary degree. We describe changes in education, employment, and wages between 2006 and 2011 and provide projected job growth in the region by skill-level requirements.
The educational attainment of those aged 18-35 remained virtually unchanged between 2006 and 2011 in Kentucky's metro areas. Chart 1 shows the distribution of young labor market participants (employed and unemployed) in Kentucky's metros and in the nation's metros. As depicted in Chart 1, Kentucky's metro areas have slightly higher shares of young workers with graduate degrees and slightly lower shares with a high school degree or less compared to the nation's metros. In Kentucky metros, 39 percent of the young workers have at most a high school degree compared to 42 percent in the nation's metros and 44 percent nationally.
Chart 1: Educational attainment of individuals 18-35 years of age, 2011
Source: Public Use Micro Data Sample (PUMS), 1-year estimates, 2011
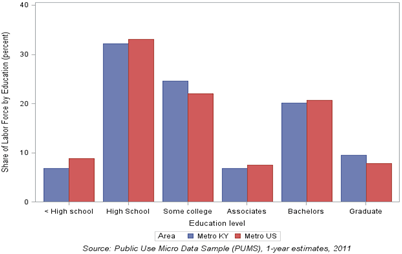
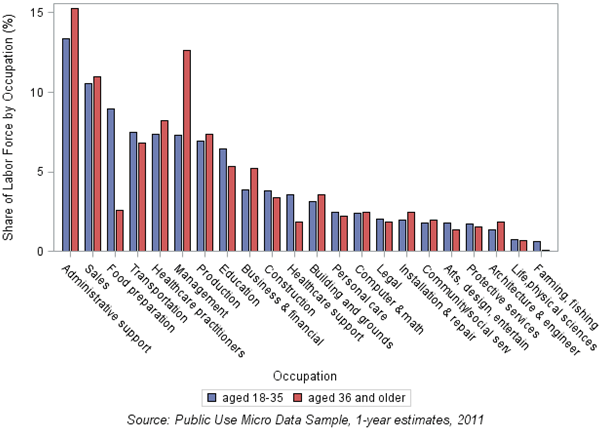
Chart 2 shows the distribution of younger and older (36+) workers across occupations in Kentucky's metro areas who worked at least 40 weeks in the previous year. Compared to older workers, young workers are more likely to be employed in Food Preparation and Services and Healthcare Support. As illustrated, about nine percent of the young workers are employed in food preparation-related occupations compared to only three percent of the workers aged 36 and older. Conversely, the younger group has a smaller share of workers in Management, Administrative Support and Business and Financial occupations than older workers.
Chart 2: Distribution of full-year workers in occupations by age group in Kentucky metros, 2011
Source: Public Use Micro Data Sample (PUMS), 1-year estimates, 2011
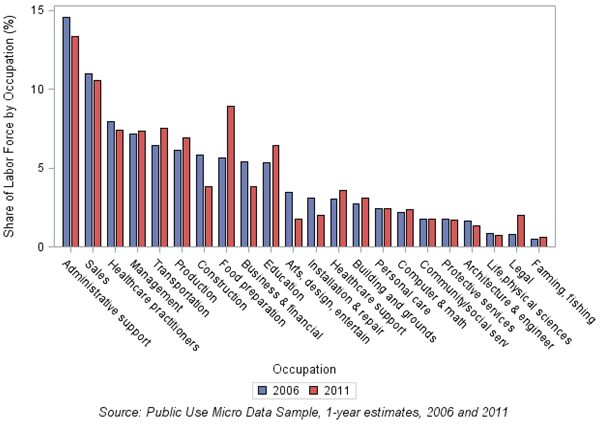
Over 2006-2011, a period of recession and slow recovery, we see distinct changes in employment of young workers in blue-collar occupations. By 2011, young workers were less likely to be employed in Construction and Installation & Repair occupations and somewhat more likely to be employed in Transportation and Production jobs. However, the largest increase in the share of young workers occurred in the lower-wage Food Preparation & Services occupations. Changes in employment of young workers also took place during this period in occupations that require post-secondary degrees. The Kentucky metros saw a decline in the share of Business & Financial jobs and an increase in the share of Education and Legal jobs among young workers.
Chart 3: Distribution of full-year workers, aged 18-35, in occupations by year in Kentucky metros
Source: Public Use Micro Data Sample (PUMS), 1-year estimates, 2011
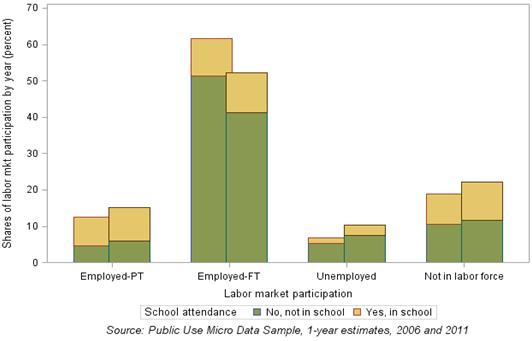
Next, we look at changes in the share of young adults in the labor market and changes in the share of young workers employed full-time from 2006 to 2011. Individuals reporting to work 30 or more hours a week are considered to hold a full time job. Among all individuals aged 18 to 35, full-time employment dropped sharply: 62 percent reported working full time in 2006 but only 52 percent reported doing so in 2011. The increase in part-time positions among young workers occurred in a number of occupations, including Sales, Food Preparation & Services, and Administrative Support occupations. Conversely, there was a decrease in the share of part-time young workers employed in Education jobs from 2006 to 2011. About 21 percent of full-time and 61 percent of part-time young workers reported attending school in 2011.
Chart 4: Labor market participation and school attendance of population aged 18-35 in the Kentucky metros
Note: 2006 left bars and 2011 bars right
Source: Public Use Micro Data Sample (PUMS), 1-year estimates, 2006 and 2011
From this point on, we focus our analysis on characterizing recent changes in occupations by changes in the educational attainment of their workers, their wages, and employment. In Chart 5, we look at workers aged 18 or older who reported working at least 40 weeks in the previous 12 months regardless of the number of hours worked per week. These full-year workers make up about 89 percent of workers 18 aged and older in Kentucky metros in 2011. In Chart 6 we further restrict this sample to individuals reporting at least 30 hours of work in a usual week, which allows us to consider their reported wages as full-time wages. The share of full-time, full-year workers is 78 percent in 2011.
In chart 5, each occupation is plotted by the share of workers aged 18 and older with a post-secondary degree in 2006 and 2011. In this scatter plot, occupations above the line indicate an increase in the share of workers with a post-secondary degree from 2006 to 2011. Those below the line indicate a decrease in the share of workers with a post-secondary degree from 2006 to 2011. For example, the educational attainment of workers employed in Business & Financial jobs increased from 2006 to 2011.
A shift toward higher shares of post-secondary workers within specific occupations could be the result of a number of distinct factors: changes in young workers' perceived value of a college degree, higher job losses among non-college workers, an increase in the demand for jobs requiring higher skills, or on-the job-opportunities for workers to improve their skills. They could also result from higher-skilled workers moving to lower-skilled jobs as the economy contracted. With this analysis, we are unable to identify the reasons for the shifts in the educational attainment of these workers. However, we do see increases in the educational attainment of workers from 2006 to 2011 in Business & Financial occupations and to a lesser extent in Education and Legal occupations. Among low- to mid-skill occupations, there does not seem to be a noticeable increase in education during this period.
Chart 5: Shifts in share of those with post-secondary degree by occupation, full-year workers aged 18 and older, 2006 and 2011
Source: Public Use Micro Data Sample (PUMS), 1-year estimates
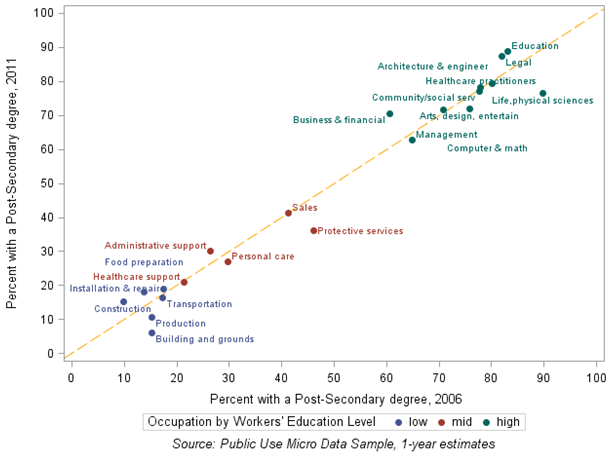
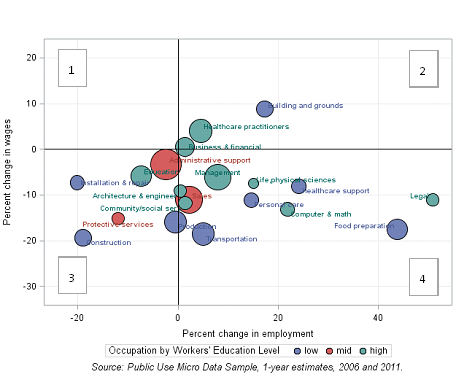
Chart 6 shows the change in employment and real average wages from 2006 to 2011 for full-time, full-year workers by occupations. Here, occupations are color coded by the educational level of their full-time, full-year workers. The size of each bubble is proportional to employment shares across occupations in 2011. Administrative support occupations, for example, have the largest share of employees in 2011. Most occupations have experienced a decline in real wages, employment, or both during these slow recovery years, as seen by the concentration of occupations in quadrants 3 and 4.
Building and Maintenance are low-skill occupations that experienced an increase in both employment and real wages between 2006 and 2011 in Kentucky's metro areas (see Chart 6). Other jobs accessible to lower-skilled workers, including Food Preparation & Services, Personal Care and Healthcare support occupations, have also experienced increased employment but decreases in wages from 2006 to 2011. Administrative Support occupations, which comprise the largest share of workers aged 18 and older - 14 percent in 2011 - experienced just a small decline in employment while real wages remained virtually unchanged.
Chart 6: Employment and wage growth between 2006 and 2011 in Kentucky's metros, full-time, full-year workers aged 18 and older
Source: Public Use Micro Data Sample (PUMS), 1-year estimates, 2006 and 2011
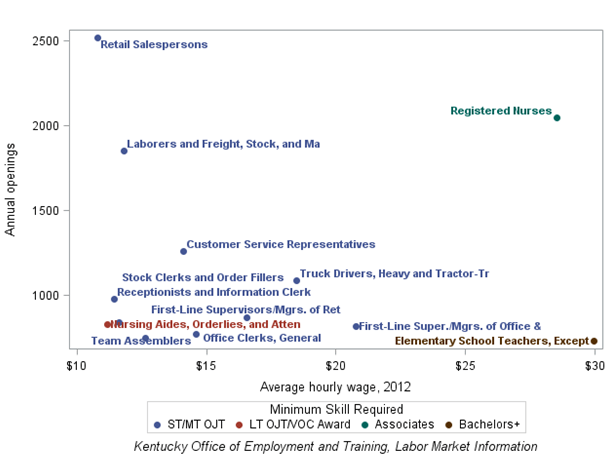
According to data from Kentucky's Office of Employment and Training, registered nurses, who require at least an Associate's degree, rank near in the top in terms of projected annual openings between 2010 and 2020 in Kentucky (see Chart 7). About 58 percent of anticipated job openings in this occupation are predicted to be due to employment growth rather than replacement. Retail sales, a lower-wage occupation, is expected to have the largest number of projected openings in Kentucky's metros, with just 34 percent of the increase predicted to be due to job growth. Other occupations with a large number of projected openings include laborers and customer services representatives; while these are jobs that could be filled by non-college-bound individuals, they are relatively low-paying.
Chart 7: Projected annual openings between 2010 and 2020 by wages in Kentucky
Source: Public Use Micro Data Sample (PUMS), 1-year estimates, 2006 and 2011
Summary
In this data brief, we describe changes in the labor market of Kentucky's metros during the recovery period. Between 2006 and 2011, we see a small increase in the share of young workers in relatively higher-paying Transportation and Production occupations, which are accessible to those without a college degree. But while employment in Transportation occupations grew from 2006 to 2011, real wages declined during these years. Other occupations available to non-college bound youth, such as Healthcare Support, Personal Care, and Food Preparation & Services, also grew in employment but experienced decreases in real wages. The shift from full-time to part-time employment was concentrated mainly in Food Preparation & Services and Sales occupations, and particularly among cashier jobs, which are lower-skilled, lower-paying positions. However, young workers are increasingly found in the higher-skill, higher-paying Education jobs, and employment opportunities for elementary school teachers are among those expected to be relatively strong based on projected annual openings over the next several years. Jobs in the Healthcare Practitioner field—in particular Registered Nurses—are projected to have some of the largest gains in employment. This field is also one of the few occupations that showed an increase in average real wages from 2006 to 2011 in Kentucky's metros.
Data Notes
The PUMS wage data used in this analysis is based on workers' self-reported wages in the previous 12 months (52 weeks). Since the data provide a range of weeks worked (i.e. 1-13 weeks) rather than the exact number of weeks worked in the previous year, we are not able to estimate the yearly wage of individuals working less than a year in proportion to the time worked. Thus, we compute average wages only among individuals reporting at least 40 weeks of work and use the wage reported as their yearly wage.
Data Source
The 1% Public Use Micro Data Sample (PUMS) data includes individual-level data on the demographics, education, wages and employment of the population. Data were extracted IPUMS at https://usa.ipums.org (IPUMS citation: Steven Ruggles, J. Trent Alexander, Katie Genadek, Ronald Goeken, Matthew B. Schroeder, and Matthew Sobek. INTEGRATED PUBLIC USE MICRODATA SERIES: VERSION 5.0 [Machine-readable database]. Minneapolis: University of Minnesota, 2010.) The data on annual openings, minimum skill level and averages wages by occupation was found in the "Kentucky Occupational Outlook to 2020" report available at, http://www.doleta.gov/performance/results/AnnualReports/2011_economic_reports/ky_occupation_outlook.pdf
Footnotes
- Full-year workers are those that reported working at least 40 weeks in the past 12 months. According to the PUMS data set, 84% of the young workers were full-year workers in Kentucky's metro areas in 2011.
- The color-coding of occupations into three groups provides more detail on the educational attainment of their full-year workers in 2011. Occupations with at least half of their workers holding a Bachelor's or post-graduate degree are classified as high-skilled (green). Occupations for which at least half of their workers do not hold more than a HS degree are classified as low-skilled (blue). The remaining occupations are considered to be mid-skilled as they have less of a concentration of workers at either end of the educational attainment spectrum.