

- Share
Education and Employment Opportunities for Younger Workers in the Pittsburgh MSA
In this data brief, we describe changes in the Pittsburgh MSA labor market during the recession and recovery period of 2006-2011. Our analysis shows several positive signs in Pittsburgh’s job market, particularly that of younger workers: high educational levels, growing or stable employment and real wages—even in the lower-skilled occupations—and virtually no shift in the share of young adults working part-time during the period of study.

The views expressed in this report are those of the author(s) and are not necessarily those of the Federal Reserve Bank of Cleveland or the Board of Governors of the Federal Reserve System.
In this data brief, we describe changes in the Pittsburgh MSA labor market during the recession and recovery period of 2006-2011. Our analysis shows several positive signs in Pittsburgh’s job market, particularly that of younger workers: high educational levels, growing or stable employment and real wages—even in the lower-skilled occupations—and virtually no shift in the share of young adults working part-time during the period of study.
In this data brief, we examine the educational attainment levels, employment status, and occupations of workers in the Pittsburgh MSA. Our analysis focuses primarily on the job prospects for those aged 18 to 35 – referred to herein as “young workers” or “young” – with no post-secondary degree. We describe changes in education, employment, and wages between 2006 and 2011 and provide projected job growth in the region by skill-level requirements.
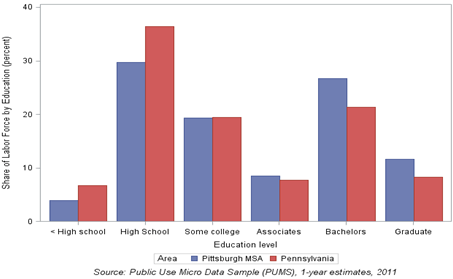
The educational attainment of those aged 18-35 in the labor market rose between 2006 and 2011 in the Pittsburgh MSA, mainly reflected by an increase in the share of workers with Bachelor’s and Postgraduate degrees. The share of workers with a Bachelor’s degree or above went from 33 percent to 38 percent over that time period, while the share of workers with an Associates’ degree slightly declined from 10 percent to nine percent. As shown in Chart 1, education levels in the Pittsburgh MSA are far above state levels on both ends of the distribution. Only 34 percent of those aged 18-35 in 2011 had at most a high school degree in the Pittsburgh MSA compared to 43 percent in Pennsylvania and 44 percent nationally.
Chart 1: Educational Attainment of Individuals 18-35 Years of Age
Source: Public Use Micro Data Sample (PUMS), 1-year estimates, 2011
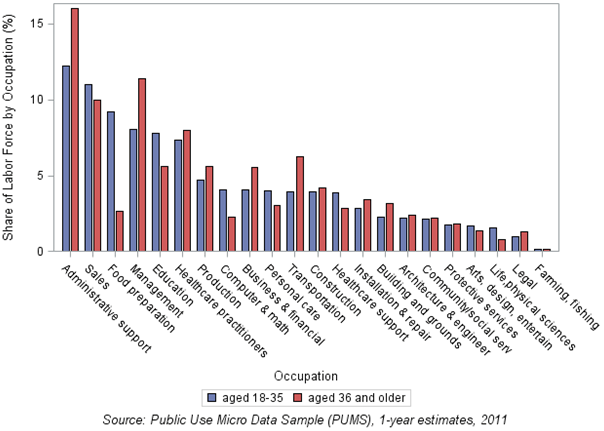
Jobs in Education and Computer & Math grew from 2006 to 2011, as did the share of young workers employed in these occupations. The share of workers aged 18 and above employed in Education went from four and half percent to just over 6 percent and among young workers, this share grew from six percent to nearly 8 percent. Young workers also increased their share of employment in Computer & Math occupations over this time period. In 2011, four percent of young workers were employed in the field, double the corresponding share for older workers. Among occupations requiring lower educational attainment, young workers have higher shares of employment in Food Preparation & Services, Personal Care & Services, and Healthcare Support, as seen in Chart 2.
Chart 2: Distribution of full-year workers in occupations by age group in Pittsburgh MSA, 2011
Source: Public Use Micro Data Sample (PUMS), 1-year estimates, 2011
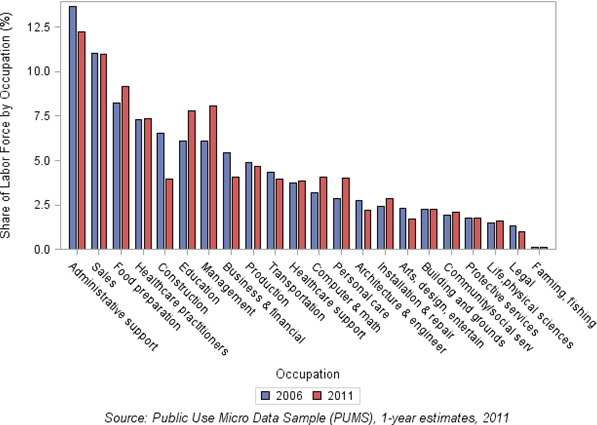
The decline in the share of young workers employed in Construction and Production jobs over this period of recession and slow recovery is aligned with national trends. The loss of jobs in these occupations may have been in part offset by the gain in Personal Care & Services and Healthcare Support jobs, all of which are less likely to require post-secondary degrees. The Pittsburgh MSA has also seen a recent increase in its share of young, more- educated workers holding Management, Education, and Computer & Math jobs.
Chart 3: Distribution of full-year workers, aged 18-35, in occupations by year in Pittsburgh MSA
Source: Public Use Micro Data Sample (PUMS), 1-year estimates, 2011
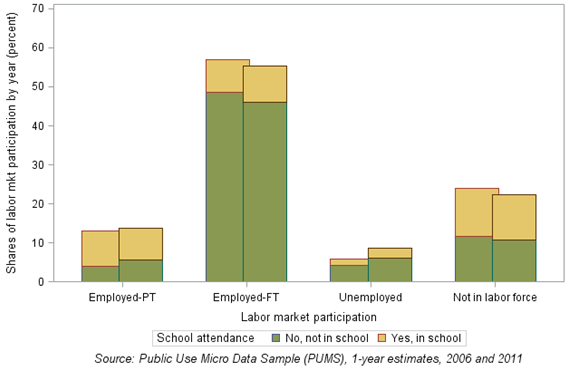
While as a whole the share of part-time employment among young workers remained virtually constant in the Pittsburgh MSA over this time period, changes in the full-time and part-time shares of workers within some occupations did take place. For instance, there was an increase in the share of part-time workers in Healthcare Practitioner and Personal Care & Services occupations, while this share declined for Food Preparation & Services occupations.
Chart 4: Labor market participation and school attendance of population aged 18-35 in the Pittsburgh MSA
Note: 2006 left bars and 2011 bars right
Source: Public Use Micro Data Sample (PUMS), 1-year estimates, 2011
From this point on, we focus our analysis on characterizing recent changes in occupations by changes in the educational attainment of their workers, their wages, and employment. In Chart 5, we look at workers aged 18 and above who reported working at least 40 weeks in the previous 12 months, regardless of the number of hours worked per week. These full-year workers make up 89 percent of all workers in the Pittsburgh MSA who were at least 18 years old in 2011. In Chart 6 we further restrict this sample to individuals reporting at least 30 hours of work in a usual week, which allows us to consider their reported wages as full-time wages. The share of full-time, full-year workers is 77 percent in 2011.
In Chart 5 each occupation is plotted by the share of workers aged 18 and older with a post-secondary degree in 2006 and 2011.1 In this scatter plot, occupations above the line indicate an increase in share of workers with a post-secondary degree from 2006 to 2011. Those below the line indicate a decrease in the share of workers with a post-secondary degree in that time period. For example, the educational attainment of workers employed in Protective Services and Administrative Support both increased from 2006 to 2011.
Such upward shifts could be the result of changes in young workers’ perceived value of a college degree, a relative increase in the demand for jobs requiring higher skills, or on-the job-opportunities for improving their skills. On the other hand, they could also be the result of higher-skilled workers moving to lower-skilled jobs as the economy contracted. While our analysis cannot pinpoint the reason for the shifts in the educational attainment of these workers, we do see an increase in the share of workers with a post-secondary degree in the Healthcare Support field with nearly all the growth coming from increases in those with an Associate’s degree. We also see an increase in the educational level of workers employed in Protective Services and Personal Care & Services, due mainly to increases in those with a Bachelor’s degree. Overall, however, these professions represent only a small portion of the workforce. In 2011, the share of workers aged 18 and above employed in Healthcare Support, Protective Services, and Personal Care & Services were three percent, two percent, and three percent, respectively.
Chart 5: Shifts in the share of workers with a post-secondary degree by occupation. Workers aged 18 and older, 2006 & 2011
Source: Public Use Micro Data Sample (PUMS), 1-year estimates
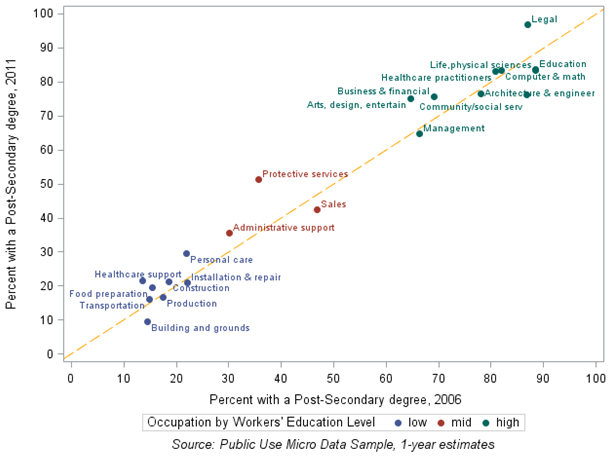
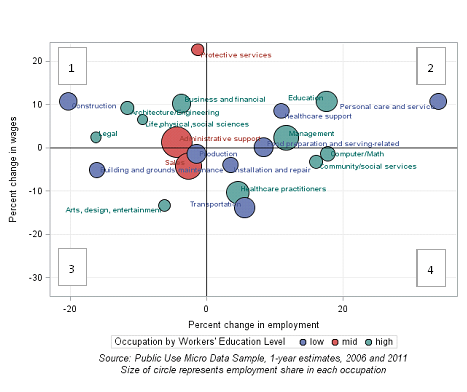
Chart 6 shows changes in employment and real wages between 2006 and 2011 in the Pittsburgh MSA for all workers aged 18 and above. The circle size represents the employment share of each occupation in 2011. In other words, the larger the circle, the greater the share of employees working in that occupation. Administrative Support, for example, employed the greatest proportion of workers aged 18 and older in 2011. The Pittsburgh MSA has a relatively large—and growing—share of its educated labor force employed in education-related jobs. Low-educated workers are employed in fields such as Personal Care & Services, Food Preparation & Services, and Healthcare Support, all of which have experienced growth in employment and/or wages. Overall, there are few occupations that have experienced drops in both employment and real wages (third quadrant), a positive sign for the Pittsburgh labor market during the post-recession years.
Chart 6: Employment and real wage growth between 2006 and 2011 in the Pittsburgh MSA, all full-year, full-time workers aged 18 and older
Source: Public Use Micro Data Sample (PUMS), 1-year estimates, 2006 and 2011
Size of circle represents employment share in each occupation
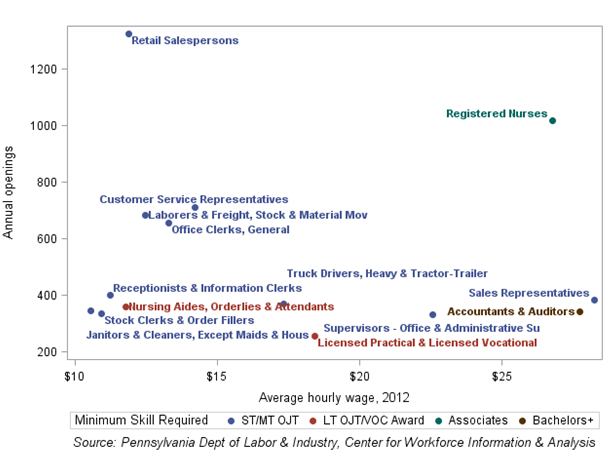
According to data from Pennsylvania’s Department of Labor and Industry, registered nurses, which require at least an Associate’s degree, tops the list of jobs in terms of annual openings between 2008 and 2018 in the Pittsburgh MSA (see Chart 7). Other occupations in Healthcare, Sales, and Transportation are also projected to have a relatively large number of future openings. These occupations offer an above-minimum wage and require some post-high school education but less than an Associate’s degree.
Chart 7: Projected annual openings between 2008 and 2018 by wages in Pittsburgh MSA
Source: Pennsylvania Department of Labor & Industry, Center for Workforce Information & Analysis
Summary
In this data brief, we describe changes in the Pittsburgh MSA labor market during the recovery period. The Pittsburgh MSA stands out among other Fourth District MSAs we’ve examined when it comes to the education levels of its young workers. Their young labor force has more college graduates and fewer high school dropouts compared to those in Cincinnati and Cleveland MSAs. Notably, upwards of 38 percent of young workers have a Bachelor’s degree or more, compared to 29 percent in the Cincinnati MSA and 27 percent in the Cleveland MSA. Growing shares of young workers in the Pittsburgh MSA are employed in higher-skilled occupations such Education, Management, and Computer & Math; these same occupations experienced growth in employment and/or wages from 2006 to 2011. Healthcare Support and Personal Care & Services, occupations that generally employ lower-educated workers and pay among the lowest average wages, also experienced gains in employment and real wages along with increases in the education levels of workers. The relative health of the Pittsburgh MSA labor market is evident in the large number of occupations with growth in employment, real wages, or both compared to the Cincinnati and Cleveland MSAs. Fewer than four occupations in Pittsburgh experienced both wage and employment declines, compared to nine occupations that showed these declines in the Cleveland and Cincinnati MSAs. Our analysis shows several positive signs in Pittsburgh’s job market, particularly that of younger workers: increasing education, growing or stable employment and wages—even in the lower-skilled, lower-wage occupations—and virtually no shift in the share of young adults working part-time during the recovery period in the Pittsburgh MSA.
Data Notes
The PUMS wage data used in this analysis is based on workers’ self-reported wages in the previous 12 months (52 weeks). Since the data provide a range of weeks worked (i.e. 1-13 weeks) rather than the exact number of weeks worked in the previous year, we are not able to estimate the yearly wage of individuals working less than a year in proportion to the time worked. Thus, we compute average wages only among individuals reporting at least 40 weeks of work and use the wage reported as their yearly wage. About 79 percent of the workers aged 18 and older (74 percent for worker aged 18-35) in the Pittsburgh MSA worked at least 50 weeks in the past 12 months and 87 percent worked at least 40 weeks (82 percent for workers aged 18-35). Teachers and construction workers, for instance, may report around 40 weeks of work over a year.
Data Source
The 1% Public Use Micro Data Sample (PUMS) data includes individual-level data on the demographics, education, wages and employment of the population. Data were extracted IPUMS at https://usa.ipums.org (IPUMS citation: Steven Ruggles, J. Trent Alexander, Katie Genadek, Ronald Goeken, Matthew B. Schroeder, and Matthew Sobek. INTEGRATED PUBLIC USE MICRODATA SERIES: VERSION 5.0 [Machine-readable database]. Minneapolis: University of Minnesota, 2010.) The data on annual openings, minimum skill level and averages wages by occupation was extracted from the Center for Workforce Information & Analysis, Pennsylvania Department of Labor & Industry, found at http://www.paworkstats.state.pa.us
Footnotes
- The color-coding of occupations into three groups provides more detail on the educational attainment of their full-year workers in 2011. Occupations with at least half of their workers holding a Bachelor’s or post-graduate degree are classified as high-skilled (green). Occupations for which at least half of their workers do not hold more than a HS degree are classified as low-skilled (blue). The remaining occupations are considered to be mid-skilled as they have less of a concentration of workers at either end of the educational attainment spectrum.