

- Share
Who's Driving Medicaid's Enrollment Growth?
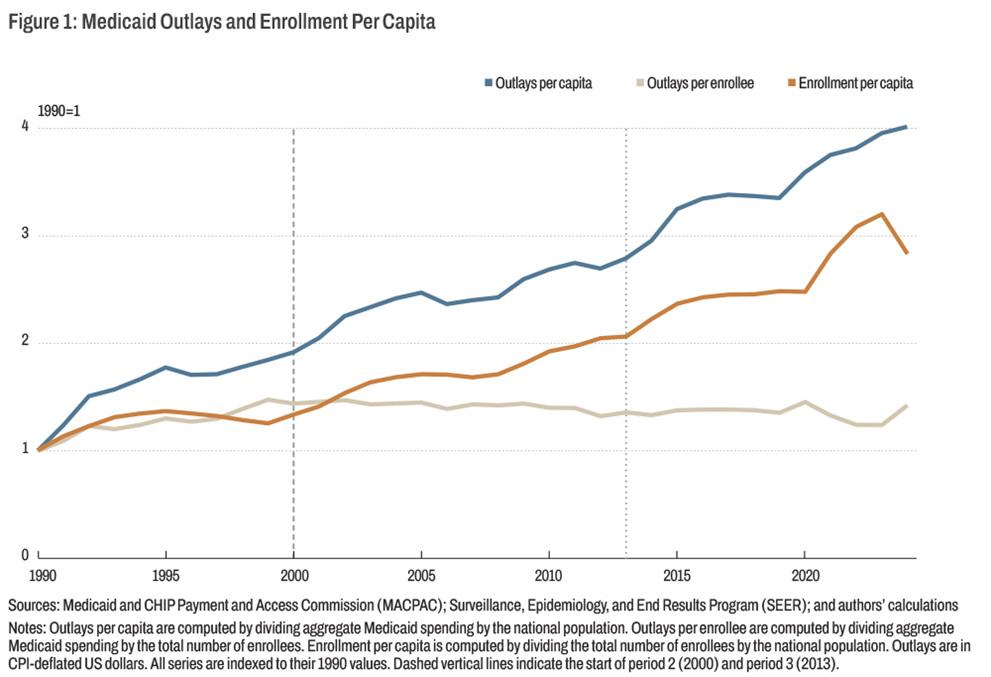
Since 1990, Medicaid outlays per capita have increased fourfold, driven primarily by enrollment growth rather than rising costs per enrollee. The program, which has served since its inception as a safety net for the elderly, the disabled, and children living in poverty, has grown over time; in 2024, more than one in four Americans was enrolled. With new community engagement requirements poised to reshape the program, understanding what demographics are driving Medicaid's enrollment growth can provide insights into how the program is likely to evolve going forward. We show that children and their families drove growth from 1990 to 2000; childless adults, both working and nonworking, drove growth from 2000 to 2013; and all working adults drove growth from 2013 to 2024.


The views authors express in Economic Commentary are theirs and not necessarily those of the Federal Reserve Bank of Cleveland or the Board of Governors of the Federal Reserve System. The series editor is Tasia Hane. This paper and its data are subject to revision; please visit clevelandfed.org for updates.
Introduction
Medicaid is a means-tested entitlement program, or government initiative guaranteeing specific benefits to individuals who meet legally defined eligibility requirements. Established in 1965 under Title XIX of the Social Security Act, it finances primary and acute medical care and long-term care for eligible low-income individuals. The criteria for eligibility have changed over time, and today, eligible populations span a wide range, including children, pregnant women, low-income elderly and disabled individuals, and working adults in low-wage jobs. The program is jointly administered and funded at federal and state levels. It requires states to provide specific benefits—including inpatient and outpatient hospital services, physician services, nursing home services, mental health services, and preventative care for children—with the option to cover additional services such as prescription drugs, home- and community-based services, and dental care.
Healthcare services have grown over time as a proportion of US consumption spending and gross domestic product, and Medicaid outlays per capita have reflected this trend (Congressional Research Service, 2026), increasing steadily in recent decades and reaching four times their 1990 level in 2024. Using enrollment and spending data from the Medicaid and CHIP Payment and Access Commission (MACPAC) and the Current Population Survey (CPS), we show that growth in outlays has been driven almost entirely by growth in enrollment per capita rather than by growth in outlays per enrollee.1 The main drivers of this coverage expansion have changed over time. Prior to 2000, enrollment growth was driven by an increase in coverage of children and their families. From 2000 to 2013, enrollment growth was driven by an increase in coverage of childless nondisabled and disabled adults,2 with similar increases in the number of working and nonworking adults on Medicaid. Since 2014, the Affordable Care Act (ACA) Medicaid expansion has driven growth, with expansion states extending coverage to adults earning up to 138 percent of the federal poverty level, and enrollment growth during this period has been driven primarily by working adults. We document these trends and discuss their implications for the new community engagement requirements set to take effect in January 2027 that will require nondisabled adults covered through the ACA expansion to work or engage in other qualifying activities for at least 80 hours per month.
Growth in Medicaid: Enrollment Drives Outlays
The rise in Medicaid outlays per capita since 1990 can be seen in Figure 1. The primary driver of this growth has been an increase in enrollees rather than a rise in spending per enrollee. Medicaid enrollment per capita increased by nearly 200 percent from 1990 through 2024, while outlays per enrollee increased by only 42 percent over the same period.
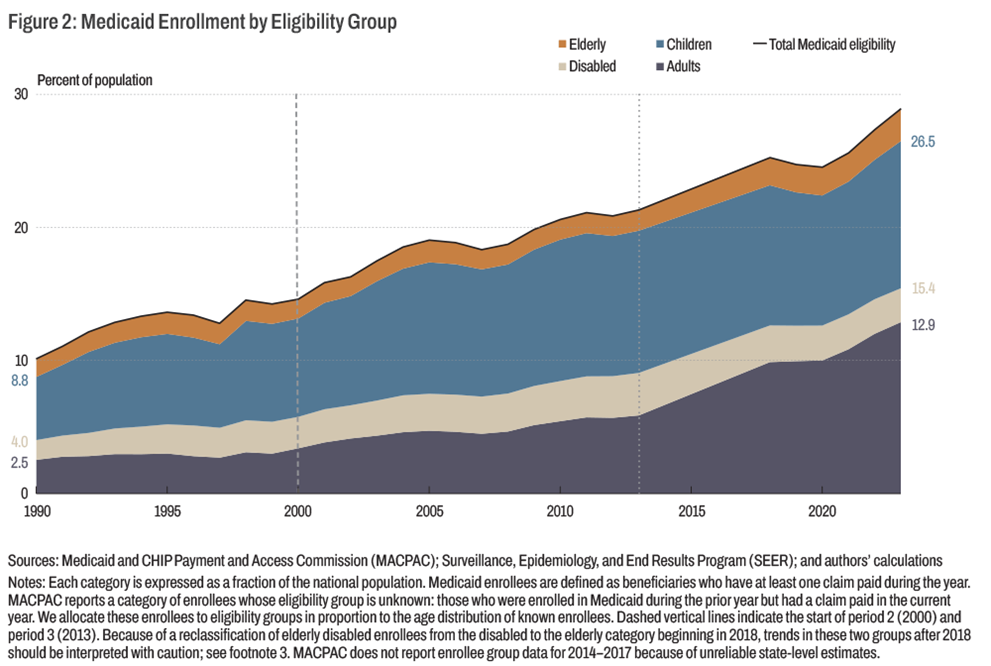
Enrollment growth was driven by increases across all four eligibility groups—adults, children, the elderly, and the disabled—though the gains were far from uniform. Figure 2 illustrates the trends in enrollee eligibility group shares as a fraction of the US population.3 The most pronounced shift was among adults: as a share of the population, adult Medicaid enrollment increased just more than fivefold, from 2.5 percent to 12.9 percent. The next largest gain was among children, whose enrollment more than doubled as a fraction of the population, rising from 4.7 percent to 11.1 percent. By contrast, enrollment shares of the elderly and disabled grew modestly, from 1.3 percent to 2.4 percent and from 1.5 percent to 2.5 percent, respectively.
Over this period, enrollment growth can be characterized by three distinct phases, each driven by a different set of policy changes.
Period 1: 1990–2000. During the first period, enrollment and spending rose at roughly similar rates (Figure 1). The primary policy driver was the federal government's decision to decouple Medicaid from cash welfare assistance. At the start of the 1990s, Medicaid recipiency was still largely tied to receiving cash assistance under Aid to Families with Dependent Children (AFDC) or Supplemental Security Income (SSI), even though late-1980s eligibility expansions targeting low-income pregnant women and children had begun widening the program's reach beyond welfare recipients (Boben, 2000). These poverty-related expansions likely drove much of the growth in children's enrollment during the first half of the 1990s (Figure 2). The shift was formalized in 1996 when welfare reform replaced AFDC with the Temporary Assistance for Needy Families (TANF) block grant and severed the automatic link between welfare receipt and Medicaid eligibility, meaning that families who lost or never qualified for cash assistance could nonetheless remain covered by Medicaid (Provost and Hughes, 2000).
A notable feature of this period is that, of the three periods, it saw the largest increase in disabled Medicaid enrollees, with disabled enrollment as a share of the population growing from 1.5 percent in 1990 to 2.4 percent in 2000, a 60 percent increase over the period. The primary driver was an increase in SSI recipiency rates since SSI receipt automatically confers Medicaid eligibility. One driver of the increase in SSI recipiency was the Supreme Court's 1990 ruling in Sullivan v. Zebley that broadened SSI eligibility for disabled children. Following the ruling, the number of children covered by SSI nearly tripled, with many of those new recipients not previously eligible for Medicaid (Garrett and Glied, 1997). Another driver was the 1984 legislative reforms that mandated new disability standards for individuals with mental disorders and multiple nonsevere impairments. The effects of the legislative reform on disability roles continued into the early 1990s. Finally, a third driver was the poor economy at the start of the decade, which contributed to growth in SSI applicants (Social Security Administration, 2006).
Period 2: 2000–2013. In the second period, enrollment per capita doubled, while spending per enrollee declined slightly (Figure 1). Growth in this period was driven primarily by policy expansions targeting two groups: childless adults and children. Childless adults gained access through Section 1115 demonstration waivers. Prior to the ACA, states wishing to extend coverage to low-income adults without dependent children had no direct federal funding pathway to do so. The only available mechanism was a Section 1115 waiver, under which states could expand coverage provided they could demonstrate that the expansion would not cost the federal government more than existing law. States typically justified these waivers by pointing to savings from reduced uncompensated care for the newly enrolled. A number of states pursued this route during the 2000s, gradually extending Medicaid to low-income adults ahead of the ACA (Rudowitz, Artiga, and Arguello, 2013).
Children's enrollment also grew during this period, driven in part by the creation of the State Children's Health Insurance Program (SCHIP) in 1997.4 SCHIP provides health insurance coverage to uninsured children whose family incomes are too high to qualify for Medicaid but too low to afford private coverage. Like Medicaid, SCHIP is jointly funded by the Federal and state governments. Although SCHIP is a separate program, states with standalone SCHIP programs are required to screen applicants for Medicaid eligibility and enroll those who qualify for Medicaid rather than just deny their applications for SCHIP. SCHIP's creation and subsequent reauthorizations also prompted states to simplify Medicaid enrollment procedures, most consequentially by dropping the asset test inherited from Medicaid’s origins in cash welfare (Kronebusch and Elbel, 2004) and invest in outreach to low-income families. Because many Medicaid-eligible children had never enrolled, these efforts generated substantial spillover increases in Medicaid enrollment: previously eligible but unenrolled children were brought into Medicaid, and children already enrolled in SCHIP transitioned to Medicaid if their family's economic circumstances declined (Dubay, Guyer, Mann and Odeh, 2007; Smith, Rudowitz, and Snyder, 2014).
Period 3: 2013 and after. The third period was marked by the Affordable Care Act's Medicaid expansion, which took effect on January 1, 2014. The ACA gave states the option to extend Medicaid eligibility to adults under age 65 with household income up to 138 percent of the federal poverty level regardless of disability or parental status. This period saw a steeper acceleration in enrollment per capita than either of the two preceding periods, while outlays per enrollee continued to slowly decline (Figure 1). Between mid-2013 and March 2020, enrollment in Medicaid expansion states increased by 13 million, or 33.9 percent, with 22 states seeing enrollment gains of at least 25 percent (Medicaid and SCHIP Payment and Access Commission, 2022). As shown in Figure 2, essentially all this enrollment growth was due to a rise in the number of nondisabled adults on Medicaid. Between 2013 and 2023, the number of adults on Medicaid more than doubled, rising from 5.9 percent to 12.9 percent of the US population. By contrast, the share of nondisabled children on Medicaid remained roughly unchanged at around 11 percent during this period.5
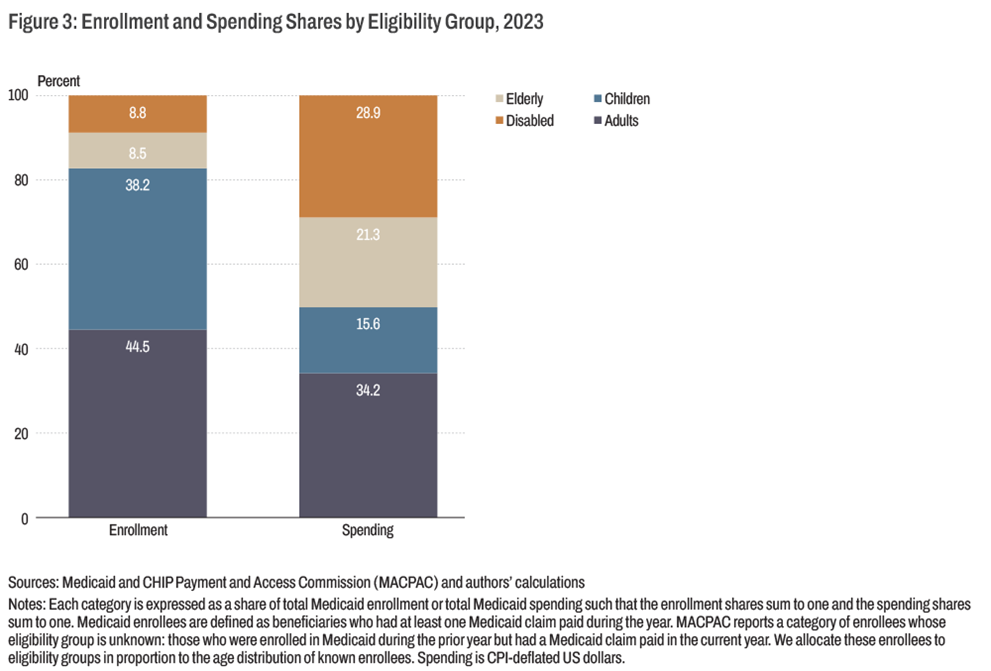
These post-2013 changes reshaped the composition of the Medicaid population. Adults, who made up only 25 percent of enrollees in 1990, accounted for 45 percent by 2023, while children's share fell from 47 percent to 38 percent, the elderly from 13 percent to 8.5 percent, and the disabled from 15 percent to 9 percent. This compositional shift helps explain the slow growth, and slight decline since 2000, in outlays per enrollee. As shown in Figure 3, despite comprising the largest enrollment group, adults accounted for only 34.2 percent of spending in 2023, while the disabled and elderly, who each comprise less than 9 percent of enrollees, accounted for 28.9 percent and 21.3 percent of spending, respectively. The fact that enrollment growth was driven by adults who are relatively inexpensive to cover tempered its effect on total outlays.
Medicaid's Changing Adult Population
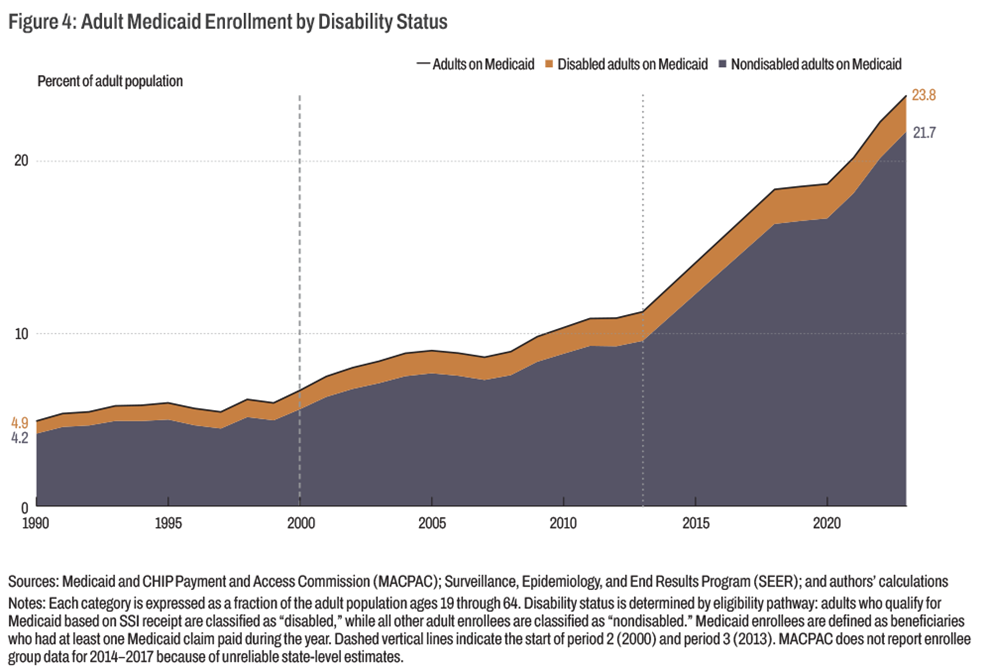
The share of the adult population enrolled in Medicaid increased from 4.9 percent in 1990 to 23.8 percent in 2023 (Figure 4). The vast majority of this increase has been for nondisabled adults. Using MACPAC's definition of disability, which is based on SSI eligibility status, the share of the adult population that comprised disabled Medicaid enrollees increased by only 1.4 percentage points over the full sample period, compared with a nearly 18 percentage point increase in the share that comprised nondisabled adult enrollees.
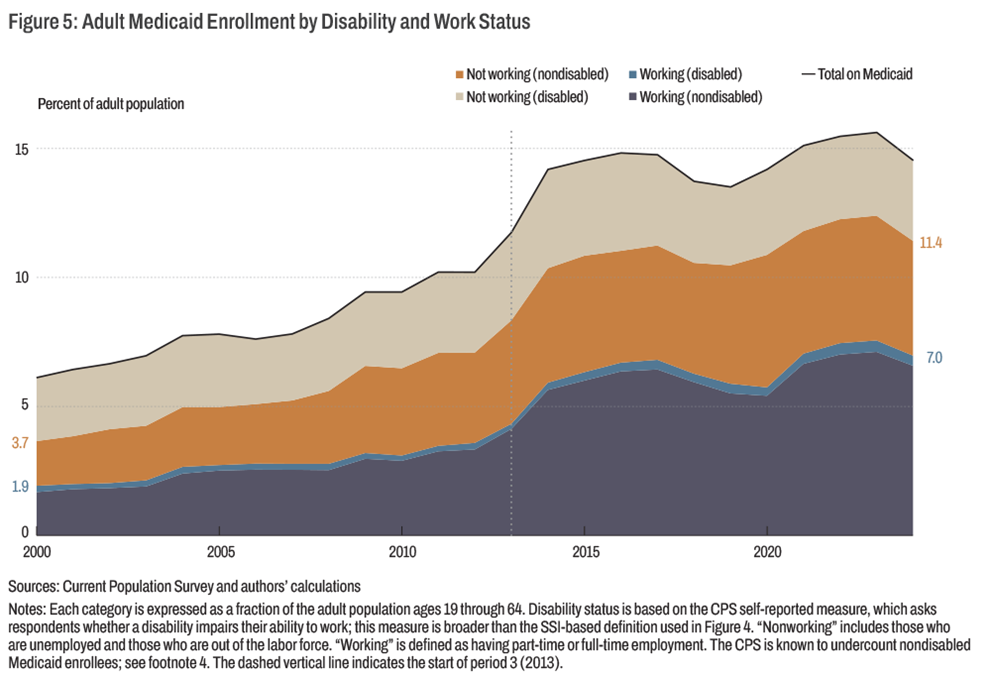
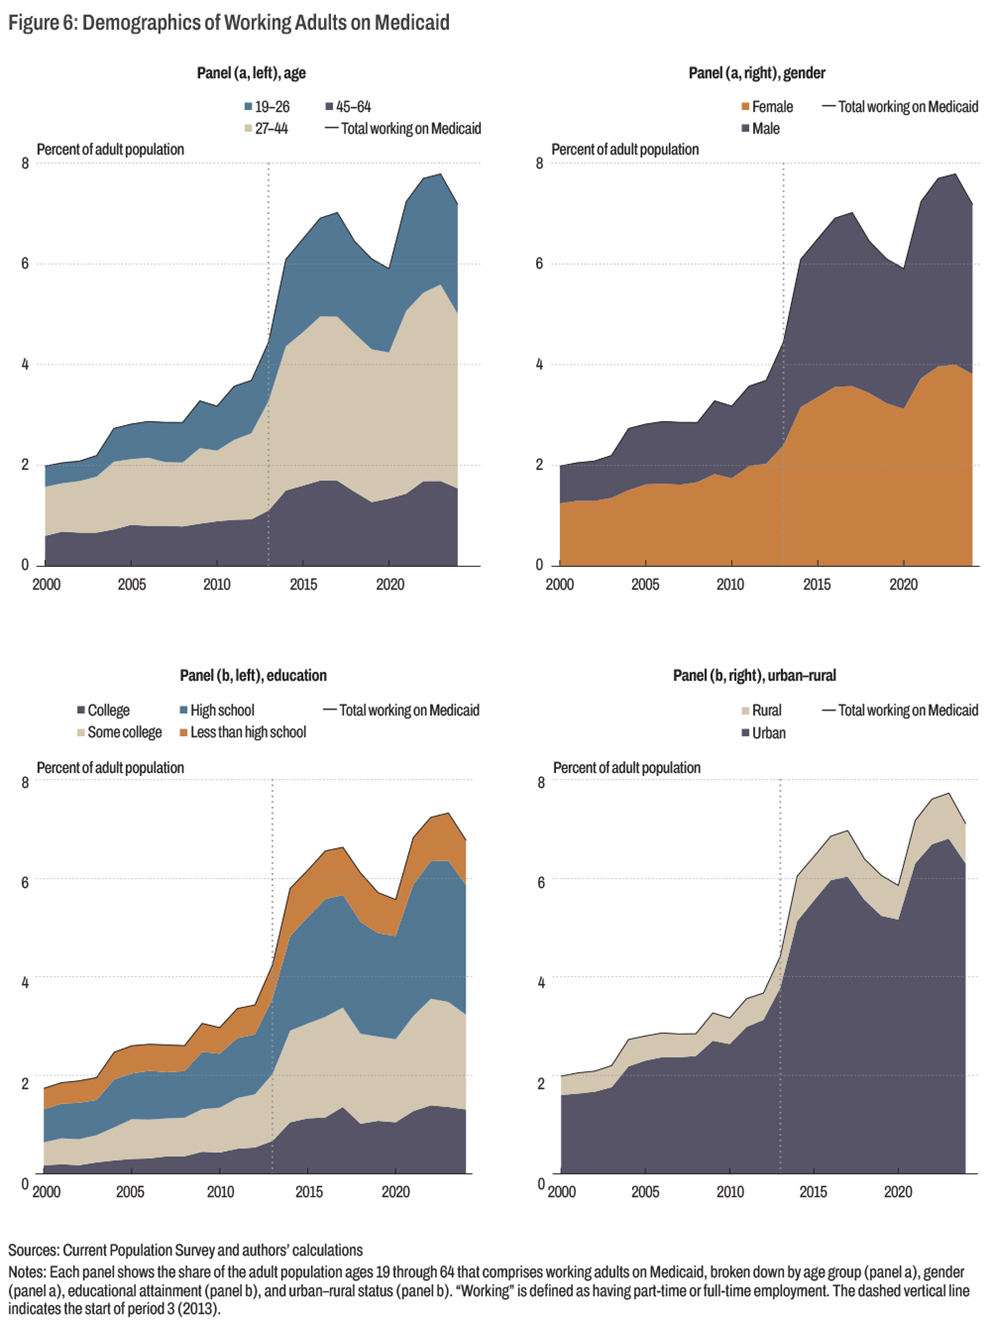
To dig deeper into who is driving adult enrollment growth, Figure 5 breaks down the adult Medicaid population by disability status and work status using the CPS's broader self-reported disability measure rather than MACPAC's narrower SSI-based definition.6 The breakdown tells a clear story: the primary driver of Medicaid enrollment growth is nondisabled working adults. Nondisabled working adults on Medicaid nearly quadrupled as a share of the adult population, rising from 1.7 percent to 6.6 percent from 2000 through 2024. As a share of the adult Medicaid population, this group grew from 27 percent to 45 percent over the same period. The share of nondisabled nonworking adults grew more modestly as a share of the adult population, rising from 1.7 percent to 4.4 percent. Consequently, their share of the adult Medicaid population changed little, edging up from 28 percent to 31 percent. Taking a closer look at who among working adults is driving Medicaid enrollment growth, Figure 6 shows that working adults on Medicaid are increasingly aged 45 through 64, male, high school graduates or higher, and residents of urban areas. This represents a shift from Medicaid's origins as a program tied to cash welfare assistance for women, children, those with severe disabilities, and those who are very poor.
Looking Ahead: Community Engagement Requirements
The One Big Beautiful Bill Act introduces community engagement requirements that are set to take effect in 2027. Under these provisions, nondisabled individuals who obtain Medicaid through the ACA expansion must demonstrate that they meet work requirements defined as at least 80 hours per month of combined work, community service, or job training, or at least 40 hours of educational enrollment.7 Pregnant women, caregivers of children under 14, and caregivers of disabled family members will not be subject to these requirements.8
According to the CPS trends in Figure 5, the share of nondisabled nonworking adults on Medicaid has grown little since 2013, rising from 4.0 percent to 4.4 percent of adults. The small rise in the number of nonworking adults is consistent with the findings of several research papers showing that ACA Medicaid expansion had little to no effect on labor supply (Buchmueller, Levy, and Valletta, 2019; Baicker et al., 2014; Heim et al., 2024). The small rise also means that community engagement requirements may not substantially increase the share of adults working. Evidence from the Arkansas experience supports this conclusion. In June 2018, Arkansas became the first state to implement work requirements for receiving Medicaid, requiring beneficiaries aged 30 to 49 to work 80 hours per month, participate in qualifying community engagement activities, or meet criteria for an exemption such as pregnancy or disability, with removal from Medicaid after three months of noncompliance or nonsubmission of monthly online reports. Sommers et al. (2019) found no statistically significant effect of Arkansas's work requirements on employment. Moreover, they found that more than 92 percent of respondents to a 2018 survey of Medicaid-eligible individuals in Arkansas, Kentucky, Louisiana, and Texas were already meeting the Arkansas work requirements or were exempt from them.
Even though most of the growth in Medicaid enrollees since 2013 has been among those who are nondisabled and working, and Medicaid is unlikely to have a large effect on the share of adults working, work requirements may still affect Medicaid coverage. Sommers et al. (2019) found that implementation of work requirements in Arkansas reduced Medicaid coverage, citing lack of awareness and confusion about reporting requirements as potential drivers. Sommers et al. (2019) also find that many eligible enrollees in Arkansas lost coverage because of paperwork burdens or failure to prove exemptions, including disability, rather than because they failed to meet the work threshold itself. This finding matters because the ACA Medicaid expansion produced large reductions in the share of low-income adults without health insurance. Huettner (2026) finds that among adults aged 18 to 64 with income at or below 138 percent of the federal poverty level, uninsurance rates in the Fourth Federal Reserve District, which includes Ohio and parts of Kentucky, Pennsylvania, and West Virginia, declined from 32 percent to 13 percent following expansion. Coverage losses driven by administrative barriers to compliance could partially reverse these gains while producing little offsetting gain in labor supply.
Conclusion
The rise in Medicaid outlays over the last three decades has been driven by enrollment growth rather than rising costs per enrollee, with growth concentrated among adults and children who are relatively inexpensive to cover. Most of the growth in adult enrollment since 2013 has been among nondisabled working adults, a group likely to already meet the new federal community engagement requirements set to take effect in January 2027. These work requirements are therefore unlikely to substantially reduce current enrollment levels for this group of adults, and coverage losses are more likely to stem from administrative barriers to proving compliance than from true ineligibility. As Medicaid has shifted from a program primarily serving those outside the labor force to one that increasingly covers working adults in jobs without employer-sponsored insurance, its enrollment will be shaped as much by the structure of the low-wage labor market as by the eligibility rules that govern the program itself.
References
- Baicker, Katherine, Amy Finkelstein, Jae Song, and Sarah Taubman. 2014. “The Impact of Medicaid on Labor Market Activity and Program Participation: Evidence from the Oregon Health Insurance Experiment.” American Economic Review 104: 322–328. dx.doi.org/10.1257/aer.104.5.322.
- Boben, Paul J. 2000. "Medicaid Reform in the 1990s." Health Care Financing Review 22: 1–5. pubmed.ncbi.nlm.nih.gov/12500317/.
- Buchmueller, Thomas C., Helen G. Levy, and Robert G. Valletta. 2021. "Medicaid Expansion and the Unemployed." Journal of Labor Economics 39: 575–617. journals.uchicago.edu/doi/abs/10.1086/712478.
- Congressional Research Service. 2026. Medicaid Financing and Expenditures. CRS Report R42640.
- Dubay, Lisa, Jocelyn Guyer, Cindy Mann, and Michael Odeh. 2007. "Medicaid at the Ten-Year Anniversary of SCHIP: Looking Back and Moving Forward." Health Affairs 26: 370–381. doi.org/10.1377/hlthaff.26.2.370.
- Garrett, A. Bowen, and Sherry Glied. 1997. "The Effect of US Supreme Court Ruling Sullivan v. Zebley on Child SSI and AFDC Enrollment." National Bureau of Economic Research, Working Paper No. 6125.
- Heim, Bradley, Ithai Lurie, Elena Patel, and Shanthi Ramnath. 2024. "Medicaid-Ing Coverage Volatility for Displaced Workers: Evidence from the 2019 Virginia Medicaid Expansion.” doi.org/10.2139/ssrn.5109982.
- Huettner, Brett. 2026. "How Will New Federal Requirements Affect Medicaid Expansion Enrollees in the Fourth District?" Federal Reserve Bank of Cleveland, District Data Brief. doi.org/10.26509/frbc-ddb-20260113.
- Kronebusch, Karl and Brian Elbel. 2004. “Simplifying Children’s Medicaid and SCHIP.” Health Affairs 23: 233–246. healthaffairs.org/doi/10.1377/hlthaff.23.3.233.
- Medicaid and CHIP Payment and Access Commission. 2022. Medicaid Enrollment Changes Following the ACA. macpac.gov/subtopic/medicaid-enrollment-changes-following-the-aca/.
- Noon, James M., Leticia E. Fernandez, and Sonya R. Porter. 2019. "Response Error and the Medicaid Undercount in the Current Population Survey." Health Services Research 54: 34–43. pubmed.ncbi.nlm.nih.gov/30270431/.
- Provost, Christie and Paul Hughes. 2000. "Medicaid: 35 Years of Service.” Health Care Financing Review 22: 141–174. pmc.ncbi.nlm.nih.gov/articles/PMC4194689/.
- Rudowitz, Robin, Samantha Artiga, and Rachel Arguello. 2013. "A Look at Section 1115 Medicaid Demonstration Waivers under the ACA: A Focus on Childless Adults." Kaiser Family Foundation. kff.org/medicaid/a-look-at-section-1115-medicaid-demonstration-waivers-under-the-aca-a-focus-on-childless-adults/.
- Smith, Vernon K., Robin Rudowitz, and Laura Snyder. 2014. "CHIP Enrollment: June 2013 Data Snapshot." Kaiser Family Foundation. kff.org/medicaid/chip-enrollment-june-2013-data-snapshot/.
- Social Security Administration. 2006. Trends in the Social Security and Supplemental Security Income Disability Programs. SSA Publication No. 13-11831. ssa.gov/policy/docs/chartbooks/disability_trends/trends.pdf.
- Sommers, Benjamin D., Anna L. Goldman, Robert J. Blendon, E. John Orav, and Arnold M. Epstein. 2019. "Medicaid Work Requirements—Results from the First Year in Arkansas." New England Journal of Medicine 381: 1073–1082. doi.org/10.1056/NEJMsr1901772.
Endnotes
- MACPAC data are retrieved from the 2026 MACStats report (macpac.gov/macstats/). We use the CPS’s Annual Social and Economic Supplement from 2000–2023 (cps.ipums.org/cps/). Aggregate population data by age come from SEER (seer.cancer.gov/popdata/). Return to 1
- Our enrollment data do not distinguish adults with dependent children from those without, so “adults” throughout refers to all nonelderly, nondisabled adult enrollees regardless of parental status. Our references to childless adults in the 2000–2013 period describe the policy pathway driving the expansion (Section 1115 waivers), not a separate data series. Return to 2
- “Adults” are defined as ages 19 through 64, “elderly” as ages 65 and older, and “children” as below age 19. The “disabled” group includes individuals of any age. Return to 3
- The data series in Figure 2 excludes SCHIP enrollees, but children brought into Medicaid proper because of SCHIP-related outreach efforts are included. Return to 4
- The elderly share rose from 1.6 percent to 2.4 percent, and the disabled share fell from 3.2 percent to 2.5 percent, though both trends partly reflect a post-2018 reclassification of elderly disabled enrollees from the “disabled” to the “elderly” category rather than true changes in coverage. See macpac.gov/macstats/data-sources-and-methods/. Return to 5
- While we use population weights to estimate national-level shares, the CPS is known to consistently undercount the number of nondisabled people on Medicaid. The gap between Figure 4 and Figure 5 reflects this. This data issue has been noted in previous literature (Noon et al., 2019) and the references therein. For the CPS definition of disability and employment used here, see cps.ipums.org/cps-action/variables/DISABWRK#description_section and cps.ipums.org/cps-action/variables/EMPSTAT#description_section. Return to 6
- For a summary of the community engagement requirements, see ama-assn.org/system/files/medicaid-community-engagement-requirements-summary.pdf. Note that the disability definition used for exemptions under these requirements is broader than MACPAC’s SSI-based definition. Return to 7
- States use payroll and unemployment data to determine compliance with the work requirements and to determine whether an exception exists. For example, Medicaid claims related to pregnancy verify that a recipient is pregnant. If found not to be in compliance with requirements or an exception, individuals have 30 days to demonstrate it to the state or they are disenrolled in the following month. Return to 8
Suggested Citation
Hamlette, James, and Karen Kopecky. 2026. “Who's Driving Medicaid's Enrollment Growth?” Federal Reserve Bank of Cleveland, Economic Commentary 2026-23. https://doi.org/10.26509/frbc-ec-202623
This work by Federal Reserve Bank of Cleveland is licensed under Creative Commons Attribution-NonCommercial 4.0 International


Related resources

About Us
The Federal Reserve Bank of Cleveland (commonly known as the Cleveland Fed) is part of the Federal Reserve System, the central bank of the United States.

Economic Commentaries
Economic Commentaries provide analysis of relevant economic issues and are written for an informed but nonspecialist audience.