

- Share
Adjusting Median and Trimmed-Mean Inflation Rates for Bias Based on Skewness


The views authors express in Economic Commentary are theirs and not necessarily those of the Federal Reserve Bank of Cleveland or the Board of Governors of the Federal Reserve System. The series editor is Tasia Hane. This paper and its data are subject to revision; please visit clevelandfed.org for updates.
Introduction
The trend in inflation is an object of longstanding importance to policymakers and analysts because it determines the long-term movements in inflation. However, the ability to measure the trend in inflation is problematic because price data contain a mixture of temporary movements in inflation (“noise”) and the more persistent movements in inflation that underlie the trend. Consequently, various techniques have been proposed to filter out the noise in price data to isolate the trend component. Among these techniques, measures such as median inflation and trimmed-mean inflation have gained considerable popularity.
Median inflation and trimmed-mean inflation rates are constructed from the cross-sectional distribution of price changes, the systematic ranking of individual price changes of goods and services from the lowest value (which can be negative) to the highest value. These measures associate temporary movements in inflation with outliers, the extremely large (both positive and negative) price changes located in the tails of the cross-sectional distribution of price changes.1 Accordingly, these measures remove a specified percentage of price changes from the tails of the distribution and calculate trend inflation from the resulting interior region of the distribution. Because these measures are designed to exclude large and influential price changes from the calculation of trend inflation, they are referred to as “limited-influence estimators.”
While the measurement of trend inflation is admittedly a challenging task even during normal times, the pandemic has presented additional difficulties. For example, the goal of isolating the persistent movements in inflation, as measured, for example, by the personal consumption expenditures (PCE) price index, has been taking place against the backdrop of strong aggregate demand from factors such as pent-up demand, excess savings, and generous fiscal support and very accommodative monetary policy; a significant substitution of consumer spending toward goods and away from services; and the emergence of bottlenecks and supply chain disruptions. These pandemic-related events and their connection to outsized price changes have received a great deal of attention. To the extent that the outsized price changes are viewed as temporary elements in inflation, then the application of limited-influence estimators offers a reasonable approach to estimate the trend in inflation.
What has received less attention thus far is the effect of the pandemic on the skewness of the price-change distribution. Skewness is used to describe the shape of a distribution and, in particular, the location of outliers. That is, is there an even balance of outliers on the left- and right-sides of a distribution, or are most of the outliers on one side of the distribution as evidenced by the appearance of a longer tail? For limited-influence estimators, skewness can lead to biased estimates of trend inflation. This concern takes on even greater relevance today as the pandemic has witnessed a change in the skewness of the price-change distribution, from negative skewness that was common historically prior to the pandemic to positive skewness during the pandemic.
In this Commentary, we examine limited-influence estimators of trend inflation and the bias that can arise when the distribution of price changes is skewed. We document time variation in the biases of median PCE inflation and trimmed-mean PCE inflation and note that this time variation relates to changes in skewness. The latter relationship suggests that we can use skewness to adjust median and trimmed-mean PCE inflation rates to remove the biases in their estimates of trend inflation. Accounting for the shift from negative to positive skewness, we estimate that recent readings of median PCE inflation and trimmed-mean PCE inflation have been understating the trend in PCE inflation by about 15 basis points and 35 basis points, respectively.2
The Effect of Skewed Price-Change Distributions on Median and Trimmed-Mean Inflation Rates
Figure 1 plots the 12-month growth rate in the headline (all items) PCE price index along with the Cleveland Reserve Bank’s 12-month median PCE inflation rate and the Dallas Reserve Bank’s 12-month trimmed-mean PCE inflation rate for the period January 2000–December 2021.

As shown, the median and trimmed-mean inflation rates are less volatile than headline inflation, a finding that is consistent with the intended design of these limited-influence estimators to remove noise in the price data. Another noticeable feature of the data is that median PCE inflation and trimmed-mean PCE inflation can depart from PCE inflation for extended periods of time. As we will explain is typically the case, we also see that median PCE inflation lies above trimmed-mean PCE inflation. In terms of this divergent behavior, median PCE inflation has averaged about 0.3 percentage points higher than trimmed-mean PCE inflation since 2000.
Why is median PCE inflation typically higher than trimmed-mean PCE inflation, and why does the gap vary over time? The answer lies in the interaction of the construction of each measure—in particular, the way that trimming of outliers is undertaken—and in the cross-sectional distribution of price changes in the underlying components. It is well known that the distribution of price changes across components is highly kurtotic; that is, it has a relatively high presence of outliers. This means that almost every month, a small number of components experience extreme price changes, both positive and negative. Importantly, those components are not always food and energy so that core inflation measures (which exclude food and energy prices) are often buffeted by the very same forces that buffet headline measures. This fact motivated the development of the median and trimmed-mean inflation rates that remove extreme price changes regardless of their source (see Bryan and Cecchetti, 1994; and Bryan, Cecchetti, and Wiggins, 1997).3
What is somewhat less well-known is that the monthly cross-sectional distribution of component price changes is not symmetric and features notable skewness (see Dolmas, 2005, and Verbrugge and Zaman, 2021). There are several ways to measure skewness in a data distribution. Because extreme price changes distort conventional skewness statistics, we focus on two robust measures of skewness: the Bowley coefficient of skewness and the Kelly coefficient of skewness.4 Both measures are bounded between -1 and +1, with negative and positive estimates indicating left- and right-skew, respectively. Our skewness measure is the average of these two.
Figure 2 plots the one-sided 12-month moving average of monthly skewness for the period January 1978–December 2021, a timespan covering the entire history of the median PCE and trimmed-mean PCE inflation rates. As shown, the monthly distribution historically has been moderately left-skewed most of the time. The left-skew of the distribution principally reflects the behavior of goods prices that not only tend to increase at a slower pace compared with services prices, but also exhibit ongoing deflation in some components.5 Recently, however, the distribution has become right-skewed because of the pandemic’s effect on prices. Specifically, goods prices have exhibited large and sustained increases because of a combination of strong demand, bottlenecks, and supply chain disruptions, while some services prices have shown large increases as they rebound from the steep declines in demand resulting from lockdowns and social distancing.

In general, the presence of skewness in the price-change distribution has important implications. When a distribution is left-skewed, the mean lies below the median, and, hence, the median PCE inflation rate will be upward-biased with respect to its headline counterpart. For the same reason, a symmetric trimmed-mean inflation rate will be upward biased relative to the mean, with the degree of bias increasing in the amount of trimming.6 This upward bias motivates the asymmetric trimming used in the Dallas Fed’s trimmed-mean PCE inflation rate. Specifically, that measure trims 24 percent of the weight from the lower tail but 31 percent of the weight from the upper tail.7 Because the trimming removes more of the upper tail and retains more of the lower tail, this combination lowers the estimate. Dolmas (2009) demonstrates that this degree of asymmetric trimming historically has resulted in an unbiased estimate of headline PCE inflation over longer periods. This implicit bias adjustment in the trimmed-mean PCE inflation rate gives it an advantage relative to the median PCE inflation rate in “naïve” forecasting exercises in which inflation outcomes are simply compared to readings from the two measures.
The shift in the skewness of the cross-sectional price-change distribution from left (negative) skew to right (positive) skew during the pandemic has relevance for recent readings of median PCE inflation and trimmed-mean PCE inflation and their interpretation for movements in trend inflation. When the price-change distribution is right-skewed, a median or symmetric trimmed-mean will be downward biased with respect to the mean. Consequently, the median PCE inflation rate has now become a downward-biased estimate of the mean. Compared to the median PCE inflation rate, the Dallas Fed’s trimmed-mean PCE inflation rate currently suffers from more downward bias owing to its asymmetric trimming. This occurs because the current configuration of the price-change distribution would call for more trimming of the weight from the lower tail and less trimming of the weight from the upper tail.
Motivated by the previous discussion, we take a closer look at median and trimmed-mean estimators of trend inflation and the bias that can arise when the distribution of price changes is skewed. An issue of particular interest is the relationship between bias and skewness. If there is a significant correlation, then skewness can provide the basis for a bias-adjustment procedure to improve estimates of trend inflation. The bias-adjusted estimates could afford new insights into the historical behaviors of median PCE inflation and trimmed-mean PCE inflation and allow us to assess the extent to which these measures may be understating the trend in PCE inflation today.
Bias in Limited-Influence Estimators and Its Relationship with Skewness
As previously shown in Figure 1, median PCE and trimmed-mean PCE inflation rates can depart from headline PCE inflation for extended periods of time. We define the gap between monthly median PCE inflation and monthly headline PCE inflation as
The monthly gap of trimmed-mean PCE inflation, , is defined in an analogous manner. As explained above, the gap is related to the skewness of the cross-sectional price-change distribution. Because the two monthly gap series are very volatile, we are less interested in their month-to-month movements and more interested in their movements over longer periods of time. If longer-term movements in the gaps display persistence, then this feature of the data would indicate there is extended bias on the part of median PCE inflation and trimmed-mean PCE inflation. Consequently, we would like to develop a bias-adjustment procedure that allows each measure to provide a more useful real time signal of the current trend in headline inflation.
We use time-averages of gaps to measure bias in a given month , with the values calculated from a two-sided, centered moving average applied to the monthly gap series described above. Previous work has often used 36-month moving averages as a simple and practical method to capture persistent movements in inflation series (for example, Cecchetti,1997; Dolmas, 2005; or Verbrugge, 2021). However, averages can be very sensitive to outliers, so we trim out the highest and lowest observation over each 36-month period of observations to compute the average rather than using a simple 36-month average.8
Figure 3 plots the resulting estimates of bias for the period June 1986–May 2020.9 Bias clearly persists for extended periods of time, underscoring the desirability for some type of adjustment procedure. As described in Carroll and Verbrugge (2019), median PCE inflation typically has an upward bias because the price-change distribution is typically left-skewed. On the other hand, trimmed-mean PCE inflation is designed to minimize long-term bias, and this explains why the bias term for this measure fluctuates around zero over the entire period, although there are still extended departures of the series from this value.

Figure 4 provides a scatterplot of bias versus skewness for median PCE inflation and trimmed-mean PCE inflation for the period June 1986–May 2020. As shown, there is clear and compelling evidence of a negative relationship between bias and skewness for each limited-influence estimator, a finding that accords with our previous discussion.

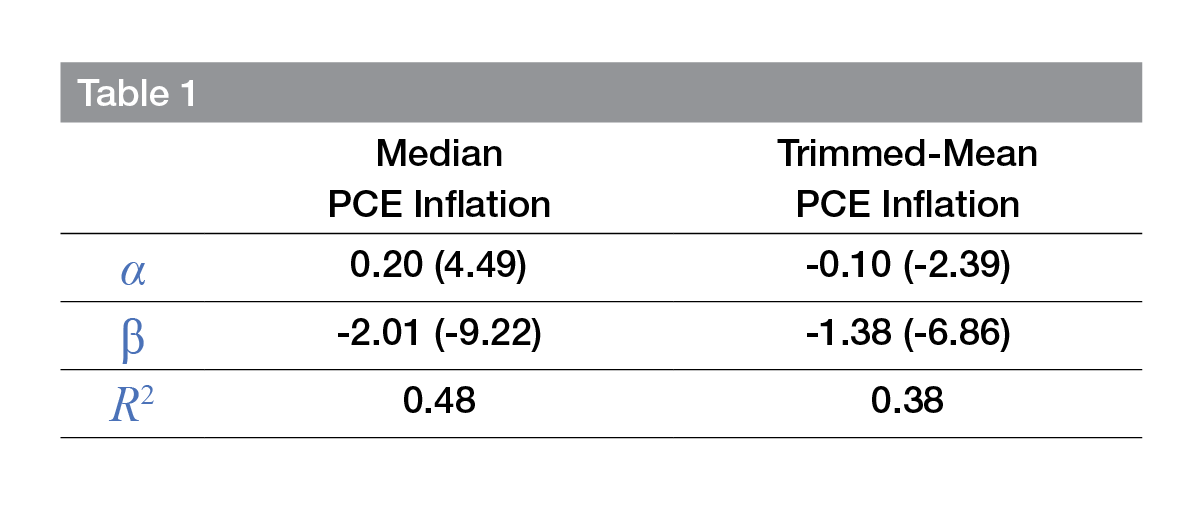
Drawing upon the visual evidence above, we use a simple linear regression to formalize the relationship between bias and skewness and to provide a basis to construct bias adjustment terms. We estimate the following regression for median PCE inflation:
where is the 12-month one-sided moving average of skewness depicted in Figure 2. The regression equation for trimmed-mean PCE inflation is specified in an analogous manner.
Table 1 reports the regression results for the period June 1986–May 2020, where t-statistics from robust standard error estimation are reported in parentheses.10 As shown, there is a highly statistically significant negative relationship between bias and skewness for both median PCE inflation and trimmed-mean PCE inflation. In addition, the R2 values indicate that skewness explains about 40 percent to 50 percent of the total variation in bias.
The coefficient estimates can now be used to bias-adjust either limited-influence estimator. For example, the bias-adjusted median PCE inflation measure is given by the following:
The corresponding bias-adjusted trimmed-mean PCE inflation measure can be derived in an analogous manner using the relevant coefficient estimates in Table 1.11
Figure 5 plots headline PCE inflation along with the unadjusted and bias-adjusted measures for median PCE inflation and trimmed-mean PCE inflation. Examining the data over the post-2000 period allows us to highlight three takeaways from the figure. First, median PCE inflation and trimmed-mean PCE inflation display very similar behavior after bias adjustment. Second, while bias adjustment shifts down median PCE inflation over almost the entire sample, there is also clear evidence of time variation in the bias adjustment for both median PCE inflation and trimmed-mean PCE inflation. This latter point is particularly evident during the long recovery from the Great Recession and especially between 2014 and 2017, when median PCE inflation and trimmed-mean PCE inflation are both shifted down because skewness was notably negative over this period. Third, the current pandemic period is associated with unusual inflation dynamics, wherein bias adjustments are driven by positive skewness (see Figure 2) and whose sources we discuss below. The magnitude of the recent upward adjustments to trimmed-mean PCE inflation is particularly noteworthy. Since April 2021, the average upward adjustment to trimmed-mean PCE inflation is +0.30 percentage points, while the average upward adjustment to median PCE inflation over this period is +0.08 percentage points. At the end of our sample in December 2021, our bias-adjustment procedure would boost the final reading of median PCE inflation by 14 basis points to 3.75 percent and would boost the final reading of trimmed-mean PCE inflation by 34 basis points to 3.39 percent.

A Closer Look at the Recent Change in Skewness: Goods versus Services
The positive bias adjustments that emerged earlier this year come directly from the shift in the cross-sectional price-change distribution from negative skewness to positive skewness. To help explain this change in skewness, Figure 6 plots the estimated skewness for headline PCE inflation and for inflation across goods and inflation across services. As in Figure 2, we plot these measures over the post-1977 period to establish the salient features of goods inflation versus services inflation.

Three observations are particularly noteworthy. First, the price-change distributions for both goods and services categories are contributing to the positive skewness in headline PCE inflation in the current period.12 Second, while positive skewness in services inflation is not an uncommon phenomenon, positive skewness in goods inflation is a rare occurrence. Third, although not depicted in Figure 6, the positive skewness in goods inflation is associated with another marked change in the behavior of goods inflation. Specifically, the pandemic period has witnessed strong positive inflation in the goods category, a shift which is a dramatic change from the outright declines in goods prices that have been generally observed in recent decades. Because goods inflation was typically negative and well below average inflation, components classified within the goods category had mostly tended to be in the left tail of the price-change distribution, helping to generate the left (negative) skew. After the onset of the pandemic, goods inflation has surged and reflects the notable shift in consumers’ spending patterns away from services and toward goods, along with the impact of bottlenecks and supply chain disruptions. This movement of goods inflation into the positive region of the price-change distribution suggests that goods components have moved weight from the left tail of the distribution into the right tail of the distribution, contributing to the right (positive) skew.
Conclusion
Median and trimmed-mean inflation rates remain popular estimators of trend inflation. While these estimators tend to move in line with the underlying trend in inflation over long periods, there can be deviations that persist over shorter episodes. This Commentary focuses on time-variation in this bias and presents evidence linking its movements to the degree of skewness in the distribution of price changes. We use the estimated relationship between bias and skewness to construct bias-adjusted median and trimmed-mean measures of inflation. We find median PCE inflation and trimmed-mean PCE inflation display very similar behavior after bias adjustment. In addition, the analysis makes note of a shift in the skewness of the cross-sectional price-change distribution during the pandemic and reports that readings from median and trimmed-mean inflation rates have recently been understating the trend in 12-month PCE inflation by about 15 basis points and 35 basis points, respectively.
Endnotes
- This view differs from the conventional core measure of inflation that associates temporary movements in inflation with the price changes of specific items, namely, food and energy. Return to 1
- We provide a practical method for real-time bias adjustment, responding to a need identified in Verbrugge (2021). While this Commentary focuses on PCE price inflation, there is a companion analysis for CPI inflation available in the appendices. As shown, we find and report similar results for median and trimmed-mean measures of CPI inflation, except that bias-adjustment is notably larger and currently ranges from 95 to 115 basis points. Return to 2
- Both theory and ex post tracking of trend inflation favor limited influence estimators over their core (excluding food and energy) counterpart (for example, Dolmas, 2005; Carroll and Verbrugge, 2019; and Verbrugge, 2021). Core PCE inflation provided a highly misleading inflation signal in early 2010 and has a bigger time-varying bias problem than median PCE inflation or trimmed-mean PCE inflation (Verbrugge, 2021). Return to 3
- These measures are weighted (that is, they reflect PCE aggregation weights) and are defined in the appendices. Return to 4
- Various studies (for example, Clark, 2004) have attributed the deflation in goods prices to the appreciation of the US exchange rate and the increase in global competition, among other factors such as the Baumol effect. Return to 5
- The Cleveland Fed’s trimmed-mean CPI inflation rate is an example of a symmetric trimmed mean because this measure removes 8 percent from the top tail and 8 percent from the bottom tail. Return to 6
- Trimming proportions are determined based on ex post tracking of various “longer-run averages” of inflation and on forecast accuracy evaluation. Prior to revision in 2009, the trimmed-mean PCE inflation rate trimmed 19.4 percent of the lower tail and 25.4 percent of the upper tail. Mertens (2016) finds that the trimmed-mean PCE inflation rate is a particularly reliable signal of the trend in PCE inflation. Return to 7
- Higgins and Verbrugge (2014) call attention to this problem and offer a more sophisticated solution. Return to 8
- Our statistical analysis spans the January 1985–December 2021 period. We begin our analysis in the mid-1980s to account for a change in the inflation process around that time. Because we consider a 36-month centered window of data, our bias estimates begin 18 months after January 1985 and end 18 months before December 2021. Return to 9
- We use heteroscedasticity and autocorrelation consistent standard error estimates with 3 lags. Return to 10
- As an alternative approach, we constructed a monthly gap series as the difference between 12-month median PCE (trimmed-mean PCE) inflation and a 36-month two-sided moving average of monthly headline PCE inflation. This approach resulted in very similar bias adjustments for median PCE inflation; however, the bias adjustments for trimmed-mean PCE inflation were somewhat less accurate when assessed on an ex post basis. Return to 11
- Overall skewness is not the sum of goods skewness and services skewness. Figure 6 nonetheless provides useful information about the drivers of overall skewness. Return to 12
References
- Bryan, Michael F., and Stephen G. Cecchetti. 1994. “Measuring Core Inflation.” In Monetary Policy, edited by N. Gregory Mankiw, 195–219. University of Chicago Press. https://www.nber.org/books-and-chapters/monetary-policy/measuring-core-inflation.
- Bryan, Michael F., Stephen G. Cecchetti, and Rodney L. Wiggins II. 1997. “Efficient Inflation Estimation.” Working paper 6183. National Bureau of Economic Research. https://doi.org/10.3386/w6183.
- Carroll, Daniel R., and Randal J. Verbrugge. 2019. “Behavior of a New Median PCE Measure: A Tale of Tails.” Economic Commentary (Federal Reserve Bank of Cleveland), no. 2019-10 (July): 1–7. https://doi.org/10.26509/frbc-ec-201910.
- Cecchetti, Stephen G. 1997. “Measuring Short-Run Inflation for Central Bankers.” Review (Federal Reserve Bank of St. Louis) 79 (3): 143–56. https://doi.org/10.20955/r.79.143-156.
- Clark, Todd E. 2004. “An Evaluation of the Decline in Goods Inflation.” Economic Review 89 (Q II): 19–51. https://ideas.repec.org/a/fip/fedker/y2004iqiip19-51nv.89no.2.html.
- Dolmas, Jim. 2005. “Trimmed Mean PCE Inflation.” Working paper 0506. Working Papers. Federal Reserve Bank of Dallas. https://ideas.repec.org/p/fip/feddwp/05-06.html.
- ———. 2009. “The 2009 Revision to the Trimmed Mean PCE Inflation Series.” Technical note. Federal Reserve Bank of Dallas. https://www.dallasfed.org/-/media/Documents/research/pce/tech.pdf?la=en.
- Higgins, Amy, and Randal J. Verbrugge. 2015. “Tracking Trend Inflation: Nonseasonally Adjusted Variants of the Median and Trimmed-Mean CPI.” Working paper 15-27. Federal Reserve Bank of Cleveland. https://doi.org/10.26509/frbc-wp-201527.
- Mertens, Elmar. 2016. “Measuring the Level and Uncertainty of Trend Inflation.” Review of Economics and Statistics 98 (5): 950–67. https://doi.org/10.1162/REST_a_00549.
- Rich, Robert W., and Charles Steindel. 2007. “A Comparison of Measures of Core Inflation.” Economic Policy Review 13 (Dec): 19–38. https://ideas.repec.org/a/fip/fednep/y2007idecp19-38nv.13no.3.html.
- Verbrugge, Randal J. 2021. “Is It Time to Reassess the Focal Role of Core PCE Inflation?” Working paper 21-10. Federal Reserve Bank of Cleveland. https://doi.org/10.26509/frbc-wp-202110.
- Verbrugge, Randal J., and Saeed Zaman. 2021. “Improving Inflation Forecasts Using Robust Measures” Manuscript. Federal Reserve Bank of Cleveland.
Suggested Citation
Rich, Robert W., Randal J. Verbrugge, and Saeed Zaman. 2022. “Adjusting Median and Trimmed-Mean Inflation Rates for Bias Based on Skewness.” Federal Reserve Bank of Cleveland, Economic Commentary 2022-05. https://doi.org/10.26509/frbc-ec-202205
This work by Federal Reserve Bank of Cleveland is licensed under Creative Commons Attribution-NonCommercial 4.0 International

