

- Share
Digging into the Downward Trend in Consumer Inflation Expectations
Since mid-2014, the long-run inflation expectations of consumers have been declining. We analyze University of Michigan Surveys of Consumers microdata and find that a decline in uncertainty about future inflation is a modest part of the story over this period—but it represents the entire story when considering changes in expectations since 2012.

The views authors express in Economic Commentary are theirs and not necessarily those of the Federal Reserve Bank of Cleveland or the Board of Governors of the Federal Reserve System. The series editor is Tasia Hane. This paper and its data are subject to revision; please visit clevelandfed.org for updates.
The long-run inflation expectations of consumers, as measured by the University of Michigan Surveys of Consumers (“UM survey”), have been on a steady downward trend since the third quarter of 2014.1 The downward movement is attracting attention because expected inflation is at the center of the macroeconomic theory used by central banks around the world, and it is also an important input into many macroeconomic forecasting models. Anchored or stable long-term inflation expectations are important for promoting short-run inflation stability and for facilitating central bank efforts to achieve output stability, and are often suggested as an explanation of the “missing disinflation” puzzle.2,3
The decline in expectations began at about the same time as a sharp drop in gasoline prices, and many have drawn a connection between these movements. But we find that explanation incomplete at best and consider whether a decline in inflation uncertainty is also playing a role. Answering this question involves looking at the individual responses of consumers in the UM survey and making a few calculations: First, following Binder (2016a), we deduce the probability that each respondent is highly uncertain; we then estimate overall uncertainty, and sort respondents into two groups, highly uncertain or not highly uncertain. Second, we calculate the inflation forecasts of each group over time, and third, we estimate the separate contributions of each group’s forecast and that of uncertainty to the overall inflation forecast.
We find that uncertainty has declined since 2014, and this decline can explain part of the drop in inflation expectations since then. However, we also find that uncertainty has actually been falling since 2012; but in between then and now, inflation forecasts of both groups rose and then fell back. Our decomposition indicates that from 2012:H1 to 2014:H1, the effect of declining uncertainty—which by itself reduces inflation expectations—was more than offset by an increase in the inflation expectations of both types of consumer. Since each group’s expectations are back to where they were in 2012, the entire drop in average expectations since 2012 is explained by a decline in uncertainty.
Blame Oil?
The downward trend in the long-run inflation expectations of consumers appears to start at more or less the same time as a sharp fall-off in oil and gasoline prices in the summer of 2014, as shown in figure 1.4 In June of 2014, the average price of a gallon of gasoline in the United States was $3.78, but by January 2015 it had fallen to $2.13. Median longer-run inflation expectations were 2.9 percent in July 2014, but have been hovering near 2.6 percent since October 2015.
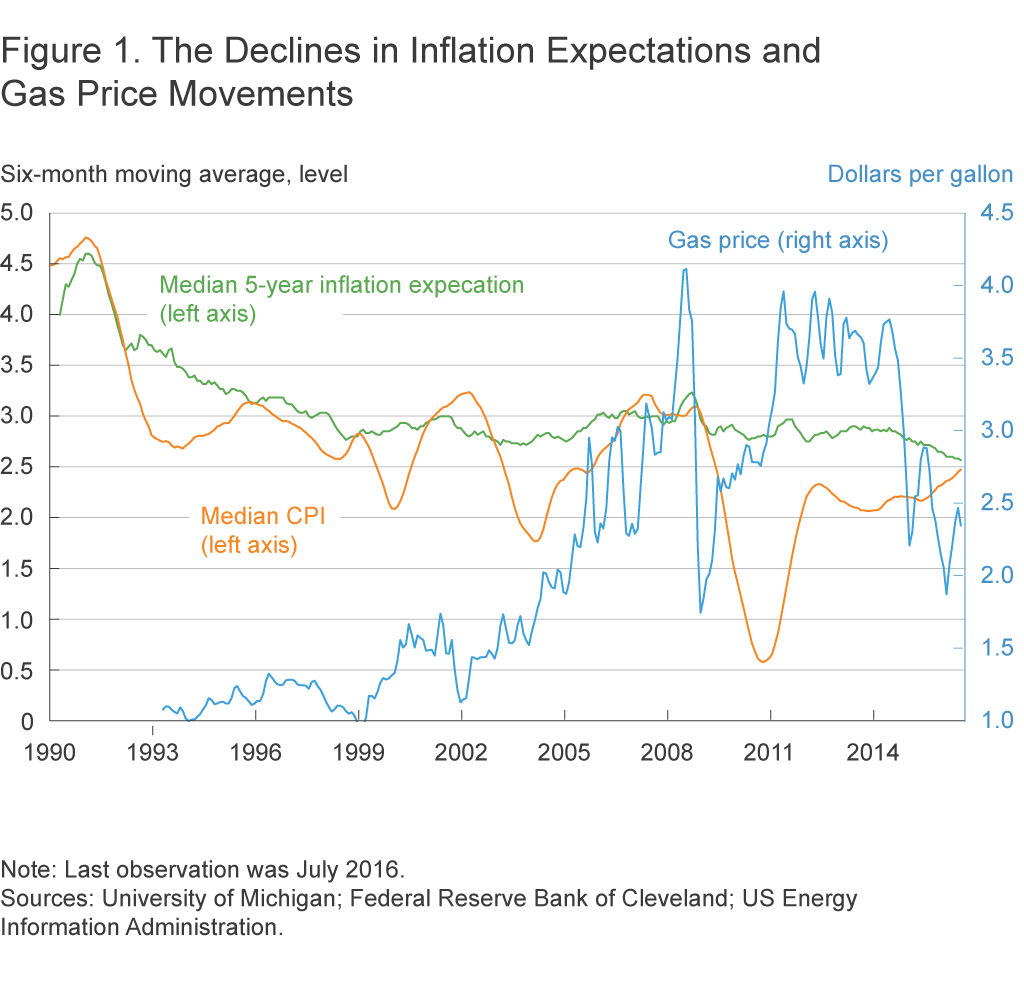
Many economists believe that these two variables are closely related. Historically, there is some evidence that increases (or decreases) in gasoline prices have been associated with increases (or decreases) in consumers’ inflation expectations. Higgins and Verbrugge (2015) and others5 find that long-run consumer inflation expectations are meaningfully influenced by large gasoline price movements.6 Coibion and Gorodnichenko (2015) assert that consumers’ one-year-ahead inflation expectations exhibit a “strong sensitivity” to the level of oil prices. These findings suggest that the decline in gasoline prices may be a key driver behind the decline in consumers’ long-run inflation expectations over the last two years.
However, assigning too much blame to gasoline prices seems premature, for two reasons. First, the strength of the correlation between gasoline prices and long-run expectations has historically been low. Regression coefficients imply that, on average, a gasoline price change of 10 percent in one month has historically only increased median inflation expectations by 0.03 percentage points. Putting this differently, a gasoline price movement of 42 percent—a number that is close to the cumulative change in gasoline prices experienced over the recent period—will, on average, shift inflation expectations by a mere 0.12 percent.7 In that sense, gasoline prices can explain only about one-third of the decline in longer-run inflation expectations over this period. Other evidence suggests there are many influences on inflation expectations, which often dominate the influence of gasoline.8
Second, while gasoline prices fell a lot over this period, they also exhibited two upward surges, and neither appeared to boost inflation expectations.9
Blame a Reduction in Inflation Uncertainty?
To shed some further light on long-run inflation expectations, we dig into the UM survey microdata, the inflation forecasts given by individual respondents each month. Studying these responses allows us to construct a measure of inflation forecast uncertainty.
In the UM survey, individual consumers’ forecasts of inflation are reported in integers. There is substantial heterogeneity in these forecasts. Some consumers report forecasts reasonably close to the Federal Open Market Committee’s 2 percent target, while others report seemingly extreme forecasts, like 15 percent inflation over the longer run.10
We first look at the “popularity” of various integer responses appearing in the survey, and the degree to which the popularity of various responses has changed over time. We compare three periods: an earlier period (1998−2012:H1), an intermediate six-month period (2014:H1), and the most recent six-month period (2016:M2−M7). The 2014:H1 time period was selected as a focus, and as the appropriate comparison to the most recent period, because expected inflation began to decline in July 2014. For the earlier period, we opted to include only data through 2012:H1 because after this point, uncertainty started falling and in 2013:H1, the expectations of each group started to rise. The popularity-of-response information is depicted in figure 2, which plots three histograms, each one a “snapshot” representing the distribution of responses during each of the three periods.
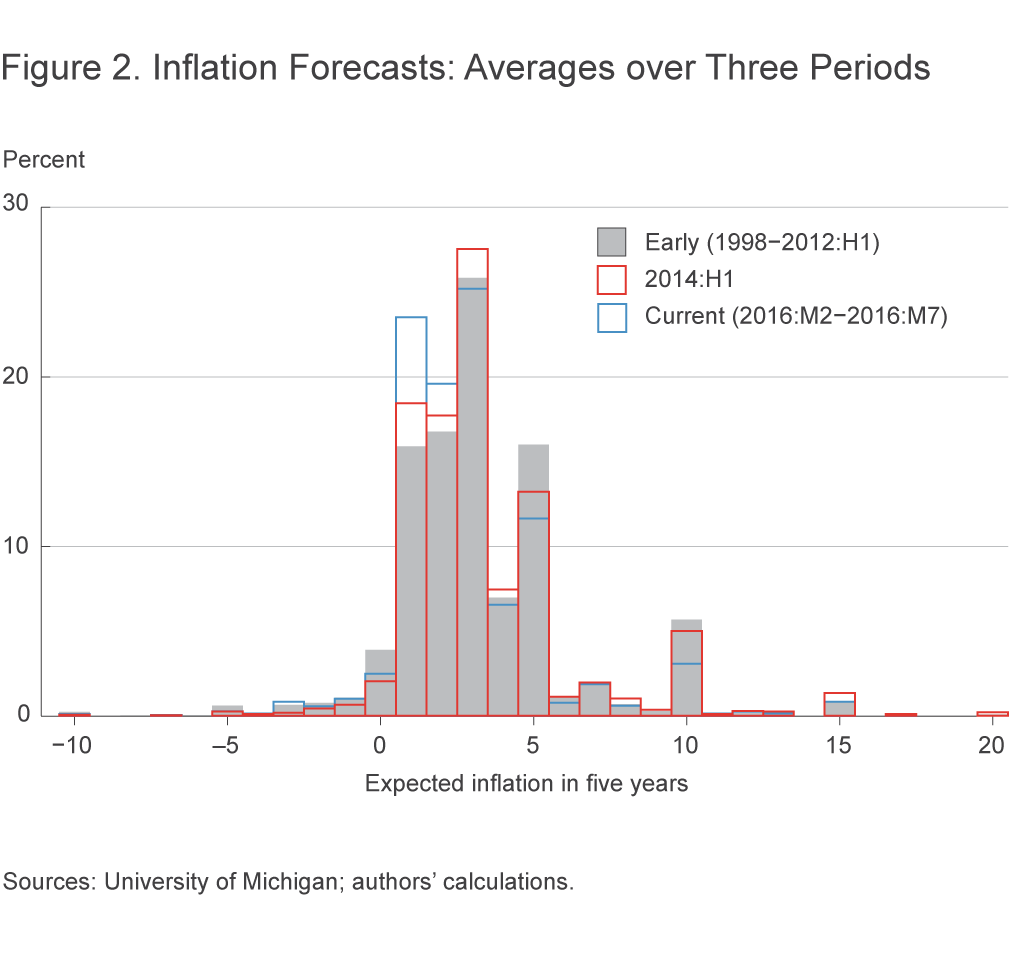
The histogram for the 1998−2012:H1 period shows a high degree of dispersion in expected inflation, with some respondents reporting very low inflation forecasts such as −3 percent, and others reporting very high forecasts such as 15 percent. A key feature of the histogram is the “heaping” of respondents at multiples of 5 percent. For example, about 16 percent of all survey respondents chose 5 percent as their inflation forecast during this period; by contrast, only about 7 percent of respondents chose a forecast of 4 percent, and 2 percent chose a forecast of 6 percent. Looking at the entire histogram, it is clear that 5 percent, 10 percent, 15 percent, and −5 percent stick out as “unusually high” compared to adjacent numbers.
These histograms give us one lens through which to view the evolution of individual consumers’ inflation forecasts. As one moves from the early period to the 2014:H1 period, the most notable changes in the pattern of responses are that both the 0 percent and 5 percent responses become less common, and the 1 percent, 2 percent, and 3 percent responses become more common. Moving from the 2014:H1 period to the current period, the most notable changes are that the 1 percent and 2 percent responses become more common, while the 3 percent, 4 percent, 5 percent, and 10 percent responses become less common. Of these, the most striking change is the increase in the popularity of the 1 percent response (from 18 percent in 2014:H1 to 24 percent in the last six months).11
What can we make of the unusual “heaping” pattern of responses and of these shifts? Binder (2016a) posits that there is a connection between a multiple-of-five response and the respondent’s level of uncertainty. In particular, survey respondents have a tendency to report “round number” responses when they are very uncertain. This tendency is documented over a variety of contexts in the cognition, communication, and finance literatures. In the UM survey data, the nature and prevalence of responses like 5 or 10 indicate that these are “round number” responses, and Binder (2016a) applies this insight to construct a monthly inflation uncertainty index based upon the pattern of such responses.12 Roughly speaking, the overall level of inflation uncertainty corresponds to the percentage of respondents who are highly uncertain, i.e., the percentage of respondents who report a round number.13 Notice that since most highly uncertain responses are 5 percent or above, high uncertainty tends to be correlated with high inflation expectations.
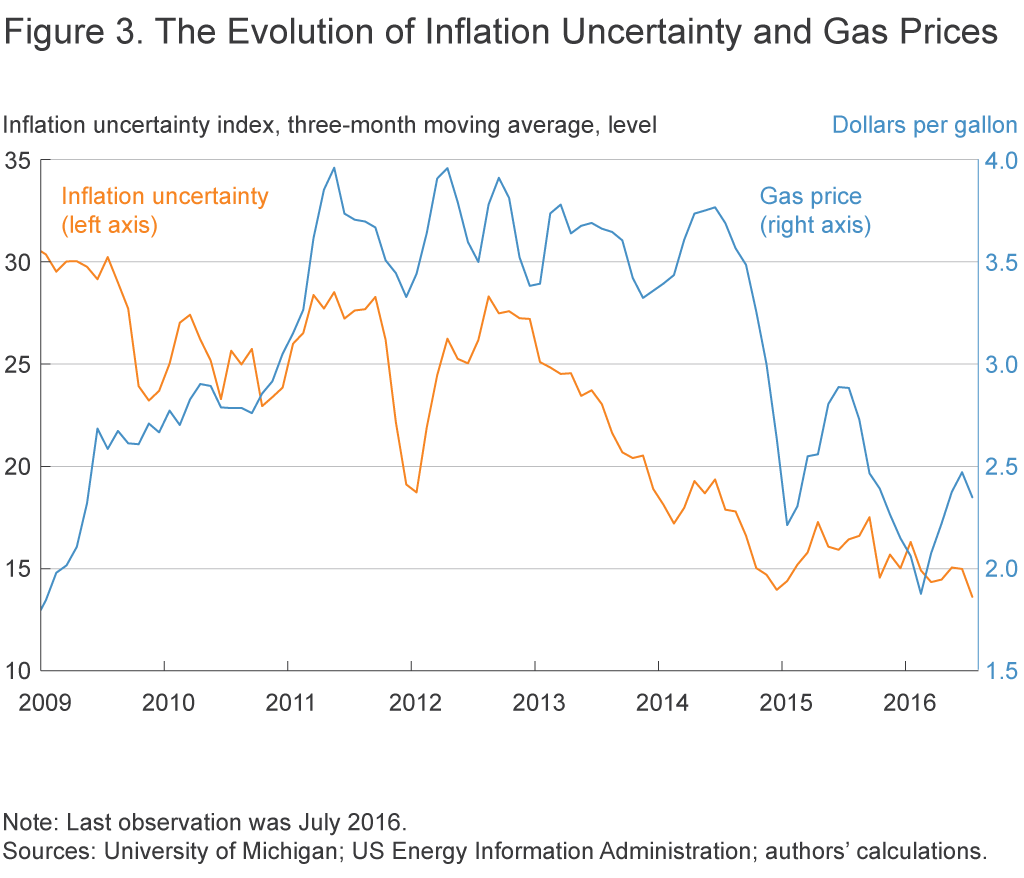
Figure 3 plots the evolution of the uncertainty index over time, along with gasoline prices. In contrast to the histograms in figure 3, the uncertainty index is a monthly measure, whose timeliness allows us to detect turning points and trends in the level of uncertainty. Figure 3 indicates that a steady decline in uncertainty began shortly after 2012:H1, several years prior to the large decline in gasoline prices. The decline in long-run inflation uncertainty may partly reflect improvement in general macroeconomic conditions, since this uncertainty measure (in keeping with other uncertainty measures14) is generally countercyclical. A distinct decline in longer-run inflation uncertainty begins not long after the FOMC’s January 2012 announcement of an explicit 2 percent target for PCE inflation. It is conceivable that this communication could have contributed to a stronger anchoring of expectations around the target, reducing longer-run inflation uncertainty, though causality would be difficult to demonstrate.15
Can changes in inflation uncertainty help explain the recent downward trend in long-run inflation expectations? This certainly seems plausible. As noted above, highly uncertain responses are often very high responses, generally much higher than accurate forecasts. Hence, when long-run inflation uncertainty declines, the average inflation expectation tends to fall.
However, the reduction in uncertainty cannot fully explain the post–mid-2014 decline in inflation expectations either. The larger part of the decline in inflation uncertainty actually predates this recent decline in inflation expectations. Inflation uncertainty fell substantially after 2012:H1 but has only dropped modestly since 2014:H1. Indeed, the fact that inflation uncertainty and inflation expectations are correlated immediately brings another question to the fore: Why didn’t inflation expectations decline over the earlier period (2012:H2−2014:H1) when inflation uncertainty was steadily falling?
Inflation Expectations by Type
To help answer these questions, we split respondents into two groups, or types of respondents. For each month, we use the tools in Binder (2016a) to partition the UM survey sample into the highly uncertain respondents and the less uncertain respondents, and we compute the average inflation forecast of each type.16 The evolution of these two inflation forecasts enables us to distinguish the effect of declining uncertainty per se—the effect of a reduction in the percentage of highly uncertain consumers in the population—from changes in the actual inflation forecasts of the members of each type. We plot 3-month moving averages of these two variables in figure 4, along with vertical lines denoting January 2012 (FOMC announcement of the 2 percent target) and July 2014 (onset of decline in average inflation expectations).
As one might expect, the inflation expectations of the highly uncertain type are quite volatile: Month-to-month changes are large, as are the sweeping trends that occur over a period of several years. By contrast, the inflation expectations of the less uncertain consumers are far more stable.17 Figure 4 shows that the reason inflation expectations didn’t fall when uncertainty fell between July 2012 and June 2014 was that the effect of the decline in uncertainty was more than offset by an increase in the inflation expectations of both types.
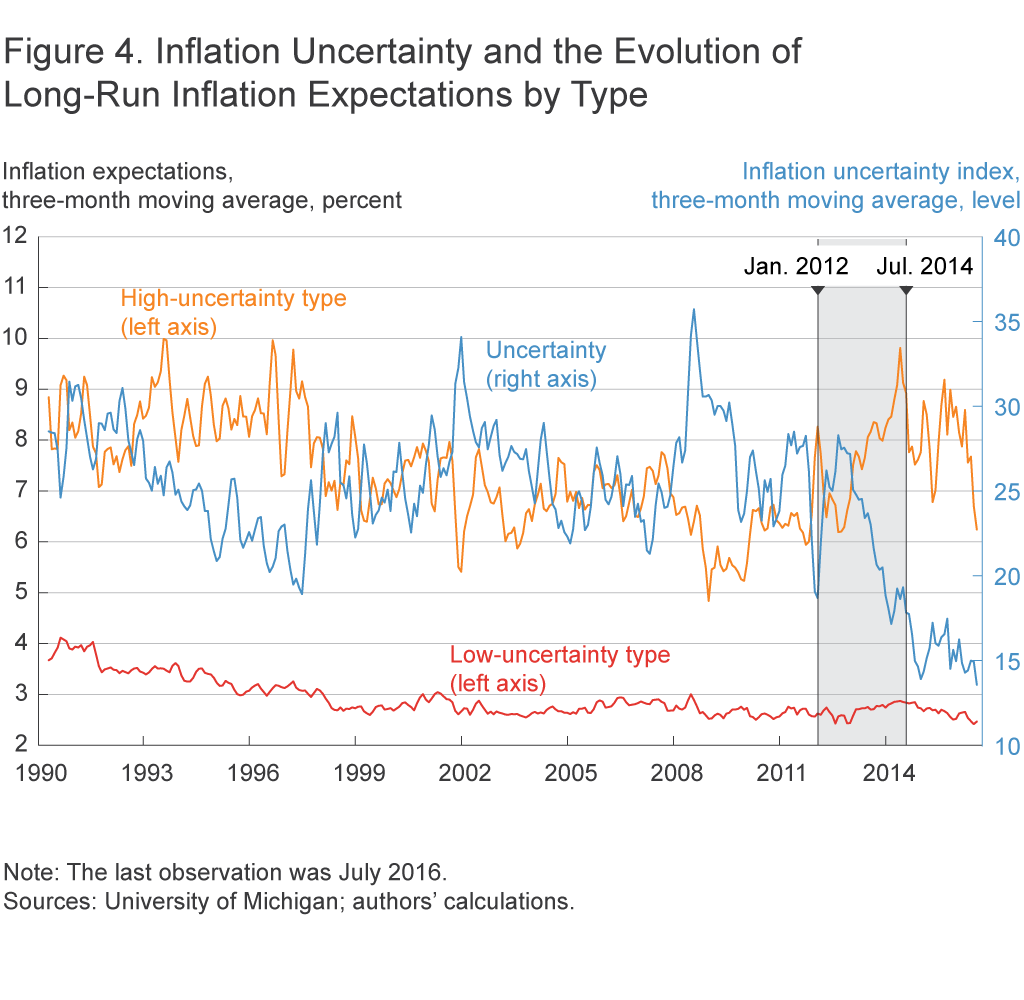
Figure 4 also suggests an explanation for the recent decline in inflation expectations. The expectations of both types of respondent have fallen since mid-2014, but the sharper falloff for the highly uncertain is not unusual and the current forecast is well within historic norms. In contrast, the downward trend in inflation expectations of the less uncertain is more difficult to dismiss as noise: If we look at two-year windows since 2000, the changes witnessed over this period are in the 85th percentile in terms of magnitude. Still, those expectations are back to where they were in 2012.
We can mathematically decompose the drop in the average inflation forecast into three parts: the parts due to the reduction in the expectations of each type of respondent, and the part due to a shift in the relative proportion of the two types (i.e., the part due to the decline in uncertainty).18 Since the first half of 2014, the average long-run forecast across all consumers fell by 0.62 percentage point (ppt.)19 The average forecast of the highly uncertain type fell by about 2 ppt., but the contribution of this change to the overall average forecast was only −0.18 ppt., owing to the small (8.15 percent) average proportion of the highly uncertain over this time period. The average forecast of the less uncertain fell by 0.35 ppt., and the contribution of this change in forecasts to the overall average forecast was −0.32 ppt. The remainder, −0.14 ppt., is due to a reduction in uncertainty over this period.20 Thus, this decomposition suggests that just over half of the recent decline in long-run inflation expectations is attributable to declining inflation expectations among less uncertain consumers, while slightly less than one-quarter of the decline resulted from the reduction in uncertainty over this period.
However, suppose we ask a different question. Since the latter part of 2012, average longer-run inflation expectations have dropped by 0.34 percentage points.21 What explains this change? The answer: Nearly all of this change results from a decline in uncertainty. This follows from the fact that the inflation forecasts of both types of consumer are, roughly speaking, back to where they were in 2012:H2. (The forecasts of the high-uncertainty type are essentially the same as in 2012:H2, while the forecasts of the low-uncertainty type have risen only slightly.) Hence, the 0.34 ppt. decline in the average forecast since 2012 must derive almost entirely from a change in the relative proportion of types, namely the decline in the proportion of highly uncertain consumers in the economy.22
Conclusion
Consumer inflation expectations have recently declined. While many analysts blame oil, we note that this explanation falls short. A decline in inflation uncertainty can also potentially explain a drop in average inflation expectations. Highly uncertain consumers have historically reported relatively high round-number inflation forecasts, so a decline in the proportion of highly uncertain respondents tends to reduce average forecasts.
We find evidence of a significant drop in inflation uncertainty since 2012. But because the level of inflation uncertainty has not declined very much since mid-2014, the change in uncertainty cannot explain much of the decline in inflation expectations since that time.
However, we gain considerable insight by comparing the actual average inflation expectations of highly uncertain consumers with those of less uncertain consumers. We observe that the inflation expectations of both types have declined, but the expectations of both types are presently at levels comparable to those in early 2012. From this fact, we are able to conclude that the 0.34 ppt. drop in average consumer long-run inflation expectations since 2012 derives entirely from a decline in the proportion of highly uncertain consumers. Putting this differently, the drop in the longer-run inflation expectations of consumers since 2012 derives entirely from a decline in their uncertainty about future inflation.
Footnotes
- For more detail about the UM survey, see Binder (2016a). Return to 1
- See, e.g., Bernanke 2010, Simon et al. 2013, or Ball and Mazumder 2014. Return to 2
- Alternative measures of inflation expectations, such as the Federal Reserve Bank of Philadelphia’s Survey of Professional Forecasters and the Federal Reserve Bank of Cleveland’s inflation expectations measure, reflect the expectations of professional forecasters and financial market participants. Conversely, the UM survey reflects the expectations of households, thought to be an important driver of inflation dynamics (see, e.g., Coibion and Gorodnichenko 2015). Return to 3
- Formal statistical tests, such as the Quandt-Andrews (Andrews 1993) or Andrews-Ploberger (Andrews and Ploberger 1994) tests, identify the oil-price break in August 2014 but identify an inflation-expectations break several months earlier. Still, the eyeball metric suggests that inflation expectations did not decline in earnest until about the same time. Return to 4
- Trehan (2011) and Neely (2015) also find that inflation expectations are highly responsive to energy prices. Return to 5
- Cao and Shapiro (2016) argue that the decline in energy prices can explain about three-fourths of the 0.2 ppt. decline in professional 10-year inflation forecasts over the past five years. Return to 6
- Indeed, Higgins and Verbrugge (2015) note that the quantitative influence of energy prices on inflation expectations is “generally quite modest.” The estimated size of the expectation responses in that study are very close to those above. Binder (2016b) uses both reduced-form and structural methods to study the influence of gasoline prices on consumer inflation expectations. That study concludes that consumers do not overweight gas-price changes in their perception of overall inflation, and that movements in gasoline prices have a moderate effect on short-run inflation expectations, which rapidly declines with forecast horizon; consumers evidently believe that gas prices are mean-reverting. The effect on 5-to-10-year inflation expectations is almost negligible. Return to 7
- A number of other factors are believed to influence inflation expectations, such as demographic characteristics (see, e.g., Souleles 2004), education and economic literacy (see, e.g., Bruine de Bruin et al. 2010 or Meyer and Venkatu 2011), the actual inflation experiences of consumers (see, e.g., Malmendier and Nagel 2016), consumer attitudes (see, e.g., Ehrmann et al. 2015), and media exposure (see, e.g., Carroll 2003). Return to 8
- Another reason that the recent downward trend in inflation expectations may be puzzling is that, since the beginning of 2015, one measure of the trend in inflation—based on the median CPI—has been increasing (see figure 1), and historically, median CPI inflation has been positively correlated with long-run inflation expectations. The median CPI is one of the best available estimates of trend inflation, outperforming so-called “core” inflation measures on both theoretical and empirical grounds. See, e.g., Bryan and Cecchetti (1994), Smith (2004), Meyer et al. (2013), or Higgins and Verbrugge (2015b). Return to 9
- Some of the dispersion in inflation forecasts may reflect similar dispersion in the inflation experiences of households; see Kaplan and Schulhofer-Wohl (2016). Below, we discuss another interpretation of extreme forecasts. Return to 10
- The popularity of the 1 percent response (and, to a lesser extent, the 2 percent response) has grown steadily since 2009. Return to 11
- Consumer expected inflation uncertainty is often estimated using the interquartile range of survey responses. But the interquartile range is more properly associated with consumer disagreement—dispersion of beliefs across consumers—rather than uncertainty—how confident a person is that her forecast is correct. See Orlik and Veldkamp (2012) for some related discussion. Return to 12
- This is not the whole story, since some of those respondents are not uncertain at all but just happen to report such a number. Fortunately, statistical procedures allow one to estimate the probability that any given respondent is relatively uncertain or uninformed, given the entire distribution of responses in a given month. For details, see Binder (2016a). For updated data on Binder’s inflation uncertainty index, see https://sites.google.com/site/inflationuncertainty/. Return to 13
- See, for example, Baker, Bloom, and Davis (2015). Return to 14
- For a broader look at the effectiveness of Federal Reserve communication with the public at large, see Binder (2016c). Return to 15
- In the UM survey, each month approximately 40 percent of the respondents have been surveyed once previously, six months ago, while the remaining respondents are being given the survey for the first time. As survey participants are selected randomly from the population, the fraction of highly uncertain respondents in the sample will approximate the fraction of highly uncertain consumers in the population at large. Return to 16
- It turns out that these expectations are also more reliably related to future inflation; see Binder (2015). Return to 17
- See the online appendix for an explanation of how we did this decomposition. Return to 18
- In our mathematical decompositions, we focus on average inflation expectations for simplicity. To ensure that our results are not influenced by noise in the sample, we compute changes in six-month averages. Return to 19
- Shares do not add exactly to 0.62 due to rounding. Return to 20
- Over this period, median longer-run inflation expectations dropped by 0.2 percentage points. Return to 21
- More specifically, changes in the expectations of highly uncertain respondents contributed +0.04 ppt. to the decline, while changes in the expectations of the less uncertain respondents contributed −0.01 ppt. Thus, changes in uncertainty contributed −0.37 ppt. Return to 22
References
- Andrews, Donald, W.K., 1993. “Tests for Parameter Instability and Structural Change with Unknown Change Point,” Econometrica, 61:4, 821−856.
- Andrews, Donald, W.K., and Werner Ploberger, 1994. “Optimal Tests When a Nuisance Parameter Is Present Only under the Alternative,” Econometrica, 62:6, 1383−1414.
- Baker, Scott, Nicholas Bloom, and Steven J. Davis, 2015. “Measuring Economic Policy Uncertainty,” NBER Working Paper no. 21633.
- Ball, Laurence, and Sandeep Mazumder, 2014. “A Phillips Curve with Anchored Expectations and Short-Term Unemployment,” NBER Working Paper no. 20175.
- Bernanke, Ben, 2010. “The Economic Outlook and Monetary Policy,” speech delivered at the Federal Reserve Bank of Kansas City Economic Symposium.
- Binder, Carola Conces, 2015. “Whose Expectations Augment the Phillips Curve?” Economics Letters, 136, 35−38.
- Binder, Carola Conces, 2016a. “Measuring Uncertainty Based on Rounding: New Method and Application to Inflation Expectations,” unpublished manuscript, Haverford College.
- Binder, Carola Conces, 2016b, “Inflation Expectations and the Price at the Pump,” unpublished manuscript, Haverford College.
- Binder, Carola Conces, 2016c. “Fed Speak on Main Street,” unpublished manuscript, Haverford College.
- Bruine de Bruin, Wändi, Wilbert van der Klaauw, Julie S. Downs, Baruch Fischhoff, Giorgio Topa, and Olivier Armentier, 2010. “Expectations of Inflation: The Role of Demographic Variables, Expectation Formation, and Financial Literacy,” The Journal of Consumer Affairs, 44:2, 381−402.
- Bryan, Michael F., and Stephen G. Cecchetti, 1994. “Measuring Core Inflation,” in Monetary Policy, N. Gregory Mankiw, ed., University of Chicago Press, 195−215.
- Cao, Yifan, and Adam Hale Shapiro, 2016. “Energy’s Impact on Inflation Expectations,” Federal Reserve Bank of San Francisco, Economic Letter, 2016−19.
- Carroll, Christopher D., 2003. “Macroeconomic Expectations of Households and Professional Forecasters,” The Quarterly Journal of Economics, 118:1, 269−298.
- Coibion, Olivier, and Yuriy Gorodnichenko, 2015. “Is the Phillips Curve Alive and Well After All? Inflation Expectations and the Missing Disinflation,” American Economic Journal: Macroeconomics, vol. 7, 197−232.
- Ehrmann, Michael, Damjan Pfajfar, and Emiliano Santoro, 2015. “Consumers’ Attitudes and Their Inflation Expectations.” Board of Governors of the Federal Reserve System, Finance and Economics Discussion Series 2015-015.
- Higgins, Amy, and Randal Verbrugge, 2015. “Do Energy Prices Drive the Long-Term Inflation Expectations of Households?” Federal Reserve Bank of Cleveland, Economic Trends.
- Higgins, Amy, and Randal Verbrugge, 2015b. “Tracking Trend Inflation: Nonseasonally Adjusted Variants of the Median and Trimmed-Mean CPI,” Federal Reserve Bank of Cleveland, Working Paper no. 15−27.
- Kaplan, Greg, and Sam Schulhofer-Wohl, 2016. “Inflation at the Household Level,” Federal Reserve Bank of Minneapolis, Working Paper no. 731.
- Malmendier, Ulrike, and Stefan Nagel, 2016. “Learning from Inflation Experiences,” The Quarterly Journal of Economics, 131(1), 53−87.
- Meyer, Brent, and Guhan Venkatu, 2011. “Demographic Differences in Inflation Expectations: What Do They Really Mean?” Federal Reserve Bank of Cleveland, Economic Commentary, 2011-07.
- Meyer, Brent, Guhan Venkatu, and Saeed Zaman, 2013. “Forecasting Inflation? Target the Middle,” Federal Reserve Bank of Cleveland, Economic Commentary, 2013-05.
- Orlik, Anna, and Laura Veldkamp, 2012. “Understanding Uncertainty Shocks,” Economics Dynamics Meeting Paper, vol. 391.
- Simon, John, Troy Matheson, and Damiano Sandri, 2013. “The Dog That Didn’t Bark: Has Inflation Been Muzzled or Was It Just Sleeping?” International Monetary Fund, World Economic Outlook.
- Smith, Julie K., 2004. “Weighted Median Inflation: Is This Core Inflation?” Journal of Money, Credit, and Banking, 36(2), 253−263.
- Souleles, Nicholas S., 2004. “Expectations, Heterogeneous Forecast Errors, and Consumption: Micro Evidence from the Michigan Consumer Sentiment Surveys,” Journal of Money, Credit, and Banking, 36(1), 39−72.
Suggested Citation
Verbrugge, Randal J., and Carola Conces Binder. 2016. “Digging into the Downward Trend in Consumer Inflation Expectations.” Federal Reserve Bank of Cleveland, Economic Commentary 2016-11. https://doi.org/10.26509/frbc-ec-201611
This work by Federal Reserve Bank of Cleveland is licensed under Creative Commons Attribution-NonCommercial 4.0 International

