

- Share
Trends in Expenditures by US Colleges and Universities, 1987-2013
This Economic Commentary studies trends in spending by US colleges and universities in broad expenditure categories between 1987 and 2013. The results reveal that spending per student has risen in most major spending categories. This is true for both public institutions and private institutions. However, spending has risen more dramatically in some categories than others. For example, research is one category that has witnessed among the highest spending growth, and in percentage terms, there has also been a large increase in student services spending.
The views authors express in Economic Commentary are theirs and not necessarily those of the Federal Reserve Bank of Cleveland or the Board of Governors of the Federal Reserve System. The series editor is Tasia Hane. This paper and its data are subject to revision; please visit clevelandfed.org for updates.
Why have college costs been rising in recent years? One set of explanations is related to questionable spending on amenities for students, salaries for administrators, or other expenditures that are outside the traditional teaching andresearch focus of colleges and universities. Other explanations are related to economy-wide forces that the higher education industry has little direct influence over. For example, higher education may be an industry that is impacted by Baumol’s cost disease. Under this idea, productivity improvements in some sectors of the economy lead to higher wages in those sectors. But then other sectors will also need to raise wages in order to compete for workers, even if these other sectors—and higher education may be one example—do not experience productivity improvements of their own.
An earlier Economic Commentary (Hinrichs 2016) studied the employment mix in higher education. That piece found that the proportion of college faculty who are full-time employees has declined over time and that, contrary to popular belief, there has not been a large change in the share of employees who hold administrative positions. These employment results may provide some insight into changes in spending by higher education institutions, but they do not provide the complete picture. First, not all spending by colleges is paid out to employees. Second, there may be changes in wages or salaries for employees that impact the overall wage bill for colleges but are not reflected in employment counts.
This Economic Commentary studies trends in spending by US colleges and universities in broad expenditure categories between 1987 and 2013. Although this exercise does not provide a complete answer to the question of why the cost of college has been rising, it may help in identifying channels through which the spending increase has occurred. The results reveal that spending per student has risen in most major spending categories. This is true for both public institutions and private institutions. However, spending has risen more dramatically in some categories than others. For example, research is one category that has witnessed among the highest spending growth, and in percentage terms, there has also been a large increase in student services spending.
Delta Cost Project Data
The data I use come from the Delta Cost Project. The Delta Cost Project primarily relies on data from the Integrated Postsecondary Education Data System (IPEDS), a survey conducted by the US Department of Education’s National Center for Education Statistics. IPEDS is conducted annually and is roughly a census of colleges and universities in the United States. The Delta Cost Project is an attempt to harmonize IPEDS data that come from different years and use different accounting standards. Most of the data I use in this Economic Commentary ultimately come from the IPEDSfinance surveys. These data include information on operating expenses but do not include capital expenses.
The Delta Cost Project has published a number of its own reports with analyses of the Delta Cost Project data. The data and reports are available at http://www.deltacostproject.org. There are several differences between the Delta Cost Project analyses and this Economic Commentary. First, the Delta Cost Project analyses generally use a balanced panel ofinstitutions that are in the data every year, whereas I use all available observations on the grounds that entry and exit of colleges may be one channel through which overall college spending changes. Second, the Delta Cost Project generally reports medians of institution-level spending, whereas I report total spending per student across institutions. I thus shift the focus of study from particular institutions to the higher education sector as a whole. Third, I show results for a larger set of years than the individual Delta Cost Project reports do. Fourth, the Delta Cost Project reports have a broader focus that also considers college revenues and degree production. Insofar as they focus on spending, they primarily focus on overall spending. In contrast, this Economic Commentary is concerned only with spending and shows results that are disaggregated by spending category.
I focus on spending per student in the following seven major spending categories:
- Instruction
- Research
- Public service
- Academic support
- Student services
- Institutional support
- Operations and maintenance of plant.
Two notes about these categories are in order. One is that the instruction category includes expenditures that cannot be separated between instruction, research, and public service. On the other hand, the research category includes expenditures that are specifically for research, and the public service category includes expenditures that are specifically for public service. The second note pertains to the difference between academic support, student services, and institutional support. Academic support includes expenditures that support instruction, research, and public service. For example, this category includes spending on libraries and museums. Student services includes expenditures that are targeted toward students, including career centers and counseling. Institutional support includes expenditures that are related to operating an institution, such as expenditures on the legal and fiscal departments.
I convert values to 2013 dollars per full-time equivalent student using the Consumer Price Index, and I limit the analysis to four-year public institutions and not-for-profit private institutions in the 50 states and the District of Columbia. The period of study begins with the 1987 fiscal year and ends with the 2013 fiscal year.
One issue with the Delta Cost Project data is that spending values that were reported by institutions as 0 were changed to missing on the grounds that institutions are inconsistent about reporting 0s and leaving survey items blank. Although it may very well be true that in some cases it is correct to treat a reported 0 and an item left blank in the same way, in other cases a reported 0 may actually be a true 0 and an item left blank should legitimately be treated as missing. This raises the question of how these cases should be treated in the analysis. The question is whether to include students enrolled at institutions with missing values of spending in the denominator of per-student spending. Including them amounts to treating spending at these institutions as 0. Excluding them amounts to treating these institutions as being entirely missing. I excluded these institutions in my analysis. However, in most cases, the results are quite similar when they are included. The main exception is spending in the research category. Although the trends in spending are similar either way, the level of per-student spending on this category is substantially lower when these institutions are included. This is especially the case for private institutions.
Trends in Expenditures by Colleges and Universities
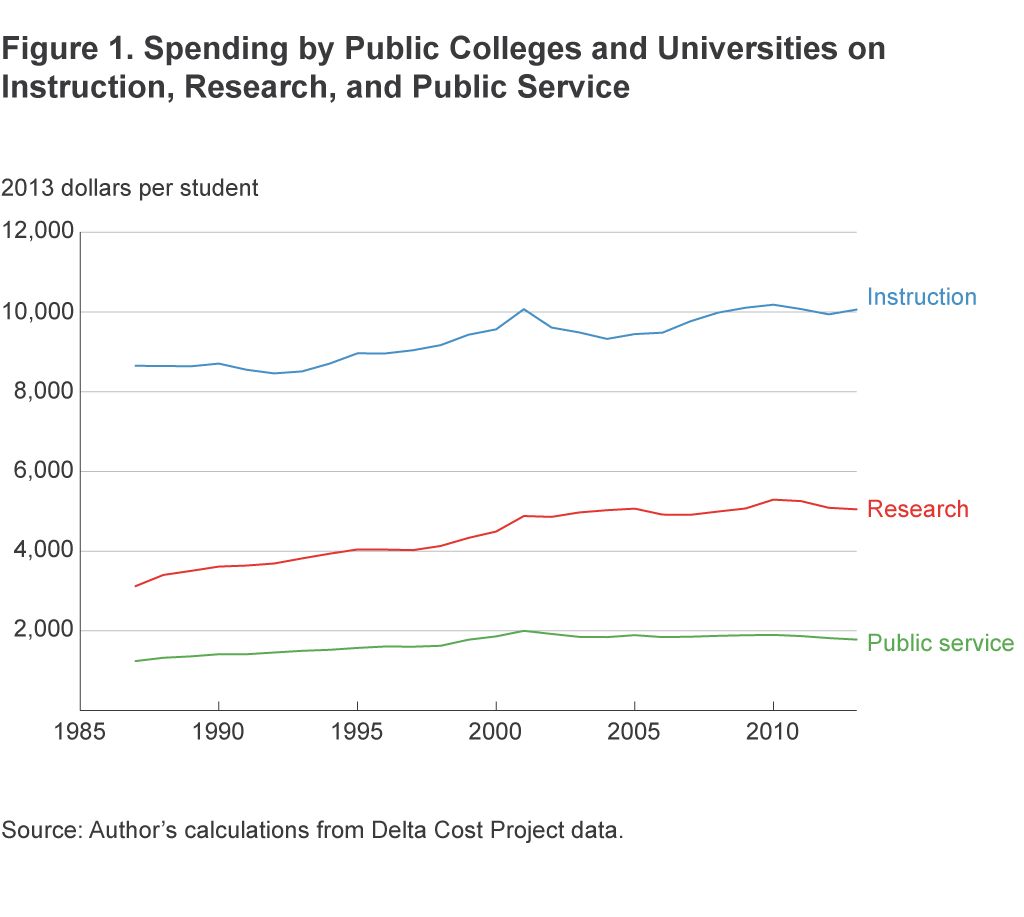
Figure 1 shows results for public universities in the categories of instruction, research, and public service. The general trend in spending in these categories in the early part of the time period under consideration is an upward one that is free of major fluctuations from one year to the next. In more recent years, spending on these categories has been roughly flat,although spending on instruction has fluctuated somewhat.
The situation differs for the other categories of spending, as shown in figure 2. Spending in the academic support, institutional support, and operations and maintenance of plant categories has experienced large fluctuations over short periods of time. In particular, spending on all three of these categories dropped by a substantial amount around the time of the 2001 recession, and spending on operations and maintenance of plant dropped dramatically around the time of the more recent recession. But despite some large swings from one year to the next, spending on the categories shown in figure 2—with the exception of operations and maintenance of plant—has risen over time.
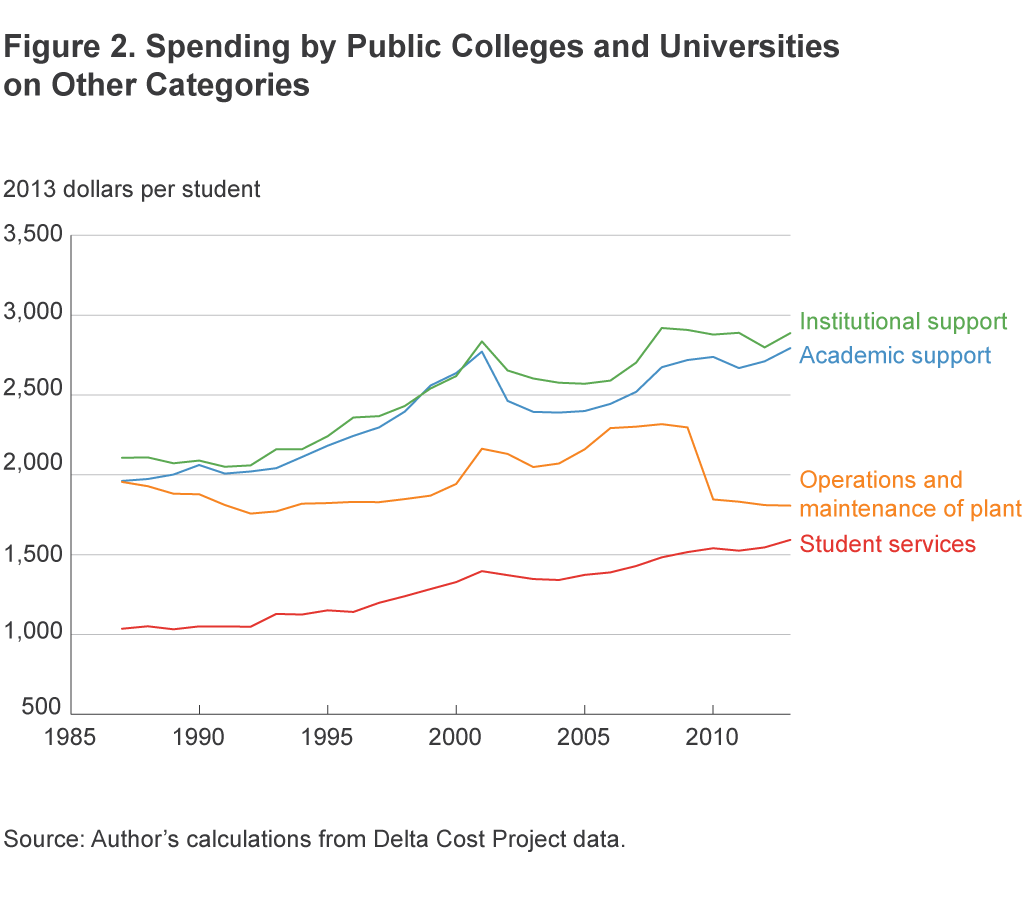
Figure 3 shows instruction, research, and public service spending for private colleges and universities. As with public institutions, spending on instruction and research has increased. However, public service spending at private institutions has actually declined slightly. In every year of the data, private institutions spend more than public institutions on a per-student basis in the categories of instruction and research, but public institutions have spent more on public service in recent years.
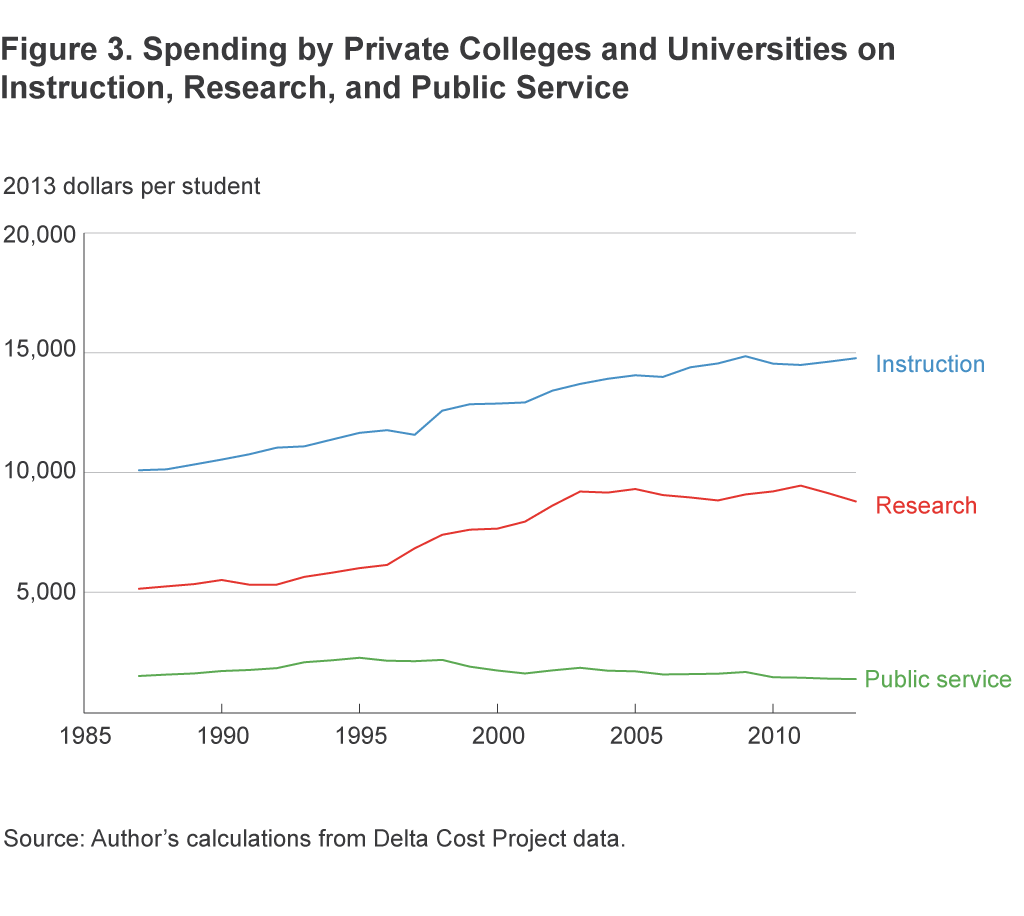
Figure 4 shows the other categories—academic support, institutional support, student services, and operations and maintenance of plant—for private colleges and universities. The trend has been an increase in spending in all of these categories. Unlike at public universities, spending on these categories does not fluctuate much from one year to the next. Moreover, the level of spending is again higher for these categories at private institutions compared to public institutions.
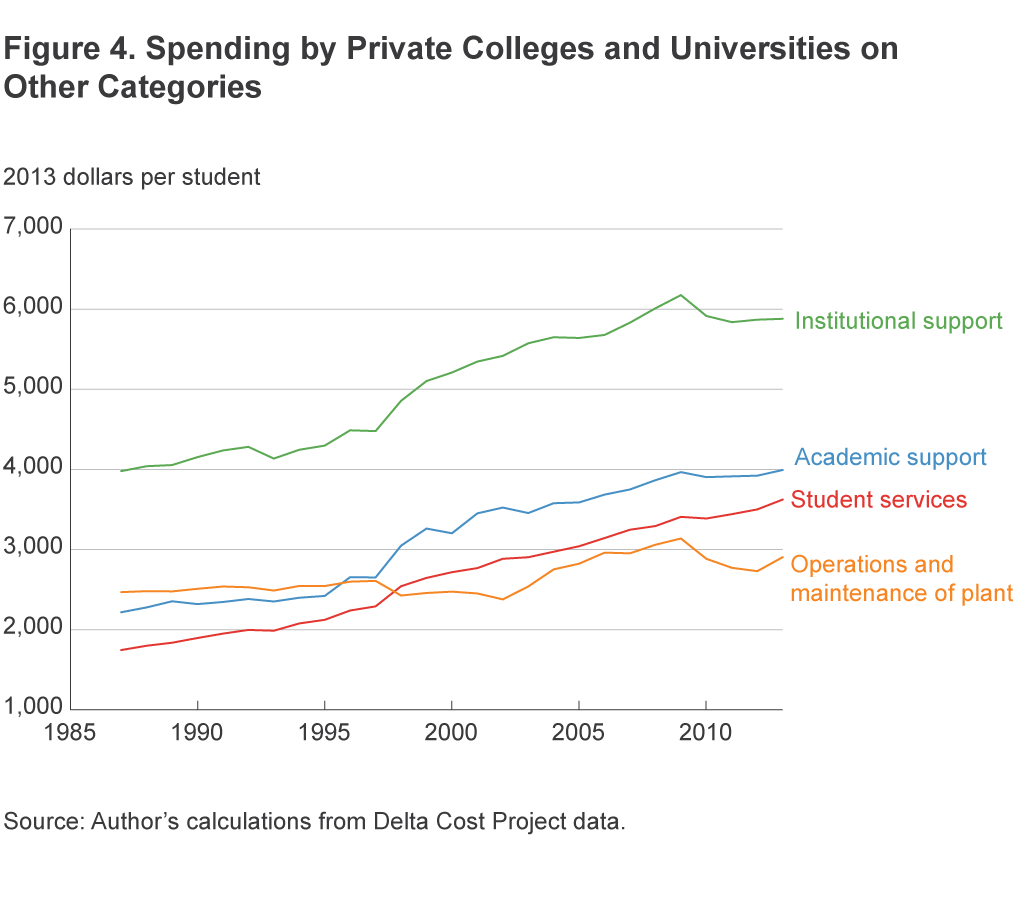
Table 1 summarizes the results from figures 1-4 by showing the change between 1987 and 2013 in per-student spending in each of the categories at public and private institutions. This table makes clear that growth in most spending categories is higher in private institutions than in public institutions. Furthermore, certain categories have experienced large increases in spending over time. For example, spending on student services more than doubled on a per-student basis at private institutions between 1987 and 2013. Sizable increases in spending have also occurred in the categories of research, academic support, and institutional support. Spending on instruction has risen a large amount in absolute terms, but the percentage increase is less than in most other categories. One exception to the large spending increases is operations and maintenance of plant, which has declined on a per-student basis at public institutions and risen by 18 percent at private institutions, which is a small increase compared to the increases in other spending categories.
| Percentage change | Change in dollars per student | ||||
|---|---|---|---|---|---|
| Category | Public | Private | Public | Private | |
| Instruction | 16 | 46 | 1,413 | 4,679 | |
| Research | 62 | 71 | 1,930 | 3,647 | |
| Public service | 44 | −9 | 540 | −131 | |
| Academic support | 42 | 80 | 831 | 1,778 | |
| Student services | 54 | 108 | 556 | 1,881 | |
| Institutional support | 37 | 48 | 780 | 1,904 | |
| Operations and maintenance of plant | −8 | 18 | −148 | 437 | |
Source: Author’s calculations from Delta Cost Project data.
Conclusion
The results of this Economic Commentary point to an increase in spending in a variety of disaggregated spending categories for both public and private colleges and universities between 1987 and 2013, although the increase is larger in some categories than others. What does this tell us about reasons for increasing college costs? It suggests that the explanation must be a broad-based one that can explain spending increases in a variety of categories. For example, different categories of spending could have their own constituencies who successfully advocate for higher spending in their preferred category, or Baumol’s disease might be affecting a number of different spending categories. In contrast, the results of this Economic Commentary would not support a simple explanation about an unwarranted spending increase in one particular category or a type of Baumol’s disease that only affects one particular category.
References
- Hinrichs, Peter, 2016. “Trends in Employment at US Colleges and Universities, 1987–2013,” Federal Reserve Bank of Cleveland, Economic Commentary, 2016-05.
Suggested Citation
Hinrichs, Peter L. 2016. “Trends in Expenditures by US Colleges and Universities, 1987-2013.” Federal Reserve Bank of Cleveland, Economic Commentary 2016-10. https://doi.org/10.26509/frbc-ec-201610
This work by Federal Reserve Bank of Cleveland is licensed under Creative Commons Attribution-NonCommercial 4.0 International

