

- Share
Do Rising Rents Complicate Inflation Assessment?
In the face of falling house prices, decreasing rates of homeownership, and a glut of vacant homes, the Consumer Price Index’s measure of the cost of owner-occupied housing—owners’ equivalent rent of residences (OER)—has begun to accelerate, rising at an annualized rate of 2.3 percent over the past six months. Given a backdrop of generally subdued underlying inflation elsewhere in the index, a persistent increase in the relative price of OER—the largest component of the consumer market basket by far—may create upward pressure on measured inflation.
The views authors express in Economic Commentary are theirs and not necessarily those of the Federal Reserve Bank of Cleveland or the Board of Governors of the Federal Reserve System. The series editor is Tasia Hane. This paper and its data are subject to revision; please visit clevelandfed.org for updates.
The Consumer Price Index (CPI) measures the average price change of a fixed basket of goods and services purchased by urban consumers. Unfortunately, not all items in the consumer market basket are easy to price, and housing is particularly tricky.
First, housing is a durable good, and unlike nondurables (like that cup of coffee that may be sitting on your desk right now), it is consumed over multiple periods. For durables, it’s not the good itself that is being consumed, but the service that the good provides over those multiple time periods. The house price at the time of purchase is not an accurate measure of that service. Another issue is that housing is also an investment good, and since the CPI is a measure of the cost of consuming a fixed market basket, investment purchases shouldn’t appear in the index.
In order to disentangle consumption from investment and account for the cost of shelter over time, the Bureau of Labor Statistics (BLS) employs a special pricing approach just for owner-occupied housing. Essentially, the BLS attempts to measure the cost of consuming owner-occupied housing by comparing it to what it would cost to rent the same housing. The BLS calls this approach “owners’ equivalent rent of primary residence” (OER). OER is defined as “the change in the amount a homeowner would pay to rent” his or her home in a competitive market, and it is calculated by surveying nearby rental units.
OER accounts for roughly 25 percent of the overall CPI. The weight of this sizable component swells to nearly one-third in what is perhaps the most commonly cited underlying inflation statistic—the “core” CPI or the CPI excluding food and energy. Given its enormous weight,OER can have a substantial effect on the direction of the core CPI. In fact, OER and the core CPI are highly correlated, with a correlation coefficient of 0.84 since 1983 (see figure 1).1
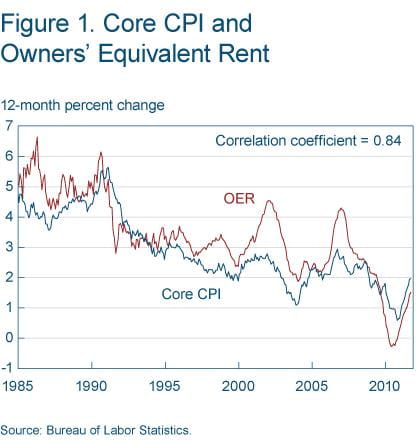
Source: Bureau of Labor Statistics.
In other words, where OER goes, so does the core CPI. This means that movements in OER will tend to be exhibited in the core CPI, irrespective of whether the movement in OER reflects a change in the underlying inflation trend.
Changes in OER could also affect other underlying inflation measures like the median CPI and the 16 percent trimmed-mean CPI.2 These measures eliminate the most volatile price movements in the consumer market basket on a monthly basis, treating those movements as noise that obscures the inflation signal.
However, a problem can arise in these measures when a component that is less likely to exhibit extreme price changes has an unusually high weight. OER happens to be roughly four times as large as the next largest component, and it is usually not volatile enough to end up in the tails of the price-change distribution. As a result, OER is often the median component. Because of these factors, a relative price shock to OER could lead to a false signal of inflationary pressure in these price statistics.
In recognition of this issue, the Federal Reserve Bank of Cleveland—which produces the median CPI and 16 percent trimmed-mean CPI—took steps to limit the influence of OER by breaking it up into its regional components. That approach led to a substantial improvement in the forecast accuracy of the two statistics. Still, an OER component has been the median component about half the time since 1998. (For further explanation, see “Methodological Adjustments to the Median and 16 Percent Trimmed-Mean CPI Estimators”).
OER and the Housing Market
Even though OER is the BLS’s measure of owner-occupied shelter costs, it doesn’t, by construction, reflect changes in house prices. It’s probably no surprise that even over long periods of time, OER and house prices can diverge markedly. Trends in housing and rental markets can push OER in ways that can have a noticeable effect on measured inflation statistics.
In the past decade, we have seen some sizeable differences (figure 2). From 2002 to 2006, as the housing bubble was building, house prices (as measured by the Core Logic house price index) rose at an annualized rate of 11 percent, while OER increased at 2.8 percent per year over that time period.
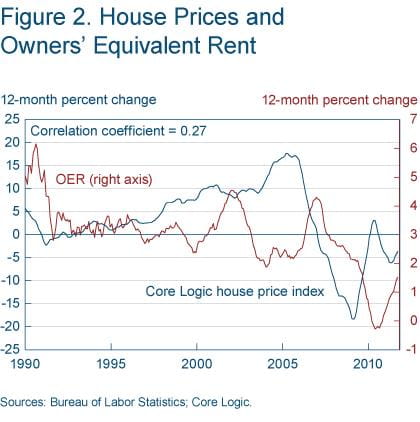
Sources: Bureau of Labor Statistics; Core Logic.
Over the last five years or so, house prices have fallen roughly 30 percent and are still trending down (−4.0 percent over the past four quarters). Meanwhile, OER has increased 8 percent over the past five years and has started to accelerate in recent months. Moreover, conditions in the housing market are likely to lead to a continued acceleration in OER over the next few years.
In the wake of the housing bubble bursting and the subsequent financial crisis, millions of American households have transitioned from owning a home to renting. This transition is reflected in a dramatic decrease in homeownership rates.
Homeownership fell from a peak of 69 percent in the third quarter of 2006 to just 66.3 percent as of the third quarter of 2011, about where it was in the late 1990s. This shift away from homeownership also appears to have been less than voluntary in some instances. Foreclosure rates, according to the Mortgage Bankers Association, have jumped up fourfold since mid-2006.
Undoubtedly, some of the decline in homeownership is due to adverse economic conditions. The unemployment rate jumped from 5.0 percent in December 2007 (the onset of the last recession) to a peak of 10.1 percent in October 2009, and it is still around 8.5 percent currently. Moreover, over 40 percent of unemployed workers have been out of work for longer than 27 weeks. These dour labor market conditions imply that some households have suffered a shock to their income and thus their ability to carry a mortgage.
Moreover, there is also evidence that credit market conditions may also be hampering households’ ability to get financing. Data from the Federal Reserve Board’s Senior Loan Officer Opinion Survey on Bank Lending Practices points to a rapid tightening in lending standards for mortgage loans during the last recession. While that tightening has abated, it has yet to be undone. Research from the Board’s staff also shows that individuals with less than perfect credit scores or those who are first-time home buyers are having difficulty obtaining financing even on mortgages that the lender could sell to Fannie and Freddie.3
These factors have led to a glut of unused housing units. According to the Census Bureau, the number of vacant housing units has jumped 12 percent in the last five years (figure 3). There has also been a dramatic upswing in the number of vacant homes held off the market (up 22 percent over the past five years). Roughly half of these units are being held off the market for “other reasons”—a catch-all category that the Census Bureau has noted likely reflects a number of properties that are in the foreclosure process.4 In addition, there is a growing fraction that is “for sale only,” meaning that these idle properties aren’t able to be used by those households for whom owning a home is no longer an option.
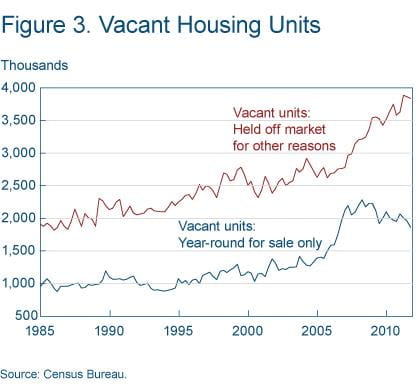
Source: Census Bureau.
The transition away from homeownership has led to a dramatic influx of new renters. All this new demand is starting to put pressure on rental vacancy rates, driving them down sharply in recent quarters. The increasing scarcity of rental units is in turn putting upward pressure on rents.
Because the BLS uses rents to calculate OER, frictions that affect a person’s ability to purchase a home—such as credit market frictions—don’t offset increases in rent, even though they show up as an artificial increase in rental demand. Also, using rents to calculate OER doesn’t account for a glut of vacant homes, which would (all else held constant) lead to a decrease in house prices and thus the cost of carrying a mortgage.
This disruption in the housing market may lead to questions about OER, specifically whether it appropriately picks up changes in the shelter cost for owner-occupied housing. Certainly, an increase in OER given the oversupply of vacant homes and credit frictions that are preventing renters from becoming homeowners could be used as evidence. And, given that OER is measured by nearby rents, transitioning would-be renters back into homeownership may alleviate some of the upward price pressure. Yet it isn’t clear whether those vacancies are habitable or whether those would-be renters ought to (or want to) purchase a home. Regardless, the potential remains for a change in the relative price of owner-occupied shelter costs to give a false signal of inflationary pressure, given the behavior of the rental market (figure 4).
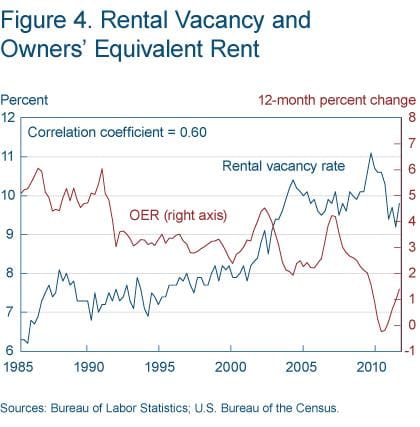
Sources: Bureau of Labor Statistics; US Bureau of the Census.
Moving forward, it is likely that rental vacancy rates will come under further pressure. Household formation, which dipped to a postwar low of just 357,000 new households in 2010, has started to rebound. Persistent impediments in the housing market are likely to make renting the more attractive (and perhaps only) option.
A Forecast of OER and Its Effect on the Core CPI
Given that pressure on rental vacancies puts pressure on rents and OER, it is likely that recent changes in OER will have an impact on measured inflation rates. The question is, how much of an impact?
To provide an illustration of how important OER is to the read we get on underlying inflation from various statistics, I employed a relatively simple model to forecast OER from 2011:Q4 to 2014:Q4.5 This model attempts to capture plausible rental market dynamics and provides a reasonable forecast of OER, using the past behavior of rental vacancy rates, multifamily housing starts, and OER.
The model forecasts that the rental vacancy rate will fall to 8.6 percent by the end of 2014—roughly in line with its level in mid-2002, before the housing bubble erupted (figure 5).
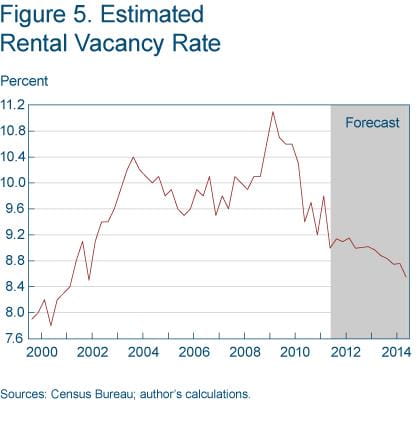
Source: Census Bureau; author's calculations.
Concurrently, OER rises swiftly to 3.5 percent by the fourth quarter of 2014, which is modestly higher than its long-run (20-year) average growth rate of 2.7 percent, but well below the four-quarter growth rate of 4.5 percent that it reached in the first quarter of 2002 (figure 6). While this acceleration in OER isn’t much relative to historical patterns, given the relatively subdued rate of inflation seen elsewhere in the consumer market basket, an acceleration in OER of this magnitude could put a substantial amount of pressure on core CPI inflation.
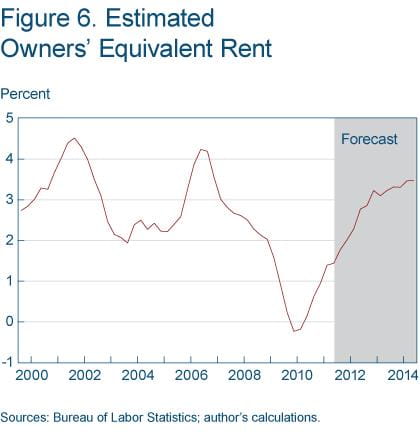
Source: Bureau of Labor Statistics; author's calculations.
For example, suppose the core CPI excluding OER continues on at a pace of roughly 1.5 percent for the next couple of years. Meanwhile, assume OER follows the above forecast, rising to 3.5 percent by the end of 2014. The oft-cited core CPI (with OER) would reflect an underlying inflation rate of 2.2 percent, roughly ¾ percentage points above the underlying inflation rate found elsewhere in the consumer market basket (table 1).
| Percent change (Q4/Q4) | |||
|---|---|---|---|
| Statistic | 2012 | 2013 | 2014 |
| OER | 2.5 | 3.2 | 3.5 |
| Core CPI excluding OER* | 1.5 | 1.5 | 1.5 |
| Core CPI | 2.0 | 2.2 | 2.2 |
| Effect of OER on the core CPI | 0.5 | 0.7 | 0.7 |
*Assumed to grow at the current trend in underlying inflation.
Sources: Bureau of Labor Statistics; author’s calculations.
It’s important to note that this is just a demonstration of a plausible forecast. If prices elsewhere in the market basket—in this case the core CPI excluding OER—followed the same trajectory as OER, then the upward pressure from a jump in OER would disappear. Yet an increase in OER of the magnitude forecasted by this model could make judging the pace of underlying inflation more difficult for policymakers, households, and businesses alike.
Recommended Reading
“Treatment of Owner-Occupied Housing in the CPI,” by Robert Poole, Frank Ptacek, and Randall Verbrugge (2005). Manuscript prepared for the Federal Economic Statistics Advisory Committee (FESAC) on December 9, 2005. Bureau of Labor Statistics.<http://www.bls.gov/bls/fesacp1120905.pdf.>
Footnotes
- The BLS changed its pricing methodology in 1995 in part to lessen the variability in OER. (See “Improvements to the Food at Home, Shelter, and Prescription Drug Indexes in the U.S. Consumer Price Index” for the documentation. The standard deviation in OER fell by more than 50 percent following the change in methodology, and this did correspond with a lessening in the volatility of the core CPI. Return
- These measures are based on research by Michael F. Bryan, Stephen Cecchetti, and Rodney Wiggins (“Efficient Inflation Expectation,” Federal Reserve Bank of Cleveland, working paper no. 9707, 1997) and are produced monthly by the Federal Reserve Bank of Cleveland. Return
- See “The U.S. Housing Market: Current Conditions and Policy Considerations,” available at http://www.federalreserve.gov/publications/other-reports/files/housing-white-paper-20120104.pdf. Return
- Housing Vacancies and Homeownership (CPS/HVS) FAQs,” Census Bureau. https://www.census.gov/housing/hvs/index.html. Return
- I used a vector autoregression (VAR), estimated in log differences with 8 lags of the rental vacancy rate, multifamily housing starts, and OER estimated from 1985:Q1 to 2011:Q3. The use of 8 lags was motivated by a desire to capture the relatively slow-moving nature of rental prices and the fact that the BLS makes a survey of each panel of rental units just twice a year. This model fits the data better than one that includes lags of just OER. Return
Suggested Citation
Meyer, Brent. 2012. “Do Rising Rents Complicate Inflation Assessment?” Federal Reserve Bank of Cleveland, Economic Commentary 2012-02. https://doi.org/10.26509/frbc-ec-201202
This work by Federal Reserve Bank of Cleveland is licensed under Creative Commons Attribution-NonCommercial 4.0 International

