

- Share
The Impact of Investor-Owned Homes on Neighborhoods in Ohio and Pennsylvania
This District Data Brief finds that, during the homebuying slowdown in recent years, first-time and “move-up” home purchases fell less in property investment hotspots than in non-hotspot areas in Ohio and Pennsylvania, suggesting that investors were not the main driver of the slowdown.

The views authors express in District Data Briefs are theirs and not necessarily those of the Federal Reserve Bank of Cleveland or the Board of Governors of the Federal Reserve System. The series editor is Harrison Markel.
Over the last five years, increases in corporate investor purchases of single-family homes have become enmeshed with concerns about widespread housing affordability issues. This District Data Brief reports on neighborhood trends in home purchasing and financial health for areas identified as “hotspots” of investor activity. Using data from individuals’ credit histories, this report finds a distinct slowing of people’s either buying homes in the hotspot neighborhoods or moving into these neighborhoods to make a first-time purchase. However, this report finds that these trends slowed even more dramatically in the non-hotspot neighborhoods, suggesting that investor homebuying is not the most important factor in the home purchasing slowdown.
The analysis here builds on the Federal Reserve Bank of Cleveland’s Community Development Report published in September 2025, titled “Hotspots: Investor-Owned Home Trends from Select Counties in Ohio and Pennsylvania (2018–2024).” In the report, senior policy analyst Matt Klesta uses buyer names recorded in county property transaction data to identify property investors and measure their purchasing activity in six counties in Ohio—Cuyahoga, Franklin, Hamilton, Lucas, Montgomery, and Summit—and in one county in Pennsylvania (Allegheny). The report identifies tracts with high levels of investor purchasing activity as designated “hotspots” while also reporting the investor share of purchases in all other tracts.
In this District Data Brief, individuals are selected in the Federal Reserve Bank of New York/Equifax Consumer Credit Panel (CCP) who live in the tracts designated as having high or low investor activity. The CCP is an anonymous, five-percent random sample drawn from the credit histories maintained by Equifax. The CCP reports an individual’s census tract of residence along with their mortgage balances and other important credit history events, such as bankruptcies and foreclosures. Using these data, one can measure several important trends for the neighborhoods.
This District Data Brief reports on the following nine census-tract-level outcome indicators:
- First-time buyers: The percent of neighborhood residents who became homebuyers during the quarter. An individual is identified as a first-time homebuyer if they had no outstanding mortgage balance over the previous year and then began to have a reported balance in the quarterly data.
- First-time buyers staying: The percent of neighborhood residents who were first-time buyers and lived in the same census tract before and after getting a mortgage.
- First-time buyers arriving: The percent of neighborhood residents who moved into the neighborhood during the same year that they became first-time buyers.
- First-time buyers leaving: The percent of neighborhood residents who moved out of the neighborhood as they became first-time buyers.1
- Moving up the housing ladder: The percent of neighborhood residents with a positive mortgage balance and with a balance in the current quarter at least 15 percent higher than it was in the previous quarter. The balance increase is a proxy for moving from a starter home to a more expensive home.
- Residential turnover: The percent of neighborhood residents who moved in the last quarter.
- Collections: The percent of neighborhood residents with no accounts in collections in the previous quarter but with at least one in the present quarter.
- Bankruptcies: The percent of neighborhood residents with no bankruptcy flag in their credit history in the previous quarter but with one in the current quarter.
- Foreclosures: The percent of neighborhood residents with no foreclosure flag in their credit history in the previous quarter but with one in the present quarter.
All nine indicators are calculated for each tract as of the end of each quarter. Indicators involving residential moves make use of the fact that the CCP continually tracks individuals regardless of their location. Therefore, one can observe if someone has moved to another neighborhood (or region) and purchased a home in their new location.
In studying the trends in these outcome indicators, this report looks at whether increases or decreases in each indicator coincide with the increase in investor purchasing activity. The average share of single-family home purchases by investors in the seven counties mentioned above rose from approximately 17 percent in 2018–2019 to 22 percent in 2023–2024. In these counties’ hotspot neighborhoods, the share of investor purchases rose from 30 percent to 35 percent over the same period. Investors could be purchasing starter homes and outbidding potential owner-occupants. This would cause the households to continue renting or leave the neighborhood to purchase a home. Rising investor demand could also help owner-occupants move up the housing ladder if investors raise demand for starter homes, making it easier to sell them at higher prices. On the other hand, investors could also be buying the somewhat more expensive, larger homes and making those unattainable for some households. Residential turnover that is too high can signal housing instability, so rising turnover may be a concern. Finally, collections, bankruptcies, and foreclosures are measures of financial distress, and this report looks at whether increased investor activity is correlated with increased financial hardship, without taking a stand on whether one trend is causing the other.
Table 1 displays the average levels of each of the nine credit-history-based indicators for the investor hotspot and non-hotspot census tracts in each county from 2023:Q1 through 2024:Q4. As shown in the first column, 35 percent of home purchases in hotspot neighborhoods during this period involved investors, much higher than the 10 percent observed in all other census tracts. Klesta (2025) documented that investor activity is concentrated in lower-income neighborhoods, and these neighborhoods have few homebuyers and more financial distress. For example, on average during 2023 and 2024, 0.30 percent of residents in hotspot neighborhoods become first-time homebuyers each quarter compared with 0.35 percent of residents in non-hotspot neighborhoods. Residents in hotspot neighborhoods were also less likely to move up the housing ladder (0.11 percent versus 0.24 percent) and more likely to show signs of financial distress as measured by having their debts referred to collections (4.04 percent versus 1.53 percent) or having a new bankruptcy (0.65 percent versus 0.40 percent) or foreclosure (0.69 percent versus 0.41 percent).
Table 1: Neighborhood Indicators by County and Hotspot Status, 2023–2024
| County | Status | Investor share of purchases | First-time buyers | First-time buyers staying | First-time buyers arriving | First-time buyers leaving | Moving up the housing ladder | Residential turnover | Collections | Bankruptcies | Foreclosures |
| All counties | Hotspots | 35 | 0.30 | 0.15 | 0.11 | 0.04 | 0.11 | 3.31 | 4.04 | 0.65 | 0.69 |
| All counties | Non-hotspots | 10 | 0.35 | 0.15 | 0.14 | 0.05 | 0.24 | 2.79 | 1.53 | 0.40 | 0.41 |
| Allegheny | Hotspots | 34 | 0.31 | 0.16 | 0.09 | 0.05 | 0.09 | 2.83 | 2.95 | 0.52 | 0.59 |
| Allegheny | Non-hotspots | 12 | 0.33 | 0.13 | 0.14 | 0.04 | 0.23 | 2.31 | 1.03 | 0.37 | 0.39 |
| Cuyahoga | Hotspots | 39 | 0.27 | 0.13 | 0.10 | 0.03 | 0.09 | 3.34 | 4.57 | 0.72 | 0.73 |
| Cuyahoga | Non-hotspots | 11 |
0.33 |
0.14 | 0.13 | 0.05 | 0.21 | 2.58 | 1.55 | 0.44 | 0.44 |
| Franklin | Hotspots | 32 | 0.35 | 0.16 | 0.15 | 0.04 | 0.13 | 3.66 | 4.13 | 0.64 | 0.69 |
| Franklin | Non-hotspots | 10 | 0.43 | 0.16 | 0.16 | 0.08 | 0.30 | 3.76 | 1.53 | 0.33 | 0.33 |
| Hamilton | Hotspots | 35 | 0.32 | 0.14 | 0.13 | 0.04 | 0.17 | 3.59 | 3.83 | 0.61 | 0.61 |
| Hamilton | Non-hotspots | 13 | 0.38 | 0.16 | 0.14 | 0.07 | 0.27 | 2.72 | 1.57 | 0.40 | 0.41 |
| Lucas | Hotspots | 39 | 0.28 | 0.14 | 0.08 | 0.05 | 0.05 | 3.04 | 4.85 | 0.78 | 0.79 |
| Lucas | Non-hotspots | 8 | 0.33 | 0.16 | 0.12 | 0.04 | 0.20 | 2.67 | 2.00 | 0.44 | 0.47 |
| Montgomery | Hotspots | 33 | 0.23 | 0.14 | 0.08 | 0.01 | 0.10 | 3.34 | 4.25 | 0.74 | 0.79 |
| Montgomery | Non-hotspots | 10 | 0.38 | 0.15 | 0.16 | 0.04 | 0.25 | 2.79 | 1.87 | 0.48 | 0.49 |
| Summit | Hotspots | 35 | 0.30 | 0.15 | 0.10 | 0.04 | 0.08 | 3.18 | 4.83 | 0.76 | 0.75 |
| Summit | Non-hotspots | 9 | 0.29 | 0.14 | 0.10 | 0.04 | 0.24 | 2.58 | 1.72 | 0.44 | 0.41 |
Sources: CoreLogic, Klesta (2025), Federal Reserve Bank of New York/Equifax Consumer Credit Panel, and author’s calculations
Notes: The units in this table are percentage points (for example, 0.5 is one half of one percentage point). Values are averages over the eight quarters from 2023:Q1 through 2024:Q4. Hotspot neighborhoods were identified using a Local Moran’s I spatial statistic and generally saw investors making more than one fifth of home purchases.
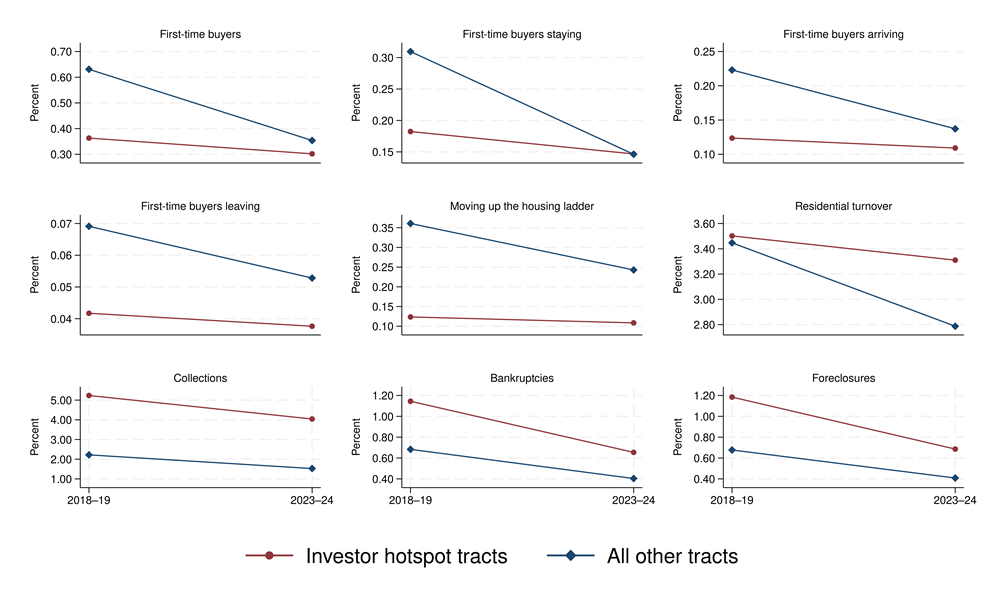
To understand whether investor purchasing activity coincides with shifts in the trends of any of the outcome indicators, Figure 1 compares the changes in hotspot census tracts to the changes in all other census tracts. The figure compares the quarterly averages from 2018 and 2019 to the averages over 2023 and 2024.
The first five indicators, which are related to home purchasing, declined in both investor hotspot and non-hotspot neighborhoods. For example, from 2018 through 2019, on average, 0.36 percent of residents in hotspot census tracts became first-time homebuyers each quarter. For 2023 and 2024, that average declined by 0.06 percentage points to 0.30 percent, while non-hotspot census tracts saw a much larger drop of 0.28 percentage points, from 0.63 percent to 0.35 percent. There were modest changes in the hotspot neighborhoods in the indicators of moving up the housing ladder (“move-up purchases”) (−0.02 percent) and residential turnover (−0.19 percent), while there were much larger declines in non-hotspot neighborhoods (−0.12 percent and −0.66 percent, respectively).
Figure 1: Changes in Neighborhood Indicators from 2018–2019 through 2023–2024
Sources: CoreLogic, Klesta (2025), Federal Reserve Bank of New York/Equifax Consumer Credit Panel, and author’s calculations
Notes: The units in this figure are percentage points (for example, 0.5 is one half of one percentage point). Values are averages over the seven Fourth District counties and over the eight quarters from 2018:Q1 through 2019:Q4 or from 2023:Q1 through 2024:Q4. Hotspot neighborhoods were identified using a Local Moran’s I spatial statistic and generally saw investors making more than one fifth of home purchases.
Financial distress for residents of investor hotspot tracts declined across all three indicators, that is, collections, bankruptcy, and foreclosure (see the bottom three graphs in Figure 1). In the post-pandemic period, the share of residents with accounts entering collections was 1.19 percentage points lower than in the pre-pandemic period, and the incidence of new bankruptcies and new foreclosures both fell by 0.5 percentage points over this same timeframe. These patterns suggest that household financial health did not deteriorate in neighborhoods in which investors were most active. Smaller declines were observed outside the investor hotspots.
In Table 2, the changes displayed in Figure 1 are reported in the top two rows, while the equivalent changes for all the individual counties and types of neighborhoods are reported below. In addition to providing estimates for each county, Table 2 reveals that the slowdowns in first-time purchases, move-up purchases, residential moves, and financial distress indicators were all widespread. With only a few exceptions, declines were observed across all nine indicators in most counties and in both types of neighborhoods.
Table 2: Changes in Neighborhood Indicators by County and Hotspot Status, 2018–2019 through 2023–2024
| County | Status | Investor share of purchases | First-time buyers | First-time buyers staying | First-time buyers arriving | First-time buyers leaving | Moving up the housing ladder | Residential turnover | Collections | Bankruptcies | Foreclosures |
| All counties | Hotspots | 5 | -0.06 | -0.04 | -0.01 | 0.00 | -0.02 | -0.19 | -1.19 | -0.49 | -0.50 |
| All counties | Non-hotspots | 4 | -0.28 | -0.16 | -0.09 | -0.02 | -0.12 | -0.66 | -0.69 | -0.28 | -0.27 |
| Allegheny | Hotspots | 11 | -0.14 | -0.08 | -0.05 | 0.01 | -0.02 | -0.34 | -0.87 | -0.50 | -0.50 |
| Allegheny | Non-hotspots | 5 | -0.35 | -0.27 | -0.06 | -0.01 | -0.10 | -0.43 | -0.59 | -0.30 | -0.31 |
| Cuyahoga | Hotspots | 4 | -0.03 | -0.03 | 0.00 | 0.00 | -0.02 | -0.25 | -1.17 | -0.46 | -0.51 |
| Cuyahoga | Non-hotspots | 4 | -0.24 | -0.12 | -0.09 | -0.02 | -0.09 | -0.61 | -0.71 | -0.30 | -0.30 |
| Franklin | Hotspots | 5 | -0.06 | -0.03 | -0.02 | -0.01 | -0.02 | -0.21 | -1.37 | -0.57 | -0.56 |
| Franklin | Non-hotspots |
3 | -0.26 | -0.13 | -0.10 | -0.01 | -0.14 | -1.02 | -0.58 | -0.20 | -0.19 |
| Hamilton | Hotspots | 4 | -0.07 | -0.04 | -0.02 | 0.00 | -0.01 | -0.20 | -1.36 | -0.38 | -0.40 |
| Hamilton | Non-hotspots | 3 | -0.22 | -0.13 | -0.09 | 0.00 | -0.19 | -0.60 | -0.74 | -0.23 | -0.23 |
| Lucas | Hotspots | 1 | 0.05 | 0.02 | 0.02 | 0.01 | -0.04 | -0.14 | -1.67 | -0.45 | -0.48 |
| Lucas | Non-hotspots | 2 | -0.24 | -0.12 | -0.07 | -0.04 | -0.13 | -0.74 | -1.14 | -0.33 | -0.28 |
| Montgomery | Hotspots | 2 | -0.05 | 0.00 | 0.00 | -0.04 | 0.00 | 0.18 | -1.18 | -0.53 | -0.48 |
| Montgomery | Non-hotspots | 5 | -0.24 | -0.12 | -0.08 | -0.02 | -0.07 | -0.66 | -0.71 | -0.27 | -0.24 |
| Summit | Hotspots | 8 | -0.02 | -0.03 | 0.02 | -0.01 | 0.02 | -0.15 | -0.94 | -0.48 | -0.48 |
| Summit | Non-hotspots | 3 | -0.37 | -0.19 | -0.12 | -0.04 | -0.13 | -0.62 | -0.67 | -0.36 | -0.32 |
Sources: CoreLogic, Klesta (2025), Federal Reserve Bank of New York/Equifax Consumer Credit Panel, and author’s calculations
Notes: The units in this table are percentage points (for example, 0.5 is one half of one percentage point). Values are 2023–2024 averages minus the 2018–2019 averages. The 2018–2019 averages can be found in Appendix Table A1. Hotspot neighborhoods were identified using a Local Moran’s I spatial statistic and generally saw investors making more than one fifth of home purchases.
For each outcome indicator, Table 3 displays the differences in changes over time between hotspot and non-hotspot census tracts. These are referred to as difference-in-differences estimates, and they summarize whether neighborhoods of one type (hotspot census tracts) have had a substantially different trend than other neighborhoods (non-hotspot census tracts). Based on these estimates, there is some county-to-county variation in the magnitude of the differences; however, the interpretations are quite consistent across counties.
The difference-in-differences values are positive for the first-time-buyer and moving-up indicators because these purchases declined by more in the non-hotspot neighborhoods. For example, the first-time buyer decline of −0.14 percentage points in Allegheny County’s hotspot neighborhoods minus the decline of −0.35 percentage points in its non-hotspot neighborhoods gives a difference-in-differences value of 0.21. If investor purchasing activity were preventing people from becoming first-time buyers, it would be more likely that the difference-in-differences estimate would be negative, reflecting larger slowdowns in the hotspot neighborhoods.
Looking at the difference-in-differences estimates for residential turnover, community leaders in hotspot neighborhoods would prefer smaller or even negative values. The estimates were positive because residential turnover in the hotspot neighborhoods did not decline by as much as it did in the non-hotspot neighborhoods. This could reflect that investor purchasing activity was keeping turnover higher than it would otherwise be. Investors typically rent out the houses they own, and renters move more frequently than owner-occupants for both voluntary and involuntary reasons. Higher turnover in hotspot neighborhoods could be associated with greater housing instability and more frequent evictions of renters experiencing financial hardships compared with non-hotspot neighborhoods, among other explanations.
The negative difference-in-differences values in the last three columns of Table 3 reflect that in every county, indicators of financial distress fell by more in neighborhoods with more investor purchasing activity than they did in other neighborhoods. This is not what one would expect if investor activity were creating additional financial stress.
Table 3: Difference-in-Differences Estimates by County, 2018–2019 through 2023–2024
| County | Investor share of purchases | First-time buyers | First-time buyers staying | First-time buyers arriving | First-time buyers leaving | Moving up the housing ladder | Residential turnover | Collections | Bankruptcies | Foreclosures |
| All counties | 1.84 | 0.22 | 0.13 | 0.07 | 0.01 | 0.10 | 0.47 | -0.50 | -0.21 | -0.23 |
| Allegheny | 6.02 | 0.21 | 0.19 | 0.01 | 0.02 | 0.08 | 0.08 | -0.28 | -0.21 | -0.20 |
| Cuyahoga | -0.17 | 0.21 | 0.09 | 0.09 | 0.01 | 0.08 | 0.36 | -0.46 | -0.16 | -0.21 |
| Franklin | 2.27 | 0.20 | 0.10 | 0.08 | 0.00 | 0.12 | 0.81 | -0.80 | -0.38 | -0.38 |
| Hamilton | 0.15 | 0.15 | 0.09 | 0.06 | 0.00 | 0.17 | 0.40 | -0.62 | -0.14 | -0.16 |
| Lucas | -0.72 | 0.29 | 0.14 | 0.09 | 0.05 | 0.09 | 0.60 | -0.53 | -0.12 | -0.20 |
| Montgomery | -2.44 | 0.19 | 0.12 | 0.08 | -0.01 | 0.06 | 0.84 | -0.47 | -0.26 | -0.24 |
| Summit | 5.38 | 0.35 | 0.17 | 0.14 | 0.03 | 0.15 | 0.48 | -0.27 | -0.12 | -0.15 |
Sources: CoreLogic, Klesta (2025), Federal Reserve Bank of New York/Equifax Consumer Credit Panel, and author’s calculations
Notes: Values are the differences between the hotspot and non-hotspot values in Table 2. Hotspot neighborhoods were identified using a Local Moran’s I spatial statistic and generally saw investors making more than one fifth of home purchases.
Estimation of simple difference-in-differences regressions confirms that all the differences in the first row of Table 3 are statistically significant. However, a different type of regression is probably more appropriate because investor purchasing activity is not all-or-none. Some investor activity is observed in every neighborhood, so the regression can include the continuous measure of investor activity rather than an indicator for high investor activity. In this regression, I control for the long-run differences between neighborhoods by using a tract fixed effect. I control for broad national trends, such as interest rate changes, by using a fixed effect for each of the 28 quarters in the data.2 This allows for isolation of the changes in the outcomes that are correlated with the changes in the relative level of investor activity within the same tract.
Results from these regressions are presented in Table 4. Each row represents a separate regression for each outcome indicator, with coefficient and standard error estimates reported for the variable of interest, that is, the share of investor purchases in the census tract. All the coefficients have very small magnitudes, and none of them are statistically significantly different from zero. The small standard errors suggest that these relationships are measured quite precisely, and the true relationship is probably very close to zero. Even if the coefficient with the largest magnitude, −0.0013 for residential turnover, were combined with a large change in investor activity, such as a 10-percentage-point increase, this would suggest only a 0.013-percentage-point change in the outcome. That is only four-tenths of one percent of the mean, a very small change.
Table 4: Neighborhood Indicators Regressed on the Investor Share of Purchases, 2018–2024
| Outcome variable | Coefficient | Standard error | R-squared | Mean of outcome | Standard deviation |
| First-time buyers | 0.0006 | 0.0004 | 0.11 | 0.43 | 0.63 |
| First-time buyers staying | 0.0006 | 0.0003 | 0.09 | 0.19 | 0.42 |
| First-time buyers arriving | 0.0002 | 0.0003 | 0.08 | 0.16 | 0.36 |
| First-time buyers leaving | 0.0000 | 0.0002 | 0.05 | 0.06 | 0.22 |
| Moving up the housing ladder | 0.0001 | 0.0003 | 0.19 | 0.26 | 0.48 |
| Residential turnover | -0.0013 | 0.0012 | 0.34 | 3.25 | 2.07 |
| Collections | -0.0004 | 0.0013 | 0.52 | 3.06 | 2.48 |
| Bankruptcies | -0.0008 | 0.0006 | 0.25 | 0.73 | 0.94 |
| Foreclosures | -0.0009 | 0.0006 | 0.25 | 0.75 | 0.97 |
Sources: CoreLogic, Klesta (2025), Federal Reserve Bank of New York/Equifax Consumer Credit Panel, and author’s calculations
Notes: The units in this table (except for R-squared) are percentage points (for example, 0.5 is one half of one percentage point). Regressions include tract and quarter fixed effects. Observations are at the tract-quarter level. N = 30,348.
Significance key: ∗∗∗ p<0.001; ∗∗ p<0.01; ∗ p<0.05
Conclusion
This report finds that during years when investor home purchasing increased, first-time home purchases declined in investor-purchasing hotspot neighborhoods, but first-time home purchases declined by even more in non-hotspot neighborhoods. Both types of neighborhoods displayed similar patterns of a slowing of financial distress events (collections, bankruptcies, and foreclosures). This suggests that the increases in corporate investor purchasing activity were not the primary driver of changes in purchasing activity or household financial health.
Footnotes
- Moves out of the neighborhood are observed within six months after a mortgage first appears in the borrower’s credit record. Return to 1
- To make use of all the variation observable in the data for this analysis, all quarters from the seven years spanning 2018 through 2024 are included. Return to 2
Appendix
Table A1: Neighborhood Indicators by County and Hotspot Status, 2018–2019
| County | Status | Investor share of purchases | First-time buyers | First-time buyers staying | First-time buyers arriving | First-time buyers leaving | Moving up the housing ladder | Residential turnover | Collections | Bankruptcies | Foreclosures |
| All counties | Hotspots | 30 | 0.36 | 0.18 | 0.12 | 0.04 | 0.12 | 3.50 | 5.24 | 1.14 | 1.18 |
| All counties | Non-hotspots | 7 | 0.63 | 0.31 | 0.22 | 0.07 | 0.36 | 3.45 | 2.22 | 0.68 | 0.68 |
| Allegheny | Hotspots | 24 | 0.44 | 0.24 | 0.14 | 0.04 | 0.11 | 3.17 | 3.82 | 1.02 | 1.09 |
| Allegheny | Non-hotspots | 7 | 0.68 | 0.40 | 0.20 | 0.05 | 0.33 | 2.73 | 1.62 | 0.66 | 0.69 |
| Cuyahoga | Hotspots | 36 | 0.31 | 0.17 | 0.09 | 0.04 | 0.11 | 3.58 | 5.74 | 1.18 | 1.24 |
| Cuyahoga | Non-hotspots | 7 | 0.57 | 0.26 | 0.22 | 0.07 | 0.30 | 3.19 | 2.27 | 0.74 | 0.74 |
| Franklin | Hotspots | 26 | 0.41 | 0.19 | 0.17 | 0.05 | 0.15 | 3.87 | 5.50 | 1.21 | 1.25 |
| Franklin | Non-hotspots | 7 | 0.69 | 0.30 | 0.26 | 0.08 | 0.44 | 4.78 | 2.11 | 0.53 | 0.52 |
| Hamilton | Hotspots | 32 | 0.39 | 0.17 | 0.15 | 0.04 | 0.18 | 3.78 | 5.18 | 0.99 | 1.01 |
| Hamilton | Non-hotspots | 10 | 0.60 | 0.28 | 0.23 | 0.07 | 0.45 | 3.31 | 2.31 | 0.63 | 0.64 |
| Lucas | Hotspots | 37 | 0.23 | 0.12 | 0.06 | 0.04 | 0.09 | 3.18 | 6.52 | 1.23 | 1.27 |
| Lucas | Non-hotspots | 6 | 0.57 | 0.28 | 0.19 | 0.08 | 0.33 | 3.41 | 3.14 | 0.77 | 0.75 |
| Montgomery | Hotspots | 31 | 0.28 | 0.14 | 0.08 | 0.05 | 0.11 | 3.16 | 5.43 | 1.26 | 1.27 |
| Montgomery | Non-hotspots | 5 | 0.61 | 0.27 | 0.24 | 0.07 | 0.32 | 3.45 | 2.58 | 0.75 | 0.73 |
| Summit | Hotspots | 27 | 0.32 | 0.18 | 0.08 | 0.04 | 0.06 | 3.33 | 5.77 | 1.24 | 1.23 |
| Summit | Non-hotspots | 7 | 0.66 | 0.33 | 0.22 | 0.07 | 0.37 | 3.21 | 2.38 | 0.79 | 0.74 |
Sources: CoreLogic, Klesta (2025), Federal Reserve Bank of New York/Equifax Consumer Credit Panel, and author’s calculations
Notes: The units in this table are percentage points (for example, 0.5 is one half of one percentage point). Values are averages over the eight quarters from 2018:Q1 through 2019:Q4. Hotspot neighborhoods were identified using a Local Moran’s I spatial statistic and generally saw investors making more than one fifth of home purchases.
References
- Klesta, Matt. 2025. “Hotspots: Investor-Owned Home Trends from Select Counties in Ohio and Pennsylvania (2018–2024).” Federal Reserve Bank of Cleveland, Community Development Reports. https://doi.org/10.26509/frbc-cd-20250904
Suggested Citation
Whitaker, Stephan D. 2026. “The Impact of Investor-Owned Homes on Neighborhoods in Ohio and Pennsylvania.” Federal Reserve Bank of Cleveland, Cleveland Fed District Data Brief. https://doi.org/10.26509/frbc-ddb-20261118
This work by Federal Reserve Bank of Cleveland is licensed under Creative Commons Attribution-NonCommercial 4.0 International


Related resources

About Us
The Federal Reserve Bank of Cleveland (commonly known as the Cleveland Fed) is part of the Federal Reserve System, the central bank of the United States.

District Data Briefs
District Data Briefs offer accessible, short-form data analyses that allow our regional economists to highlight some of the data they examine and share insights about what the data tells us about our region’s economy.

Community Development Reports
Our community development reports provide research and analysis on community and economic development issues in our region, including foreclosure patterns, lending environment conditions, and workforce issues.