

- Share
Hotspots: Investor-Owned Home Trends from Select Counties in Ohio and Pennsylvania (2018–2024)
This report provides an in-depth look at investor purchases and ownership of homes in select investor “hotspots” in Ohio and Pennsylvania from 2018 through 2024 and examines the impact on lower-income communities.

The views expressed in this report are those of the author(s) and are not necessarily those of the Federal Reserve Bank of Cleveland or the Board of Governors of the Federal Reserve System.
Introduction
For some time, those of us in the Cleveland Fed’s Community Development Department have been hearing a common concern: that the growing share of single-family homes (SFHs) that are being purchased by investors rather than occupied by owners might impact low- and moderate-income (LMI) neighborhoods.1 This concern has been raised in our Community Issues Survey, in meetings of our Community Advisory Council, and by contacts across the Fourth Federal Reserve District.2 Some have worried that investors’ ability to purchase SFHs with cash is making it difficult for households to compete with them on home purchases. Another concern is that out-of-state SFH investors—the share of which is growing—are not repairing or improving their properties at the same rate as other types of owners.
These concerns drove one public agency to take direct action. When a large, out-of-state property owner went bankrupt, the Cincinnati Port Authority (CPA) stepped in and purchased nearly 200 properties, outbidding a dozen investment firms. The CPA’s goal is to repair, rehabilitate, and then sell the properties at the lowest possible price to the LMI tenants that are currently occupying the properties.
The purchasing of SFHs by investors is not unique to the Fourth District; it is occurring in communities across the country and has spurred related research around the Federal Reserve System by the Federal Reserve Banks of Minneapolis, Philadelphia, and Richmond.
Amid the uncertainty and apprehension, this report examines trends in purchases and ownership of SFHs by investors from 2018 through 2024 for seven counties in the Fourth District. First, spatial analysis is used to identify where high levels of investor activity are occurring based on the share of SFH purchases made by investors. Next, the neighborhood characteristics of these investor hotspots are examined. Last, several questions that we commonly hear regarding investor activity in these hotspots are answered. These questions relate to the share of SFHs purchased by investors, how investor ownership of SFHs has changed over time, the prevalence of out-of-state investors, the use of cash for purchases, and the use of building permits. Geographically, the focus is on seven large counties: Six are in Ohio (Cuyahoga, Franklin, Hamilton, Lucas, Montgomery, and Summit), and one is in Pennsylvania (Allegheny).
There is no standard definition of a property investor, so this paper defines it as an entity with a name that contains key terms such as “LLC,” “co,” or “corp” or as individuals, entities, or trusts that have averaged two property transactions per year during the period studied. Nonprofits, governments, homebuilders, and banks are excluded. This broad definition allows all types of investors to be included such as speculators (those buying a property with the intention of reselling it at a higher price), flippers (those buying a property with the intention of renovating and reselling it for a profit), and landlords to fully capture the impact of property investors on the SFH landscape. More on this identification process can be found in the methodology section.
Key Findings in Investor Hotspots
- Neighborhoods investors tend to operate in: In the seven counties, 79 percent of hotspot census tracts are considered LMI compared to only 25 percent of non-hotspot tracts. In addition, hotspot tracts have lower home values, rents, and price-to-rent ratios and higher shares of vacancy, non-white residents, and rent burden (the share of households spending more than 30 percent of their income on housing costs).
- Share of SFH purchases made by investors: Across the portions of the seven counties identified as hotspot tracts, 43 percent of SFH purchases in 2024 were made by investors. Twenty-two percent of SFH transactions involved owner-occupants’ selling to investors (up 2 percentage points from 2018), while investors’ selling to other investors made up 21 percent of transactions (up 7 percentage points from 2018).
- Investor ownership of SFHs and its change over time: In 2024, investors owned 27 percent of SFHs on average across the seven county hotspot census tracts, an increase of 1.8 percentage points from 2018. The share of SFHs owned by investors ranged from a high of 33 percent in Summit County to a low of 21 percent in Allegheny County. However, Allegheny County saw the largest increase since 2018 (up 3.3 percentage points).
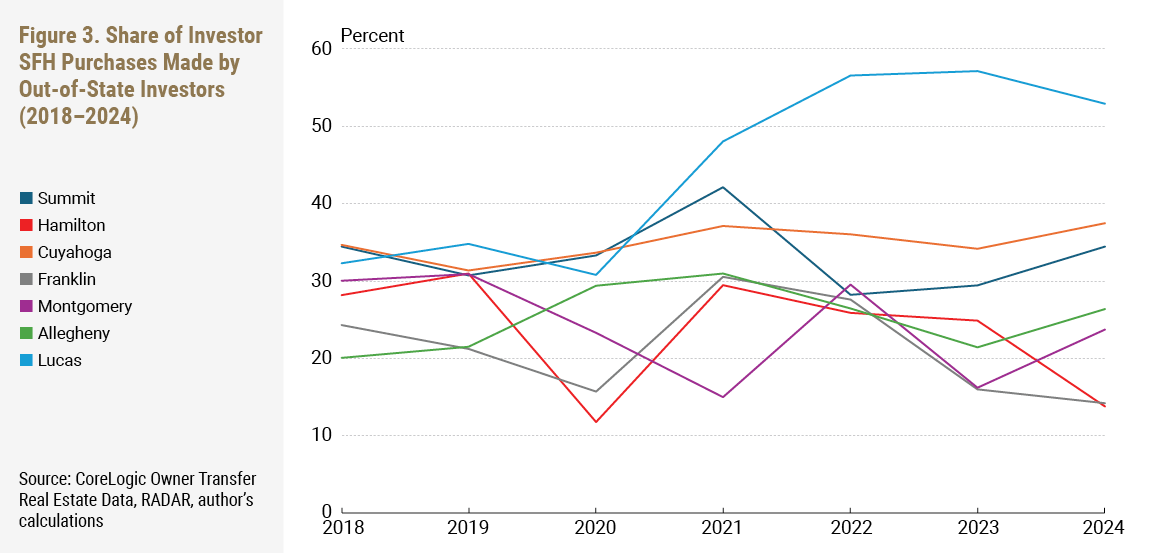
- Share of SFH purchases made by out-of-state investors: Out-of-state investors accounted for 26 percent of all investor-purchased SFHs on average across the seven county hotspot tracts in 2024, unchanged from 2018. In 2024, three counties saw their shares remain above 2018 levels (Cuyahoga, Lucas, and Allegheny). Lucas County has experienced particularly high out-of-state investor activity, with these investors accounting for more than 50 percent of all investor-purchased SFHs from 2020 through 2024.
- Out-of-state ownership of SFHs and its change over time: Out-of-state investors owned 16 percent of investor-owned SFHs on average across the seven county hotspot tracts in 2024, an increase of 3 percentage points from 2018. Their 2024 ownership shares ranged from a high of 27 percent in Lucas County to a low of 12 percent in Franklin County, and the changes from 2018 ranged from +11.2 percentage points (Lucas County) to −5.7 percentage points (Hamilton County).
- Cash purchases: In 2024, investors in the seven county hotspot tracts used cash for the majority of their SFH purchases (60 percent), but that marked a decrease of 19 percentage points from 2018.
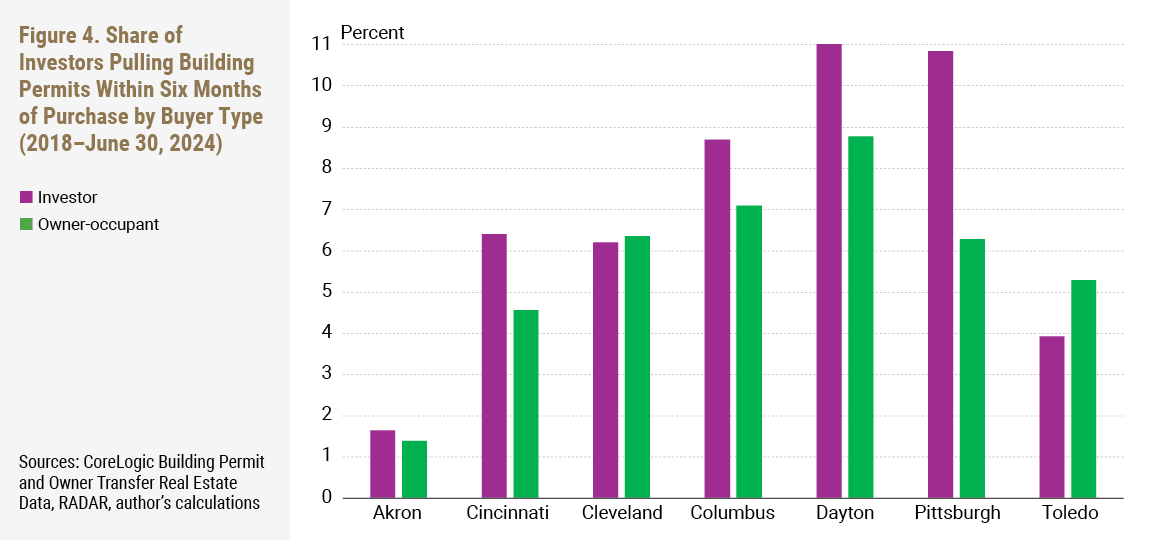
- Building permits: Within six months of purchasing a SFH, investors in seven cities’ hotspot census tracts pulled permits (a general indication that a property is being improved) on a greater share of those properties (7.1 percent) than did owner-occupants (5.9 percent).3 However, in Cleveland and Toledo, owner-occupants pulled permits at higher rates. In addition, in-state investors pulled permits at a higher rate (7.9 percent) than out-of-state investors (4.9 percent), a trend that occurred in all the cities except Dayton.
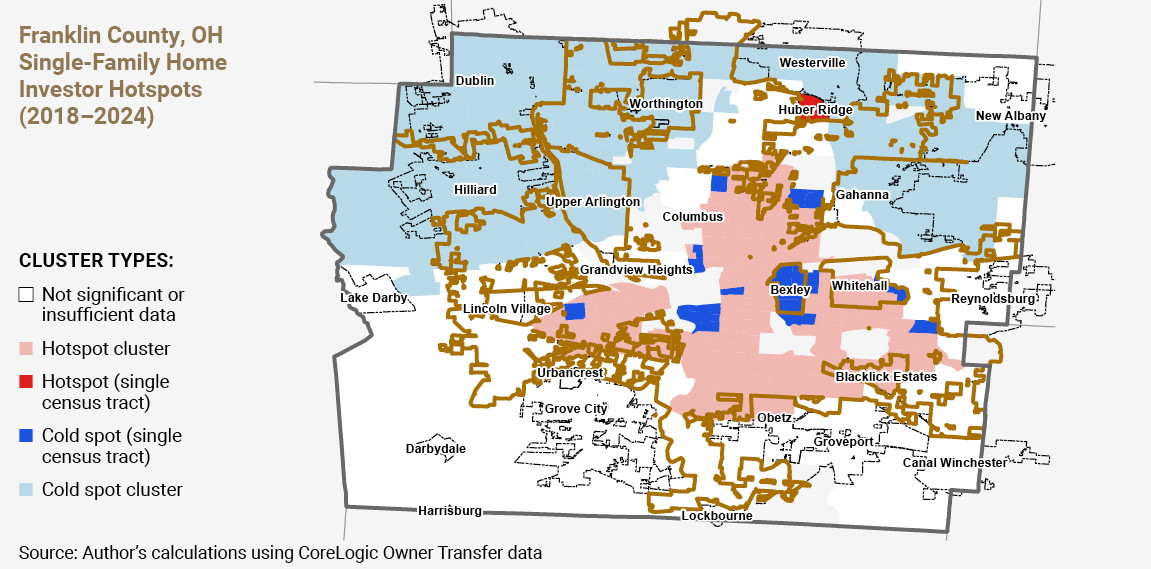
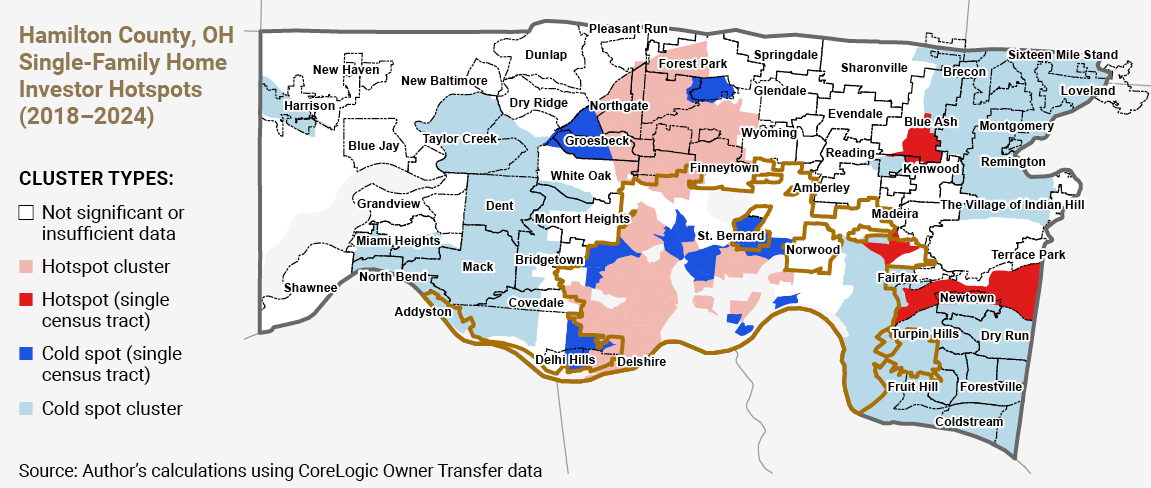
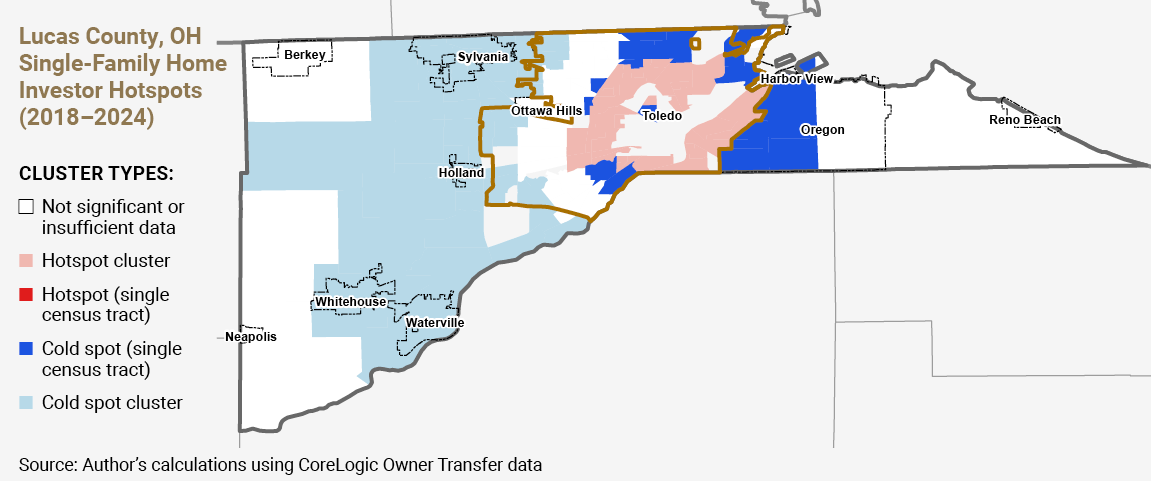
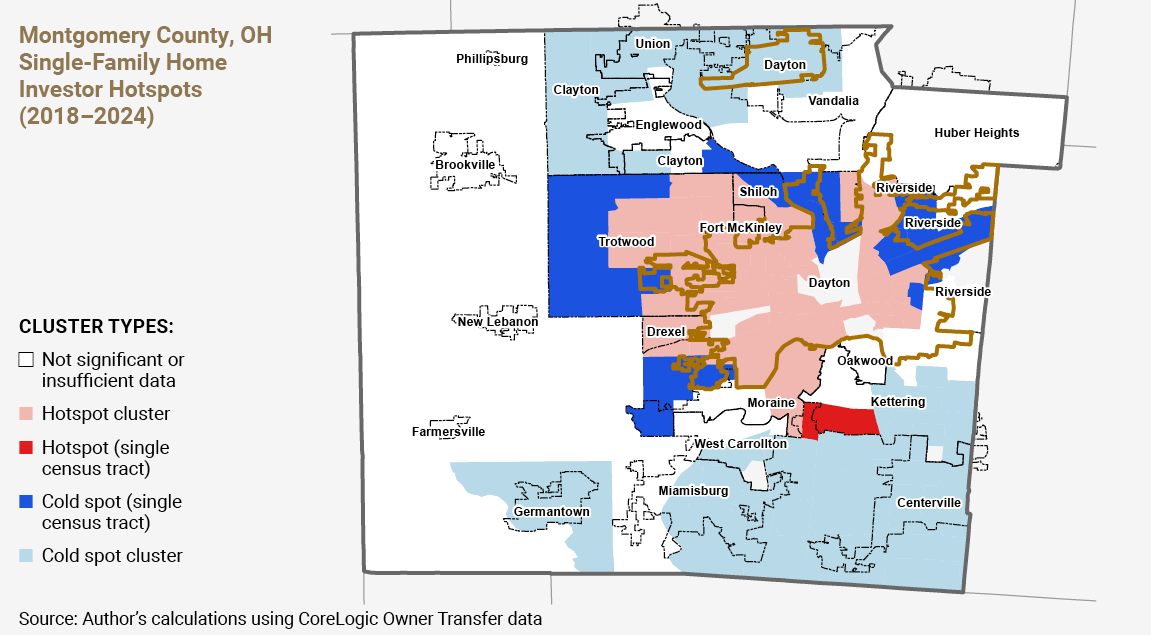
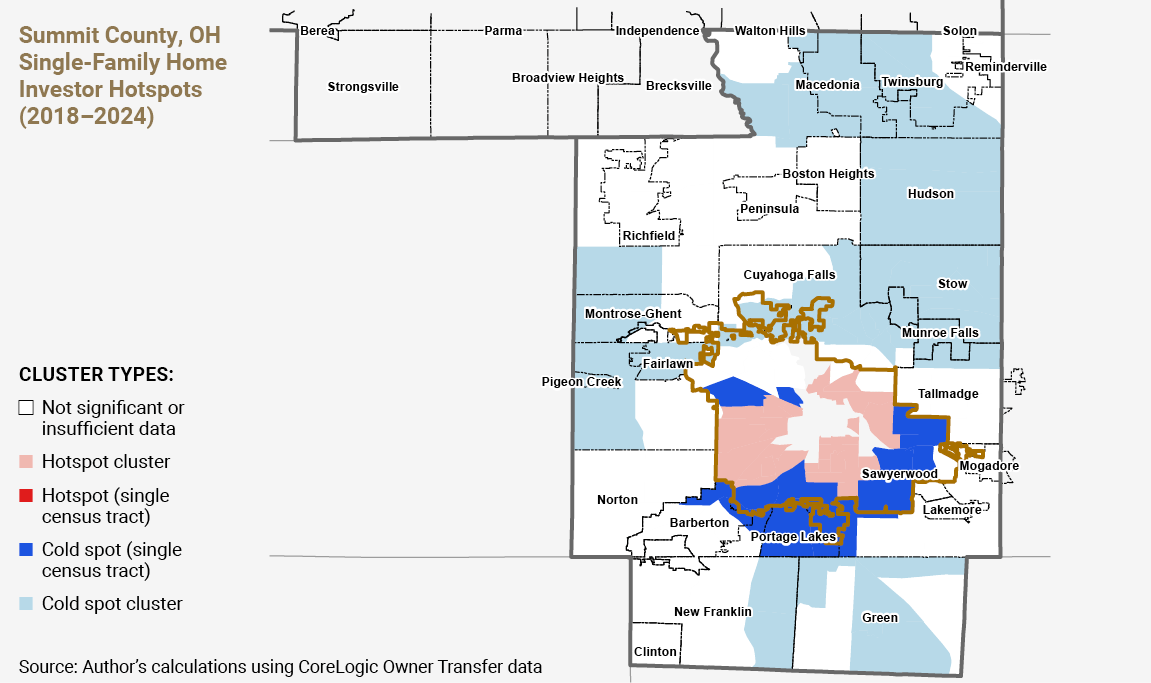
Identifying Investor Hotspots
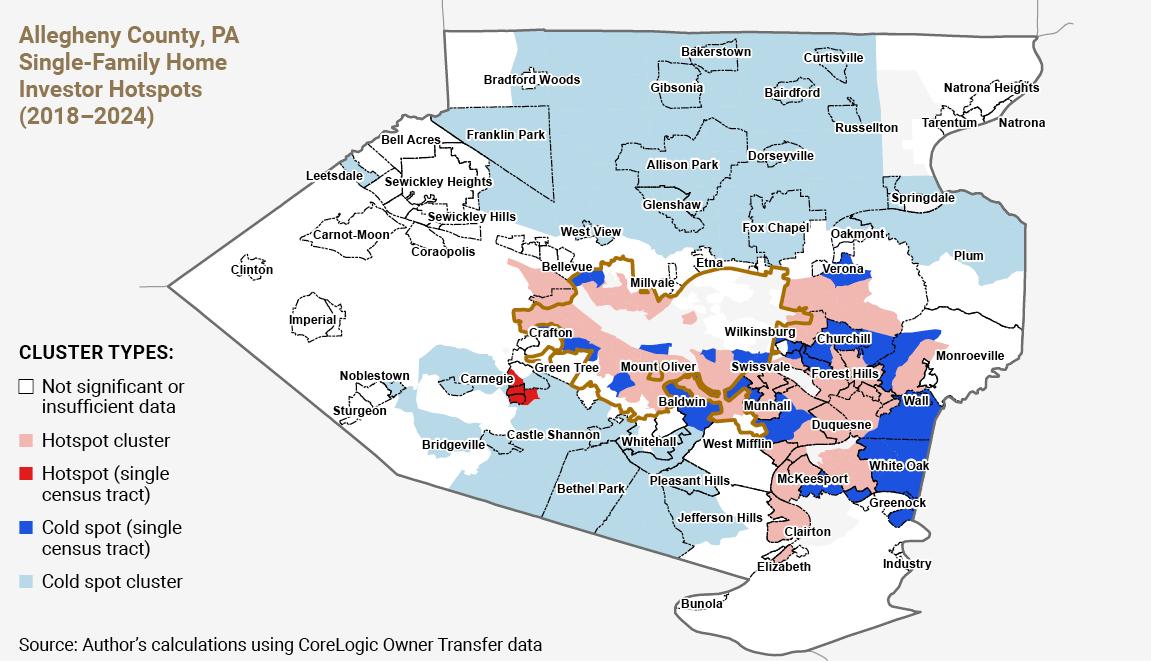
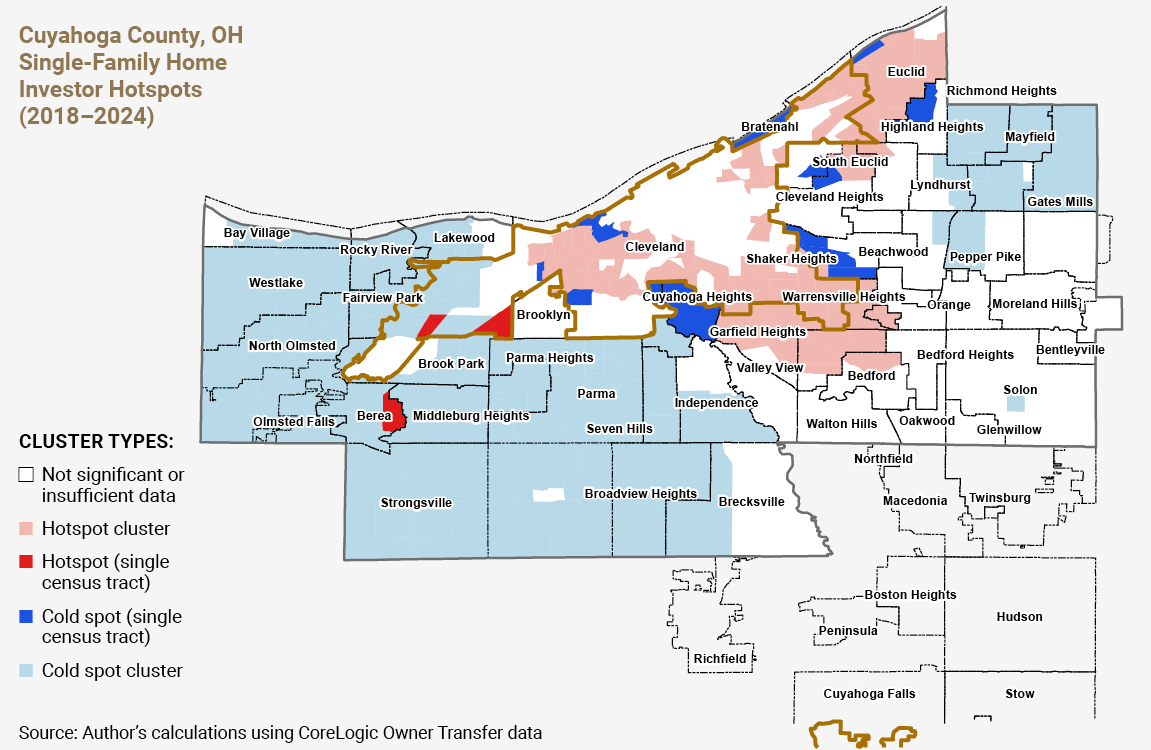
The share of SFH purchases made by investors throughout all seven counties rose from 13 percent in 2018 to 17 percent in 2021 and then to 22 percent in 2024. However, looking at only countywide trends can dilute what is occurring in smaller geographic areas and obscure their impact. To get a clearer picture of investor activity, a spatial analysis based on the share of SFH purchases made by investors is done to identify where the activity is geographically concentrated at the census tract level in each of the seven counties (see more on this process in the methodology section). These maps identify four cluster types:
- Hotspot (light red) or non-hotspot (or "cold spot") clusters (light blue): groups of census tracts containing either high or low levels of investor activity.
- Hotspot (dark red) or non-hotspot (or "cold spot") (dark blue) individual tracts: individual census tracts with high or low levels of investor activity.
|
Investor Hotspot Findings
These findings are based on several questions and concerns that we have heard around the Fourth District.
What types of neighborhoods do investors tend to operate in?
In the seven counties, these hotspot census tracts account for 11 percent of the land area, but in 2024, they accounted for 49 percent of investor purchases of SFHs (up from 44 percent in 2018). In addition, 79 percent of these hotspot census tracts are considered LMI compared to only 25 percent of the non-hotspot tracts. Table 1 compares the median neighborhood characteristics of hotspot and non-hotspot tracts based on the American Community Survey’s five-year estimates (2019–2023). Hotspot tracts had lower home values, rents, and price-to-rent ratios and higher shares of vacancy, non-white residents, and rent burden (the share of households spending more than 30 percent of their income on housing costs).
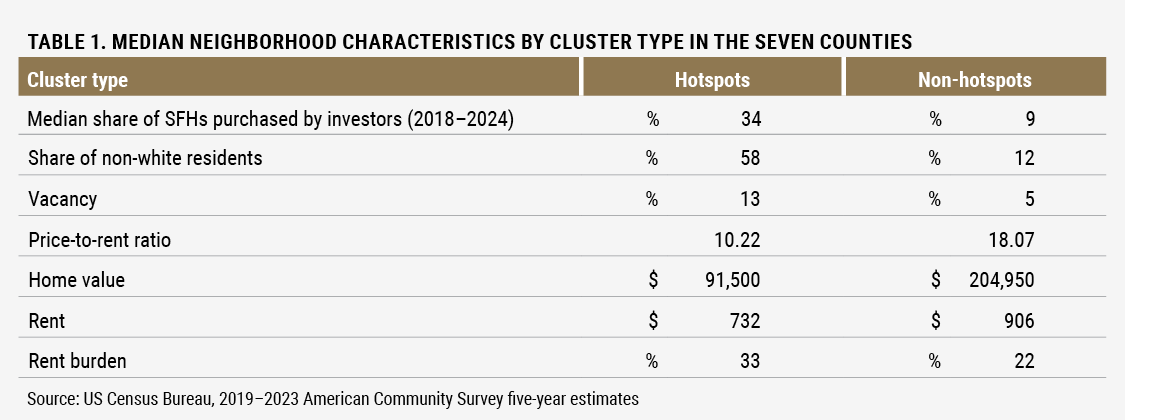
The results align with those in the academic literature. For example, Mills, Malloy, and Zarutskie (2016) found that investors seem to be drawn to markets with lower price-to-rent ratios (an indicator of an excess supply of homes for sale), which appear to offer a higher potential return on buying a home and renting it out. Also, Lee and Wylie (2024) found higher shares of investor activity in neighborhoods with lower housing values and higher shares of minority individuals.
What share of SFH purchases are made by investors, what share of SFHs are owned by investors, and how have those two shares changed over time?
One concern is that investors are accounting for an increasing share of SFH purchases, thus boosting the share of SFHs that are owned by investors. This concern stems partly from the fact that SFHs are traditionally owner-occupied, meaning that increased investor interest in purchasing SFHs puts investors in competition with traditional homebuyers (Stoney, 2024). But does this concern reflect what is really happening? Across the seven county hotspot census tracts, the share of all SFHs purchased by investors is indeed increasing. In 2024, 43 percent of SFH purchases were made by investors, up 9 percentage points from 2018. However, this has not boosted investors’ SFH ownership (which increased only 1.8 percentage points) as much as one might expect. Why? Because not all investor purchases actually increase investor ownership. For example, an investor could purchase a SFH from another investor, and this transaction would not increase the number of SFHs owned by investors because the owner type would not change.
Figure 1 breaks down SFH transactions into different combinations of who is buying or selling to whom within the seven county hotspot census tracts. The share of transactions between owner-occupants has declined steadily since 2018 (dark blue), while investor-related transactions have been increasing, though at different rates. The share of owner-occupant-to-investor transactions (dotted line), the type that could lead to increased shares of investor-owned SFHs, increased only 2.5 percentage points from 2018 through 2024. Meanwhile, the shares of investor-to-investor transactions (this would not change the share of SFHs owned by investors) and investor-to-owner-occupant transactions (this could decrease the share of investor-owned SFHs) increased 7 and 6 percentage points, respectively.
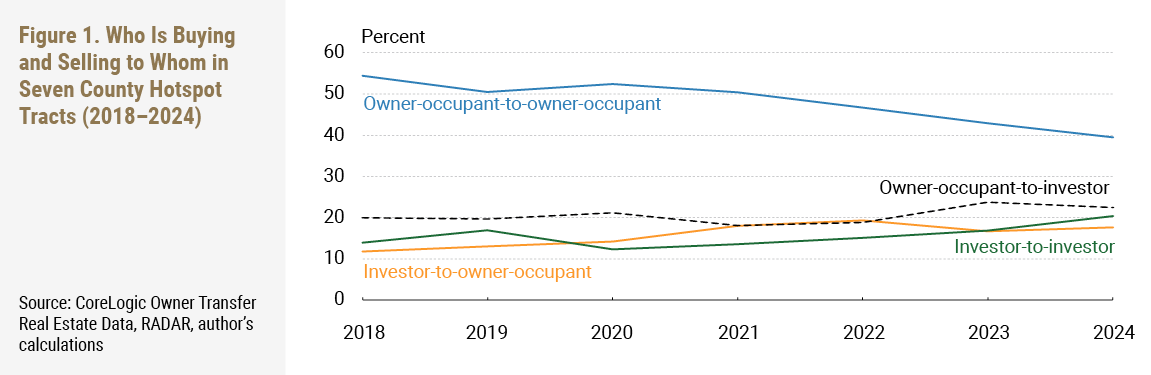
Table 2 shows the overall share of SFHs owned by investors in 2024, the percentage point change since 2018, and the percentage point change in the share of owner-occupant-to-investor transactions. The share of investor-owned SFHs was determined using CoreLogic ownership data. This dataset is available through 2024 for all the counties except Cuyahoga, for which it is available only through 2023. Within the seven county hotspot census tracts, investors owned 27 percent of SFHs in 2024, up 1.8 percentage points from 2018. The 2024 shares ranged from a high of 33 percent in Summit County to a low of 21 percent in Allegheny County. However, Allegheny County saw the largest increase since 2018 (+3.3 percentage points). For comparison, non-hotspot census tracts saw 9 percent of their SFHs owned by investors in 2024, an increase of only 0.3 percentage points since 2018. The share of owner-occupant-to-investor transactions (last column in Table 2) increased in every county except Cuyahoga, although Cuyahoga’s share was the highest of the seven counties in each of its years.
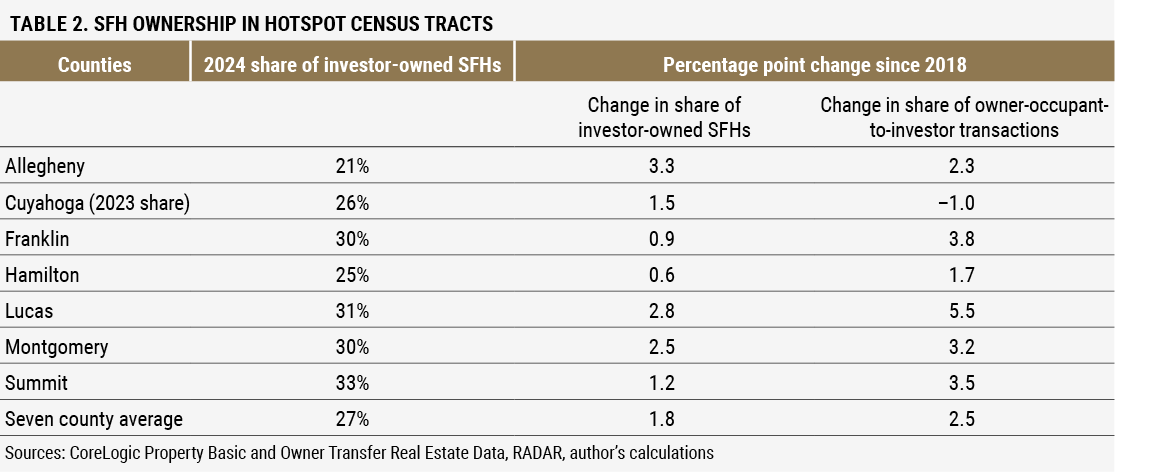
When looking at only the overall increase in the share of SFH purchases made by investors in the seven counties (+9 percentage points from 2018 through 2024), the 1.8 percentage point increase in the share of investor-owned SFHs might seem surprisingly low (Table 2). However, when focusing on only the transactions that can lead to greater shares of investor-owned SFHs (owner-occupant-to-investor transactions), then the changes in investors’ ownership share are less surprising.
What share of investor SFH purchases are made by out-of-state investors, what share of investor-owned SFHs are owned by out-of-state investors, and how have those two shares changed over time?
Another concern was about a potential increase in the share of SFH investor-owners that are from out of state, as anecdotal reports have suggested that they may be less responsive to tenant maintenance or repair requests than in-state investor owners (Horowitz and Starling, 2024). In fact, a 2023 survey of all occupied 1–3-unit homes in Cleveland (the primary city in Cuyahoga County) graded their exterior condition and found that 13 percent of occupied homes owned by out-of-state investors received grades of “D” or “F,” compared to 5 percent of all other occupied units (City of Cleveland and Western Reserve Land Conservancy, 2023). First, I look at whether the share of investor SFH purchases made by out-of-state investors has increased or decreased across the seven county hotspot census tracts from 2018 through 2024 (Figure 3). This includes both owner-occupant-to-investor and investor-to-investor transactions because both types can have out-of-state investors as purchasers. In 2024, three counties saw their shares remain above 2018 levels (Cuyahoga, Lucas, and Allegheny). Lucas County in particular has seen strong activity from out-of-state investors, as these investors have accounted for more than 50 percent of investor purchases of SFHs in the last three years (2022–2024), and just over half of that activity (51 percent) was attributed to investors from four states (California, Florida, New York, and Nevada). Out-of-state investors are drawn to the region’s low home prices, which are about $200,000 less than the national median (Picciotto, 2025).
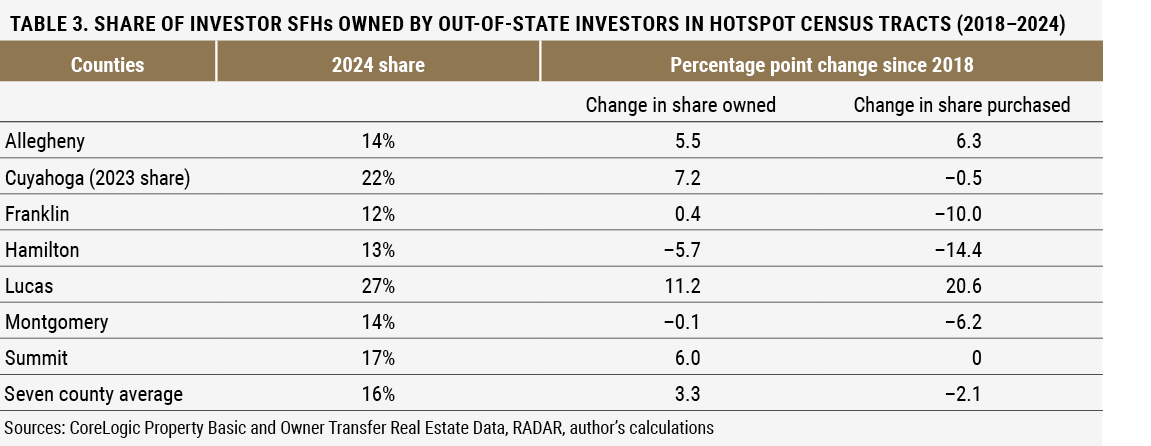
So, what about SFH ownership among out-of-state investors? Table 3 shows the overall share of investor-owned SFHs owned by out-of-state investors in 2024 across the seven county hotspot census tracts and the percentage point change in this share since 2018.4 Across the hotspot census tracts in the seven counties, out-of-state investors accounted for 16 percent of all investor-owned SFHs in 2024, an increase of 3.3 percentage points from 2018. Among the counties, out-of-state investors owned between 12 percent (Franklin County) and 27 percent (Lucas County) of SFHs, and the changes since 2018 ranged from −5.7 percentage points (Hamilton County) to +11.2 percentage points (Lucas County). One notable trend is that the three counties with the highest share of out-of-state investor purchases (as shown in Figure 3) also have the highest shares of out-of-state investor-owned SFHs and the largest increases in the share of out-of-state investor-owned SFHs (Table 3) since 2018 (Cuyahoga, Lucas, and Summit). By comparison, in non-hotspot census tracts, 8 percent of investor-owned SFHs were owned by out-of-state investors in 2024, an increase of 2 percentage points from 2018.
How often do investors use cash to purchase SFHs?
Most investors (60 percent) used cash to purchase SFHs in the seven county hotspot census tracts in 2024, but that share was down 19 percentage points from 2018. The numbers are comparable in non-hotspot census tracts, where investors used cash 64 percent of the time in 2024, a decrease of 15 percentage points from 2018. Although investors’ use of cash is decreasing, it remains their most common method of purchasing SFHs and is appealing to sellers, as sellers do not have to wait for the bank to make the mortgage, speeding up the closing process and reducing the risk of a deal falling through.
How often do SFH investors pull building permits?
This final question stems from the concern that investors make fewer repairs to their properties after purchase than owner-occupants. To answer this question, CoreLogic building permit data are used. Building permits can give an indication of when the owner of a property is making significant repairs or improvements such as upgrading the electrical system or replacing the roof. However, because the data are not available for all municipalities in the seven counties, each county’s primary city is used instead (see more in the methodology section). Figure 4 compares the share of investors to the share of owner-occupants in the hotspot census tracts who pull building permits within six months of purchasing the SFH. In five of the cities, investors pull permits at a higher rate (purple bars) than owner-occupants (green bars) (Akron, Cincinnati, Columbus, Dayton, and Pittsburgh), an indication that they are making repairs to their properties. This makes sense because investors tend to purchase homes that are older, smaller, less expensive, and more likely to require repairs and updates. However, this is not the case in Cleveland and Toledo, where owner-occupants pull permits at a slightly higher rate. This is in line with findings from an analysis of real estate investor activity in Cuyahoga County (which includes the city of Cleveland) by the Vacant and Abandoned Property Action Council. They found that investors pulled permits within six months of purchase at a lower-than-expected rate given the condition of the homes. They concluded that some investors are speculating (buying a property with the intention of reselling at a higher price), while others might be making repairs without permits or moving tenants in without making repairs. Taking this one step further is a comparison of the share of in-state and out-of-state investors that pull permits in the hotspot census tracts. From 2018 through 2024, in-state investors pulled permits at a higher rate (7.9 percent) than out-of-state investors (4.9 percent). Dayton was the only city that saw out-of-state investors pull permits at a higher rate than in-state investors during this period.
Conclusion
For some time, communities have been grappling with the increase of investor-owned SFHs and what that means for their neighborhoods. With that in mind, this report focuses on trends in areas with high levels of investor activity in seven large counties in the Fourth Federal Reserve District from 2018 through 2024.
During this seven-year period, the share of SFH purchases made by investors in these hotspot census tracts increased steadily in all seven counties, and that activity was concentrated in LMI neighborhoods, which is where much of the affordable housing is located. However, because a substantial portion of this activity involves transactions between investors, it has not translated into a particularly large increase in the share of investor-owned SFHs in these neighborhoods. On the other hand, the share of investor ownership accounted for by out-of-state investors has seen a larger increase, particularly in Lucas County. While most investors still use cash for SFH purchases, it has become less common. Investor-owners tend to pull building permits at a higher rate than owner-occupants, indicating that investor-owners may be improving and repairing these properties at higher rates, though this has not been the case across all the hotspot census tracts in recent years.
Data Methodology
Identifying investor-owned SFHs in the data
This analysis uses CoreLogic property transaction data from 2018 through 2024 and focuses exclusively on single-family homes based on land use codes. Transactions must be arm’s length deals, and the sale amount must be at least $1,000 to exclude potential gift sales. Mobile homes, family transfers, real estate owned (REO) property, and property in foreclosure by a bank are excluded.5 For every transaction, the buyer and seller are flagged as an “investor,” “owner-occupant,” or “other,” and the buyer is classified as in state or out of state. Investors are defined as any entity with a name that contains keywords such as “LLC,” “co,” or “corp” or that averages two transactions per year during the period studied. The “other” category refers to entities such as land banks, homebuilders, cities, and churches, all of which are excluded from the calculations.
Spatial cluster analysis
For the analysis, census tracts had to have at least 70 investor transactions from 2018 through 2024 to remove outliers. The share of SFH purchases made by investors was calculated for the remaining census tracts, and this variable was analyzed using the Local Moran’s I spatial statistic to return clusters of high and low activity for each of the seven counties. For example, a hotspot cluster would occur if a census tract with a high share was surrounded by neighboring tracts with high shares. These clusters were the focus of the analysis.
Building permit calculations
This analysis excludes nonconstruction permits containing keywords such as “zoning,” “occupancy,” or “disclosure,” which leaves permits for things such as mechanicals, electric, roof, and plumbing improvements. This analysis does not control for any building characteristics such as house size or the number of bedrooms.
References
- “City of Cleveland Property Inventory.” 2023. ArcGIS StoryMaps. July 20. https://storymaps.arcgis.com/stories/943f26c946994574a8d5f05cecf10a59.
- “Community Advisory Council.” 2025. https://www.clevelandfed.org/about-us/advisory-councils/community-advisory-council.
- “Community Issues and Insights.” 2025. https://www.clevelandfed.org/publications/community-issues-and-insights.
- Ding, Lei, Sisi Zhang, and Mckenzie Diep. 2025. “Ownership Profile of Single-Family Residence Properties in Philadelphia: A Focus on Large Corporate Investors.” Federal Reserve Bank of Philadelphia. https://www.philadelphiafed.org/community-development/housing-and-neighborhoods/ownership-profile-of-single-family-residence-properties-in-philadelphia-large-corporate-investors.
- Horowitz, Ben, and Libby Starling. 2024. “Rise in Investor-Owned Single-Family Rentals Prompts Policy Responses.” Federal Reserve Bank of Minneapolis. https://www.minneapolisfed.org/article/2024/rise-in-investor-owned-single-family-rentals-prompts-policy-responses.
- Kusisto, Laura, and Christina Rexrode. 2017. “Want That House? You’d Better Pay in Cash.” The Wall Street Journal, December 5. https://www.wsj.com/articles/want-that-house-youd-better-pay-in-cash-1512469800.
- Ky, Kim-Eng, Amani Samuels, and Libby Starling. 2023. “Investor-Owned Homes Ebb and Flow in the Minneapolis-St. Paul Region.” Federal Reserve Bank of Minneapolis. https://www.minneapolisfed.org/article/2023/investor-owned-homes-ebb-and-flow-in-the-minneapolis-st-paul-region.
- Lee, Keyoung, and David Wylie. 2024. “Institutional Investors, Rents, and Neighborhood Change in the Single Family Residential Market.” Working Paper No. 24-13. Federal Reserve Bank of Philadelphia. https://doi.org/10.21799/frbp.wp.2024.13.
- Ludden, Jennifer. 2022. “It’s Harder to Buy a House. This City Fought Back by Outbidding Corporate Landlords.” NPR, November 3. https://www.npr.org/2022/11/03/1132358911/mortgage-rates-inflation-real-estate-housing.
- Mills, James, Raven Molloy, and Rebecca Zarutskie. 2019. “Large-Scale Buy-to-Rent Investors in the Single-Family Housing Market: The Emergence of a New Asset Class.” Real Estate Economics 47 (2): 399–430. https://doi.org/10.1111/1540-6229.12189.
- Picciotto, Rebecca. 2025. “Battle of Home Buyers vs. Investors Is Making Toledo a Housing ‘Gold Mine’.’” The Wall Street Journal, April 26. https://www.wsj.com/real-estate/housing-market-rankings-toledo-ohio-ab3a852f.
- Putzier, Konrad, and Will Parker. 2022. “Cincinnati Agency Buys Nearly 200 Rental Homes, Thwarting Private Investors.” The Wall Street Journal, January 18. https://www.wsj.com/real-estate/cincinnati-agency-buys-nearly-200-rental-homes-thwarting-private-investors-11642510803.
- Stoney, Sierra. 2024. “The Roles of Single-Family Housing Investors, Big and Small, in the Fifth District.” Federal Reserve Bank of Richmond. Econ Focus 2024 (Fourth Quarter). https://www.richmondfed.org/publications/research/econ_focus/2024/q4_district_digest.
- Zinn, Amalie. 2023. “What Policymakers Should Know about Institutional Investors’ Role in the Housing Market.” Urban Institute. Housing Matters, October 4. https://housingmatters.urban.org/articles/what-policymakers-should-know-about-institutional-investors-role-housing-market.
Endnotes
- LMI refers to those with income of less than 80 percent of Area Median Income. Non-LMI refers to those with income of greater than or equal to 80 percent of Area Median Income. This report uses the 2024 Federal Financial Institutions Examination Council (FFIEC) file. Return to 1
- The Fourth Federal Reserve District includes all of Ohio, eastern Kentucky, western Pennsylvania, and the northern panhandle of West Virginia. Return to 2
- Because these data are not available for all municipalities in the seven counties, each county’s primary city is used instead: Akron (Summit County), Cincinnati (Hamilton County), Cleveland (Cuyahoga County), Columbus (Franklin County), Dayton (Montgomery County), Pittsburgh (Allegheny County), and Toledo (Lucas County). Return to 3
- Cuyahoga County data were available only through 2023, while data for the other counties were available through 2024. Return to 4
- REO property is defined as property that is owned by a bank, government organization, or another lender after an unsuccessful sale at a foreclosure auction or deed in lieu of foreclosure. Return to 5
Suggested Citation
Klesta, Matt. 2025. “Hotspots: Investor-Owned Home Trends from Select Counties in Ohio and Pennsylvania (2018–2024).” Federal Reserve Bank of Cleveland, Community Development Reports. https://doi.org/10.26509/frbc-cd-20250904
This work by Federal Reserve Bank of Cleveland is licensed under Creative Commons Attribution-NonCommercial 4.0 International

