

- Share
Where Could Reshoring Manufacturers Find Workers?
The United States has lost millions of manufacturing jobs in recent decades, but a variety of policies have been enacted to incentivize the creation of manufacturing jobs in America. This District Data Brief analyzes where manufacturers might find US workers to fill these roles.

The views authors express in District Data Briefs are theirs and not necessarily those of the Federal Reserve Bank of Cleveland or the Board of Governors of the Federal Reserve System. The series editor is Harrison Markel.
Introduction
The announcement of new tariffs this year has reignited the discussion of whether the United States can expand its manufacturing employment by millions of workers. Reversing decades of manufacturing job losses is one explicit goal of the new higher tariffs. This District Data Brief presents measures of employment and demographics as context around the current and potential employment in US manufacturing. Raising manufacturing employment by 4 to 6 million workers would constitute a large increase relative to current levels. However, an increase of this scale would not be large relative to the global growth of manufacturing employment in recent decades, the current US labor force size, or the number of US adults not engaged in high-paying work.
With different priorities and approaches, policymakers have spent much of the past decade addressing issues related to the loss or absence of manufacturing in the United States. For example, America’s dependence on imported manufactured goods was highlighted at the beginning of the COVID-19 pandemic as supply chain disruptions led to shortages of medical equipment, pharmaceuticals, microchips, and other products. The CHIPS and Science Act and the Inflation Reduction Act featured tax breaks and subsidies to expand US manufacturing capacity for semiconductors, electric vehicles, and renewable energy equipment.
At the same time, economists have been documenting the loss of work opportunities and earning power by workers without college degrees as manufacturing employment has declined. In 2013, David Autor, David Dorn, and Gordon Hanson published a study that estimated the labor market impacts resulting from increased trade competition following China’s entrance into the World Trade Organization, an effect often referred to as the “China shock.”1 Dozens of studies have since used the regional variation in job and income losses caused by the China shock to measure the adverse impacts of job displacement on family structures, crime, health, and other social indicators.2 Some supporters of industrial subsidies and higher tariffs have expressed the hope that these dynamics can be put into reverse.
How Many Manufacturing Jobs Went Away and How Many Remain?
The discussion of whether reshoring is possible needs to begin with a basic question: How many workers would this include? In the United States today, approximately 12.8 million people work in manufacturing, representing 8.1 percent of all nonfarm payroll employment. As shown in Figure 1, manufacturing employment accounted for more than 30 percent of all nonfarm employment from 1939 until 1957, peaking at 38 percent during World War II. Manufacturing employment peaked in absolute numbers in 1979 at 19.4 million.
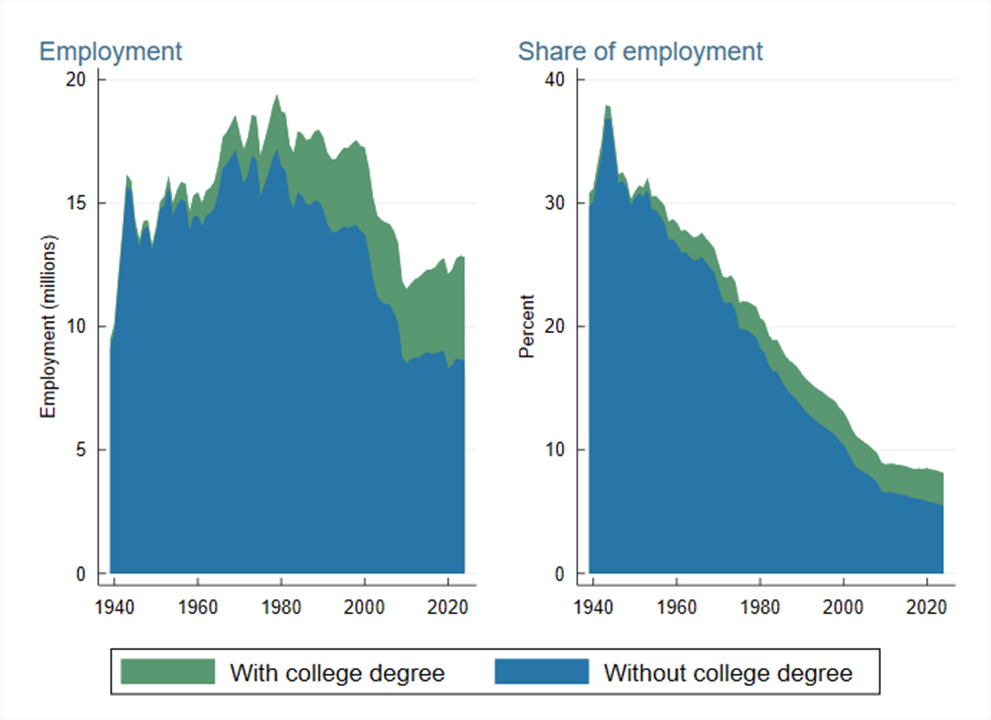
Sources: Bureau of Labor Statistics, Decennial Censuses, American Community Surveys, and author’s calculations
US manufacturing employment fluctuated around 17 million workers through the late 1990s and did not keep pace with population and labor force growth. Steep drops in factory jobs during the 2001 recession and the Great Recession were never fully reversed. From 1979 to 2025, employment in the United States grew by 68 million, while manufacturing employment fell by 6.6 million. During this period, manufacturing jobs for people without college degrees declined by roughly 7.9 million. However, these losses were partially offset by jobs created in the sector for workers with college degrees. These include workers at goods-producing firms that do engineering, design, marketing, and other professional work in the United States but contract out all their production overseas. Although roughly one-third of manufacturing jobs are currently filled by workers with college degrees, this District Data Brief focuses on workers without degrees because the production work that may be reshored holds much more opportunity for non-college graduates than for graduates.
A reindustrialization effort in the United States that added back all 6.6 million manufacturing jobs that were lost would represent a 52 percent increase over the current number of workers in the sector nationwide. In today’s much larger economy, manufacturing’s employment share would reach only 12.3 percent (compared to, for example, 22 percent in 1979) if all 6.6 million of these workers switched to manufacturing from other sectors.3 Getting manufacturing back up to its 1979 share of 22 percent would require increasing the sector’s employment to 34.7 million.
Is There Growth in Manufacturing Employment Globally?
A frequently cited challenge to substantively increasing manufacturing employment is that improved automation means that factories do not need as many people as they used to. However, it is also the case that population growth and economic development around the world have increased demand for manufactured products so that, on net, factory employment is up by 71 million globally since 2000. As shown in Figure 2, China has added just over 40 million people to its manufacturing workforce over this period, while India and Vietnam have added 9.2 million and 6.8 million, respectively.4 Currently, manufacturing employment in China is reported to be more than 85 million, six and a half times higher than that of the United States (see Figure A1). For context, the population of China is only four times higher than that of the United States.
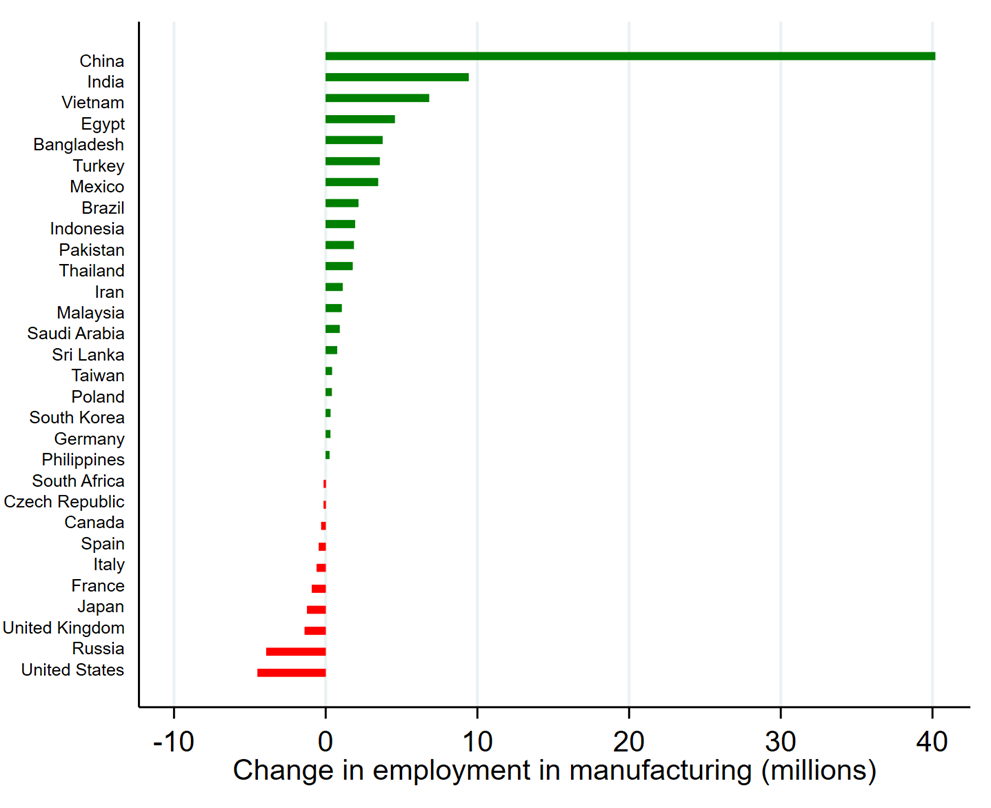
Source: United Nations Industrial Development Organization (UNIDO)
When firms operate factories in high-wages countries, they have a financial incentive to invest in the best automation available to achieve enough production to cover the high wages of their workers. When factories are moved to low-wage countries, additional labor can be less expensive than additional machinery, so more workers are hired. In recent decades, firms have found it more profitable to either operate less-automated factories in low-wage countries or even combine automation with low-wage workers to realize additional cost savings. Governments can intervene through tariffs or subsidies to try to offset the cost advantages of low-wage production and motivate firms to place their factories in high-wage countries.
Since 2000, US manufacturing employment has declined by 4.5 million, equivalent to around 6 percent of net global growth of 71 million during the same period. However, if production had not been shifted away from the United States and other high-wage countries like the United Kingdom and Japan, global growth in manufacturing employment (represented by the green bars in Figure 2 and occurring almost entirely in low-wage countries) very likely would have been lower in this period. For example, manufacturing workers in the United States produce approximately three to four times as much per hour, measured by the value of the products when sold, as workers in low-wage countries. Assuming US manufacturing workers would have been assisted by additional productivity-enhancing equipment and produced as much as three or four of the low-wage workers, retaining 4.5 million workers in the United States during this period would have caused manufacturing employment growth to be 16 or 21 percent lower, respectively, in the rest of the world, though growth still would have been positive.
Where Are US Workers Facing Trade Competition?
Before identifying geographic regions within the United States where manufacturers might expand, we need to consider which types of products the United States is currently producing and which product markets are dominated by foreign producers. Linking trade data to regional employment data enables us to identify industry clusters that have more potential to expand employment by increasing their US market share. Table 1 shows the dollar value of imports and exports in the 30 product categories with the highest total flows (imports plus exports). In categories where imports are much higher than exports, such as apparel, foreign production has cost much less than US production for many years. On one hand, this means that US employment in that type of production is low and that regaining domestic markets would involve large increases in employment. On the other hand, growth opportunities in these subsectors are limited to domestic markets. It is unlikely that the United States would be able to export in these industries because tariffs would not close the gap in costs (especially labor costs) between US and foreign production. In categories where exports are much higher than imports, such as aircraft, US production is already competitive globally, and US producers already meet most domestic demand. Capturing additional domestic market share with tariffs in these industries would involve smaller proportional increases in employment relative to the US labor force that is presently supplying global markets.

Source: Trade USA
Table 2 presents estimated counts of manufacturing workers without college degrees, split by whether the United States is a net exporter or net importer in the product category. The counts are shown for major Fourth District metro areas and for metro areas across the nation with the highest populations of these workers. All other regions of the country are included in the aggregate categories. Not surprisingly, the metro areas with the largest populations, including Los Angeles, Chicago, and New York, also have the largest number of workers without college degrees working in manufacturing and facing trade competition. As such, those metro areas stand to gain the most from expanded manufacturing employment. However, the large regions that still have high counts of workers in manufacturing tend to also have diversified economies, so manufacturing employment is usually a below-average (<6.5 percent) share of their total employment. This means any manufacturing gains would generally be less consequential in these regions than in smaller regions more reliant on the industry such as Cleveland and Cincinnati.
Longstanding economic literature has documented the countervailing forces of “agglomeration” and “dispersion” in manufacturing activity.5 The concept of agglomeration indicates that firms in a product category benefit from clustering in specific regions, using the same suppliers and infrastructure, and hiring skilled workers from competitors. On the other hand, the concept of dispersion indicates that there are cost savings from moving production out of congested areas to regions with inexpensive land and labor. The former suggests regions with existing production clusters would benefit more from manufacturing employment growth, while the latter suggests gains would be widely spread across low-cost regions. In Table 2, the number of production clusters is reported for each region, with a cluster defined as having 5,000 workers without college degrees in one product category. The specific clusters are listed by region and product category in Table A1. Because the major metro areas have larger scale, more of their factory categories have enough workers to be considered clusters. However, in the national aggregate, only 20 percent of manufacturing workers are in clusters, while most manufacturing production in the United States is dispersed.

Sources: American Community Surveys, 2019–2023 via Integrated Public Use Microdata Series (IPUMS) and author’s calculations
Note: Green shading indicates that the region is part of the Fourth District.
What US Regions Have Added Manufacturing Employment Recently?
As another approach to identify regions likely to benefit from reshoring, one can look at where manufacturers have been able to expand operations over the last decade. If manufacturing can operate outside of regional clusters, as appears usually to be the case, one would expect firms to select locations with low costs for labor, land, and utilities and lower tax and regulatory burdens. Table 3 presents the 20 US regions that had the most manufacturing employment growth from 2013 through 2023. Several midwestern metro areas made the list because of the recovery of the auto industry after the Great Recession. However, more metro areas that saw substantial growth are in the South and Mountain West.

Source: American Community Survey five-year data, 2013 and 2023 (via IPUMS) and author’s calculations
Notes: Green shading indicates that the region is part of the Fourth District. Counts include only respondents without college degrees.
Where Are Potential Factory Workers Geographically?
Having looked at where factory employment is located, and where it has expanded recently, we can turn attention to regional differences in the populations of potential factory workers, including the unemployed, workers with low earnings, and working-age adults not in the labor force. The US unemployment rate was near historical lows in the three years before the pandemic and has been near these lows in the three years since the pandemic ended. Considering only the approximately 7 million people currently unemployed, it would seem that manufacturers would have to hire a vast majority of them to reverse manufacturing’s declines.6 If manufacturers actually did hire most of the people looking for work, the labor market would tighten to an unsustainable degree. Alternatively, unemployed workers could be hired into factories in combination with new entrants to the labor force and workers hired away from other sectors. Which industries might experience declining employment shares—or absolute declines in employment—if manufacturers successfully attract workers to switch into their sector?
When workers are well compensated in other industries, this signals that they have in-demand skills, that they are adding value at least as high as their wages, and that manufacturers would need to outbid a high wage to recruit them. However, there are 10 million people across the United States who are employed but whose household income is still low (below 150 percent of the federal poverty line). Some portion of this population could be attracted into manufacturing positions if the wages offered were appreciably above their current wages and compensated them for any important differences in the work environment.
Additionally, there are 7.2 million working-age adults who are neither working nor looking for work, not in school, and whose household income is below 150 percent of the federal poverty line.7 With these low household incomes, it is unlikely that those working-age adults are out of the labor force because they are comfortably supported by a spouse or partner or by investment income. Rather, these are likely people who might be drawn into the labor market if new opportunities enable them to overcome barriers to employment such as affording reliable transportation and childcare.
Substantial numbers of these low-income workers and potential workers can be found in most regions of the United States. Table 4 lists estimates of the largest populations of these individuals nationally and in the Fourth District. The largest metro areas of the country by themselves have 4.7 million of these individuals, while there are another 1.1 million in the Fourth District and another 13.2 million in the remainder of the country. While some labor markets would tighten if a major expansion of manufacturing got underway, it appears that workers would likely be widely available in many areas. The location of establishments could be determined based on the nonlabor costs mentioned above (land, utilities, taxes, and regulation).
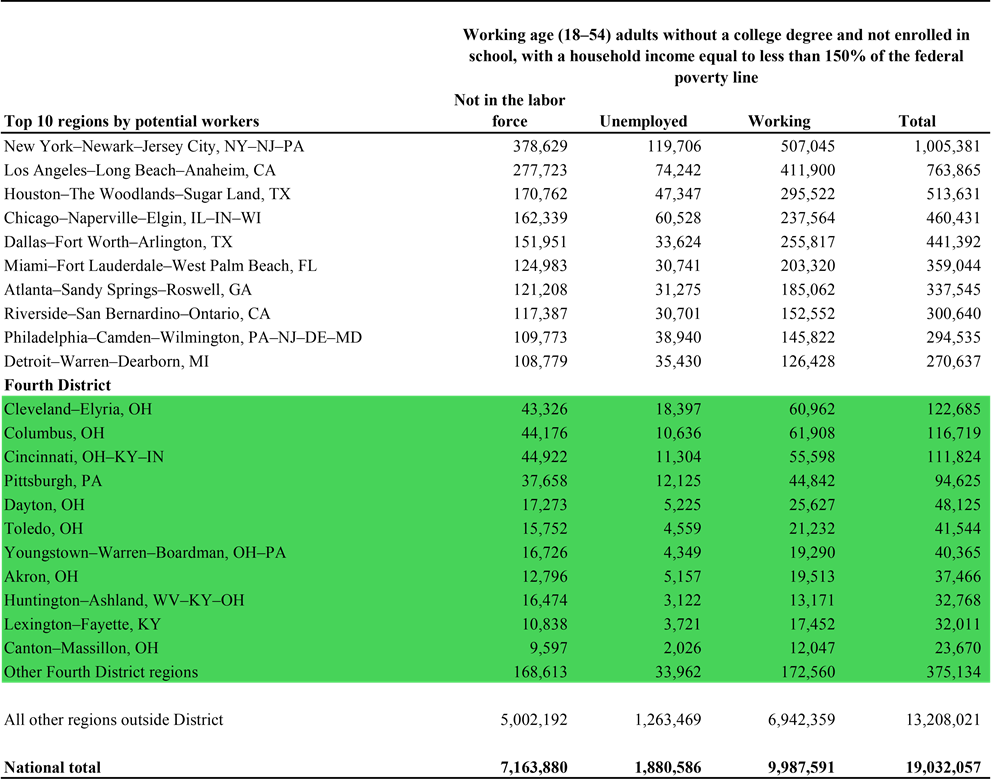
Source: American Community Surveys, 2019–2023 (via IPUMS) and author’s calculations
Note: Green shading indicates that the region is part of the Fourth District.
What Sectors Do Manufacturers Hire People Away From?
A large expansion of manufacturing employment would change the US economy along many dimensions, and it would be difficult to predict how wages would evolve in each sector. We can, however, observe the flows of people into and out of manufacturing in the recent past. Using the last five years of Current Population Survey data, I identify every worker without a college degree that reports entering or exiting the manufacturing sector. I then calculate the industry shares of those flows. Table 5 displays the flows by sector (flows by individual industry can be found in Table A1) along with the median wage of the workers when they are in the non-manufacturing positions. The largest flows are with the retail sector, particularly restaurants and bars, grocery stores, and department stores. The typical wages are substantially lower (approximately $17 per hour versus $20 in manufacturing), suggesting manufacturers should be able to draw workers out of the retail sector. Similarly, manufacturing may pull workers out of the agriculture and personal services sectors. By contrast, the construction and mining sectors appear to be paying wages that are as high or higher than wages in manufacturing. Construction provides the second-largest flow of people into manufacturing despite this frequently involving a step-down in wages. The red shading in Table 5 indicates that the median wages earned in the other industries were lower than the median wages earned in manufacturing by the transitioning workers.

Sources: Current Population Survey (CPS), 2021–2025 (via IPUMS-CPS) and author’s calculations
Notes: Wages were inflation-adjusted to 2025 dollars before the medians were identified. Red shading indicates that the median wages earned in the other industries were lower than the median wages earned in manufacturing by the transitioning workers. Workers exiting manufacturing had a median wage of $19.84 before exiting, and workers entering manufacturing had a median wage of $20.43 after entering.
Where Do Young People Who Could Start Careers in Manufacturing Live?
The figures in the preceding sections reflect the population that could potentially join the manufacturing workforce at present, but investments in manufacturing facilities will likely be directed where firms can expect to hire workers over the next decade or longer. A recent update of the Autor, Dorn, and Hanson analysis showed that the transition away from manufacturing was fueled mostly by young people’s starting their careers in other sectors. Thus, reversing this trend by attracting recent high school graduates to manufacturing might be necessary to rebuild the manufacturing workforce.8 It is possible to observe where future workers—young people aged 10 to 18—live today, but some assumptions are needed to translate this into estimates of future worker numbers. Table 6 shows the counts of young people in various regions. In the third column, the count of young people without college degrees set to enter the labor force is calculated by multiplying the current youth counts by the ratio of non-degree-holding young workers (ages 20–28) in the region in 2023 to the count of young people (ages 10–18) in the region in 2013.9 This ratio reflects the share of these youth that remained in the region and did not complete college. To account for flows out of the labor force that occur along with inflows, the fourth column provides the count of non-degree-holding current workers aged 60 to 68, who are likely to retire in the next 10 years.
The major metro areas in which young workers without college degrees might outnumber retirees without college degrees in the next decade are mostly places that saw strong population growth in the early 2000s such as Seattle, Atlanta, Orlando, and Tampa. Although Fourth District metro areas including Cleveland, Dayton, Toledo, and Erie are seeing flat or declining populations, it still appears that the number of labor market entrants without college degrees will exceed the number of retirees without college degrees in these metro areas over the next decade.
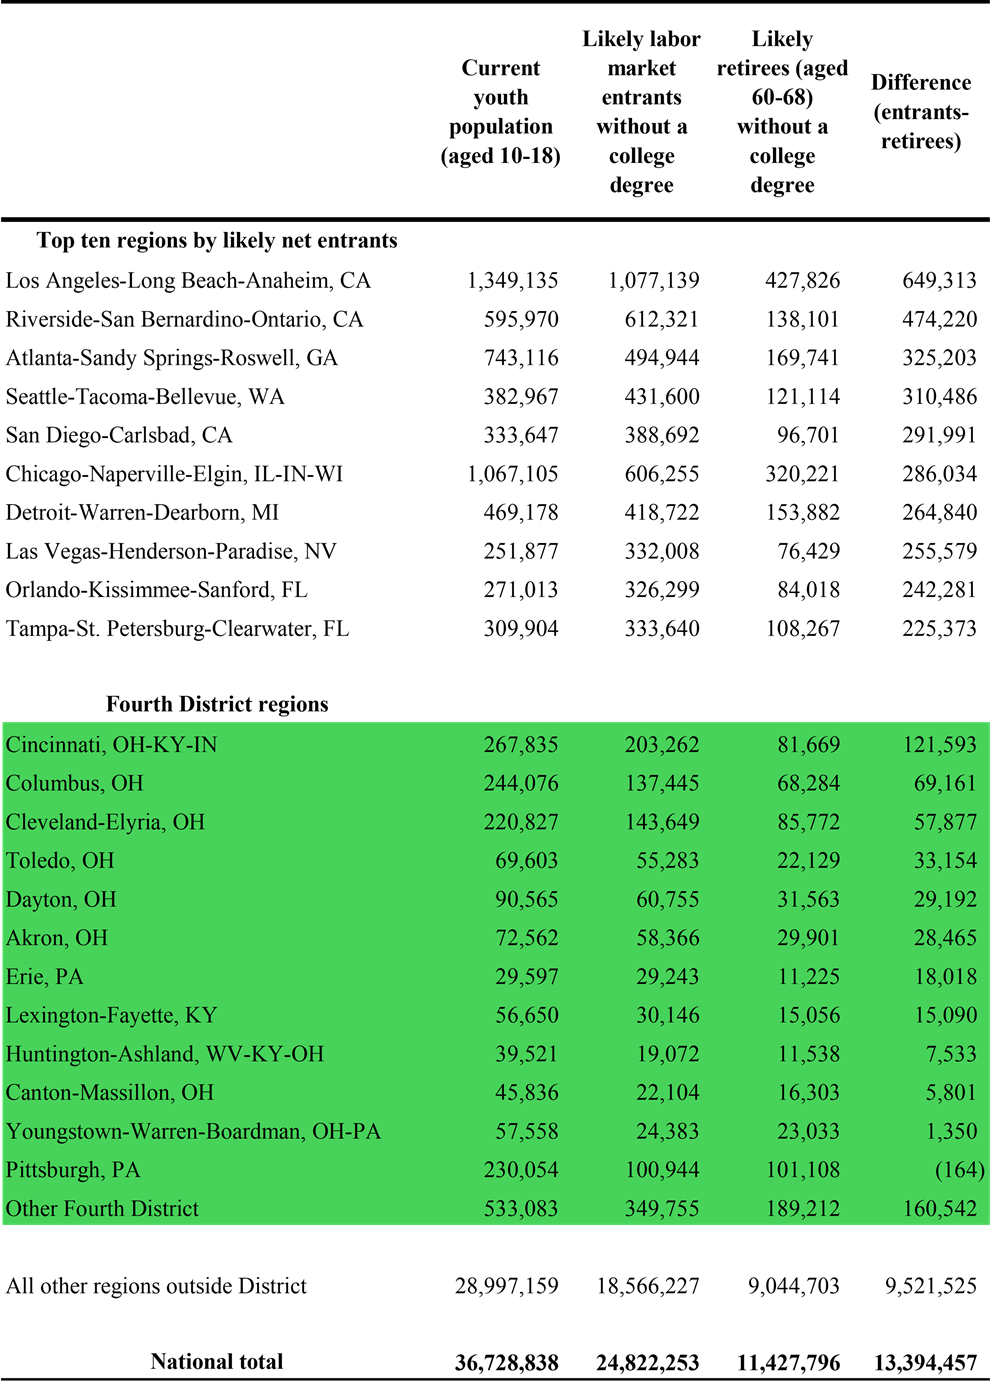
Sources: American Community Surveys, 2009–2013 and 2019–2023 (via IPUMS) and author’s calculations
Notes: Green shading indicates that the region is part of the Fourth District. The youth figures were estimated for US-born people only. International migrants could supplement these figures in any location.
Conclusion
Manufacturing employment in the United States fell by 2.1 million workers from 1979 to 2000. Since 2000, US manufacturers have shed another 4.5 million jobs despite manufacturing employment growing worldwide by 71 million. Given the current size of the US labor force, increasing manufacturing employment by 6.6 million would involve reallocating just under 4 percent of US workers.
Based on a combination of trade, employment, and demographic data, this District Data Brief uncovers a variety of patterns relevant to the evolution of the manufacturing sector. Most manufacturing employment is in categories where the United States imports more (by value) than it exports, so employment could grow if US producers gain domestic market share. Manufacturing production in the United States appears to be widely dispersed across many regions, but there are clusters of employment in the largest metro areas and in legacy manufacturing centers. Regions that have added manufacturing employment recently are mostly in the South and Mountain West. Metro areas that saw strong population growth 20 years ago, such as Atlanta and Las Vegas, have relatively large pools of young people who will be reaching working age soon. Alternatively, workers and working-age adults who are low-income and might be drawn to higher-paying opportunities in manufacturing are present in substantial numbers in most regions of the country. The relative importance of clustering versus finding the lowest-cost location—and having a growing labor force versus low labor costs—will determine which regions benefit most from any upcoming growth in manufacturing.
References
- Autor, David H., David Dorn, and Gordon H. Hanson. 2013. “The China Syndrome: Local Labor Market Effects of Import Competition in the United States.” American Economic Review 103 (6): 2121–68. https://doi.org/10.1257/aer.103.6.2121.
- Autor, David H., David Dorn, Gordon H. Hanson, Maggie R. Jones, and Bradley Setzler. 2025. “Places versus People: The Ins and Outs of Labor Market Adjustment to Globalization.” Working Paper No. 33424. National Bureau of Economic Research. https://doi.org/10.3386/w33424.
- Bureau of Labor Statistics. 2025. Table A-4. Employment Status of the Civilian Population 25 Years and over by Educational Attainment - 2025 M04 Results. https://www.bls.gov/news.release/empsit.t04.htm.
- Crafts, Nicholas, and Alexander Klein. 2021. “Spatial Concentration of Manufacturing Industries in the United States: Re-Examination of Long-Run Trends.” European Review of Economic History 25 (2): 223–46. https://doi.org/10.1093/ereh/heaa027.
- Dorn, David, and Peter Levell. 2024. “Labour Market Impacts of the China Shock: Why the Tide of Globalisation Did Not Lift All Boats.” Labour Economics 91 (December): 102629. https://doi.org/10.1016/j.labeco.2024.102629.
- Holmes, Thomas J., and John J. Stevens. 2004. “Spatial Distribution of Economic Activities in North America.” In Handbook of Regional and Urban Economics, edited by J. Vernon Henderson and Jacques-François Thisse, vol. 4. Elsevier. https://doi.org/10.1016/S1574-0080(04)80020-8.
Footnotes
- Autor, David H., David Dorn, and Gordon H. Hanson. 2013. “The China Syndrome: Local Labor Market Effects of Import Competition in the United States.” American Economic Review 103 (6): 2121–68. https://doi.org/10.1257/aer.103.6.2121. Return to 1
- Dorn, David, and Peter Levell. 2024. “Labour Market Impacts of the China Shock: Why the Tide of Globalisation Did Not Lift All Boats.” Labour Economics 91 (December): 102629. https://doi.org/10.1016/j.labeco.2024.102629. Return to 2
- If some of the new manufacturing workers come from outside the current labor force, the additional labor force growth would keep manufacturing’s share slightly lower. For example, if one-third of 6.6 million new manufacturing jobs were filled by people who would not otherwise be in the labor force, the manufacturing share would be 12.1 percent. Return to 3
- These calculations are based on data collected and standardized by the United Nations Industrial Development Organization (UNIDO). UNIDO uses the official estimates from China’s National Bureau of Statistics. Other published estimates, which use different surveys and definitions, suggest that more than 100 million people are employed in manufacturing in China. Return to 4
- Crafts, Nicholas, and Alexander Klein. 2021. “Spatial Concentration of Manufacturing Industries in the United States: Re-Examination of Long-Run Trends.” European Review of Economic History 25 (2): 223–46. https://doi.org/10.1093/ereh/heaa027.
Holmes, Thomas J., and John J. Stevens. 2004. “Spatial Distribution of Economic Activities in North America.” In Handbook of Regional and Urban Economics, edited by J. Vernon Henderson and Jacques-François Thisse, vol. 4. Elsevier. https://doi.org/10.1016/S1574-0080(04)80020-8. Return to 5 - Bureau of Labor Statistics. 2025. Table A-4. Employment Status of the Civilian Population 25 Years and over by Educational Attainment - 2025 M04 Results. https://www.bls.gov/news.release/empsit.t04.htm. Return to 6
- This excludes respondents who reported that they could not work because of a disability or for another reason, even if a job were available. Return to 7
- Autor, David H., David Dorn, Gordon H. Hanson, Maggie R. Jones, and Bradley Setzler. 2025. “Places versus People: The Ins and Outs of Labor Market Adjustment to Globalization.” Working Paper No. 33424. National Bureau of Economic Research. https://doi.org/10.3386/w33424. Return to 8
- Notably, this calculation requires the assumption that degree attainment and migration will be similar in the next 10 years to what they were during 2013–2023. Return to 9
Suggested Citation
Whitaker, Stephan D. 2025. “Where Could Reshoring Manufacturers Find Workers?” Federal Reserve Bank of Cleveland, Cleveland Fed District Data Brief. https://doi.org/10.26509/frbc-ddb-20251009
This work by Federal Reserve Bank of Cleveland is licensed under Creative Commons Attribution-NonCommercial 4.0 International


Regional Data, Analysis, and Engagement
Explore economic trends and the circumstances impacting the economy and diverse communities of the Federal Reserve’s Fourth District, which includes all of Ohio, western Pennsylvania, eastern Kentucky, and the northern panhandle of West Virginia.

About Us
The Federal Reserve Bank of Cleveland (commonly known as the Cleveland Fed) is part of the Federal Reserve System, the central bank of the United States.