

- Share
Tracking Property Investor Patterns in Seven Urban Counties in the Fourth District
This article examines trends among property investors across seven urban counties in the Fourth Federal Reserve District, including the share of single-family homes (SFHs) owned by smaller and larger investors and the market concentration of the largest SFH investors.

The views expressed in this report are those of the author(s) and are not necessarily those of the Federal Reserve Bank of Cleveland or the Board of Governors of the Federal Reserve System.
Introduction
Most single-family home (SFH) investors in the United States are small, owning fewer than 10 homes, but the number of larger investors has grown considerably. For example, investors with portfolios of 1,000 or more SFHs grew from zero in 2011 to 32 by 2022 (Christophers, 2023; Goodman et al., 2023). While this translates into a relatively small share of investor-owned SFHs nationally (around 2 percent) (National Mortgage Professional, 2025), the portfolios of these largest investors are concentrated in 20 metropolitan statistical areas (MSAs), which account for nearly 80 percent of these investors’ units. Two of those MSAs are in the Fourth Federal Reserve District: Cincinnati and Columbus (Goodman et al., 2023).
With investor size in mind, this report builds on previous research (Klesta, 2025) by examining three questions for seven counties in the Fourth District from 2018 through 2025:
- What size SFH investors are operating there?
- How has the market concentration of the largest SFH investors changed?
- How likely is it for a SFH purchased by an investor to remain investor-owned?
While the Fourth District encompasses all of Ohio, eastern Kentucky, western Pennsylvania, and the northern panhandle of West Virginia, the focus of this analysis is on seven of its large counties: Six are in Ohio (Cuyahoga, Franklin, Hamilton, Lucas, Montgomery, and Summit), and one is in Pennsylvania (Allegheny). This analysis splits investors into two categories:
- Smaller (1–99 SFHs)
- Larger (100 or more SFHs)
The size of most investors was determined by aggregating properties within the seven counties that shared the same owner address ID string (composed of the owner’s house number, street name, and five-digit zip code associated with each SFH). The largest investors, those with national portfolios of at least 1,000 SFHs, were identified separately using industry lists and SEC filings. More on investor ownership and this identification process can be found in the Methodology section.
Key Findings
- Across the seven counties studied, investors who owned fewer than 100 SFHs accounted for most investor-owned SFHs, ranging from 93 percent of these investors in Summit County to 72 percent in Montgomery County. Larger investors (100 or more SFHs) accounted for greater than 20 percent of investor-owned SFHs in three counties: Montgomery (28 percent), Franklin (26 percent), and Hamilton (22 percent).
- From 2018 through 2025, smaller investors accounted for most of the growth in investor-owned SFHs in all counties except Franklin, in which larger investors made up 58 percent of the increase.
- Larger investors saw growth in their SFH ownership slow in all seven counties during 2022–2025 (a period of higher interest rates) versus in 2018–2021 (a period of lower interest rates). Smaller investors showed mixed results during the same period.
- Market concentration for the 25 largest SFH investors increased from 2018 through 2025 in all counties except Hamilton and Lucas. The three counties with the highest concentrations of these largest investors (Franklin, Hamilton, and Montgomery) were also the counties with the highest shares of larger investor activity in general.
- When looking at how likely it is for a SFH purchased by an investor to switch back to owner-occupied within three years, larger investors were less likely to sell SFHs back to owner-occupants than smaller investors were during 2018–2021 and 2022–2025. Also, SFHs owned by smaller investors were less likely to switch back to owner-occupied during 2022–2025 versus in 2018–2021.
Findings
What size SFH investors are operating in the Fourth District?
In 2025, investors of all sizes owned between 5.7 percent (Allegheny County) and 10.3 percent (Lucas County) of all SFHs in the seven counties examined. Since 2018, this share has grown fastest in Lucas County (+0.40 percentage points annually) and slowest in Hamilton and Montgomery counties (+0.21 percentage points annually). Figure 1 shows the share of investor-owned SFHs by investor size and condenses investors into two categories: smaller investors (1–99 SFHs) and larger investors (100 or more SFHs). Smaller investors owned the largest share of investor-owned SFHs across the seven counties (84 percent), ranging from 93 percent in Summit County to 72 percent in Montgomery County. In fact, most investors owned fewer than 10 SFHs, ranging from 66 percent of investors in Cuyahoga County to 46 percent in Montgomery County. Larger investors were most active in Montgomery County, in which they accounted for 28 percent of all investor-owned SFHs, followed by Franklin (26 percent) and Hamilton (22 percent).
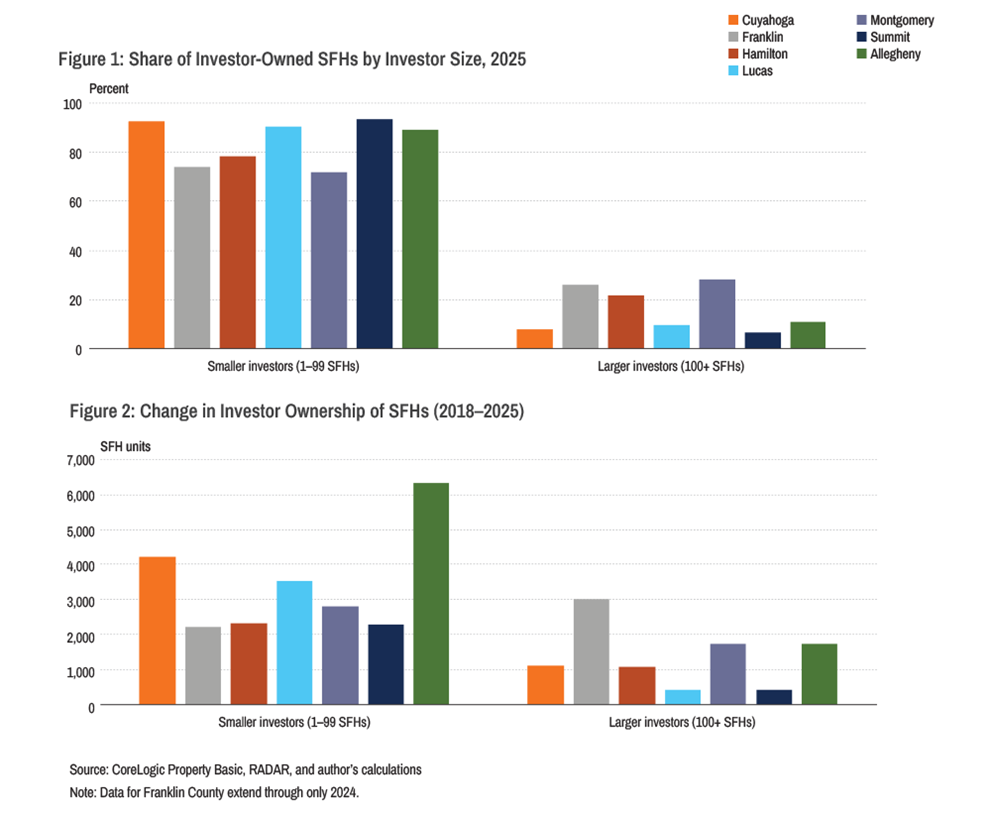
Figure 2 examines the change in investor ownership of SFHs for smaller and larger investors from 2018 through 2025. Since 2018, smaller investors have accounted for a majority of the growth in all counties except Franklin (gray bars), in which larger investors have made up 58 percent of the increase. Interestingly, Allegheny County (green bars) has seen the highest level of smaller investor growth while tying Montgomery County for the second-highest level of larger investor growth.
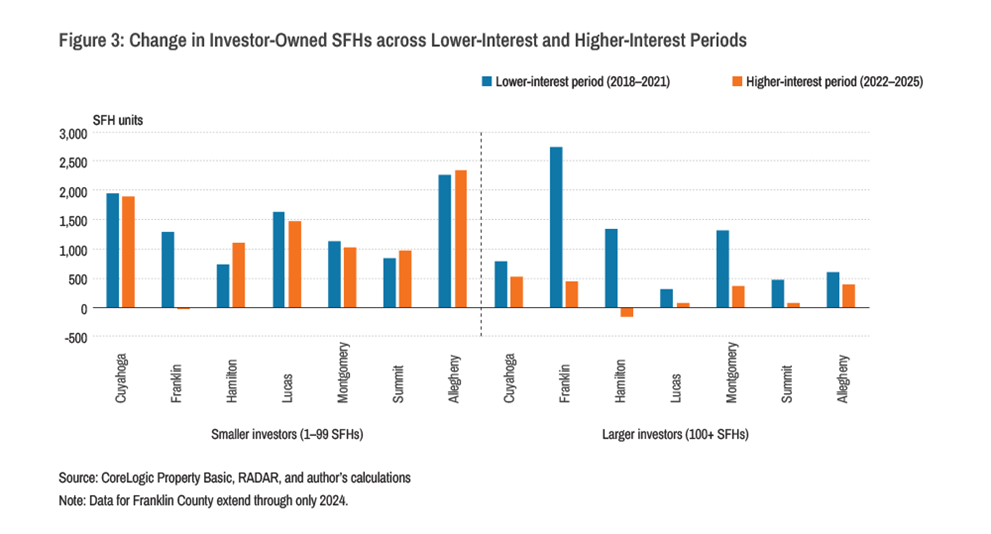
Figure 3 takes a closer look at smaller and larger investor activity by calculating the change in the number of investor-owned SFHs during two periods: one with lower interest rates (2018–2021) and one with higher interest rates (2022–2025) (Freddie Mac, 2026). Mortgage rates for owner-occupied housing averaged 3.63 percent during the lower-rate period and 6.37 percent during the higher-rate period. However, mortgage rates for investment properties tended to be 25 to 88 basis points higher than those for owner-occupied homes (Axelton, 2026). During the higher-rate period (orange bars), all counties experienced a decrease in activity among larger investors (right side of Figure 3). The declines were most pronounced in Franklin, Hamilton, and Montgomery counties, the three counties with higher shares of larger investors. By contrast, from 2018–2021 through 2022–2025, smaller investor activity (left side of Figure 3) saw a significant decrease in Franklin County, modest declines in Cuyahoga, Lucas, and Montgomery counties, and increases in Allegheny, Hamilton, and Summit counties.
Overall, larger investors owned a relatively small share of SFHs in these seven counties. These shares ranged from 2.0 percent to 2.7 percent in Franklin, Hamilton, and Montgomery counties, while the remaining four counties had shares of one percent or less.
What about investors that own at least 350 SFHs, the threshold that was featured in recently enacted housing legislation?
The 21st Century ROAD to Housing Act, enacted in July 2026, contains several items that directly impact large investors that own at least 350 SFHs. While this law does not require these large investors to divest their SFHs, it does prohibit them from purchasing more SFHs except in certain situations. For example, these investors are allowed to participate in activities that increase the housing supply such as build-to-rent programs or the renovation of previously non-code-compliant homes.
Within the seven counties, exposure to these large investors varied. In Cuyahoga, Lucas, Summit, and Allegheny counties, 4 percent of their investor-owned SFHs were owned by investors of this size on average compared to an average of 23 percent for Franklin, Hamilton, and Montgomery.
How has the market concentration of the largest SFH investors changed?
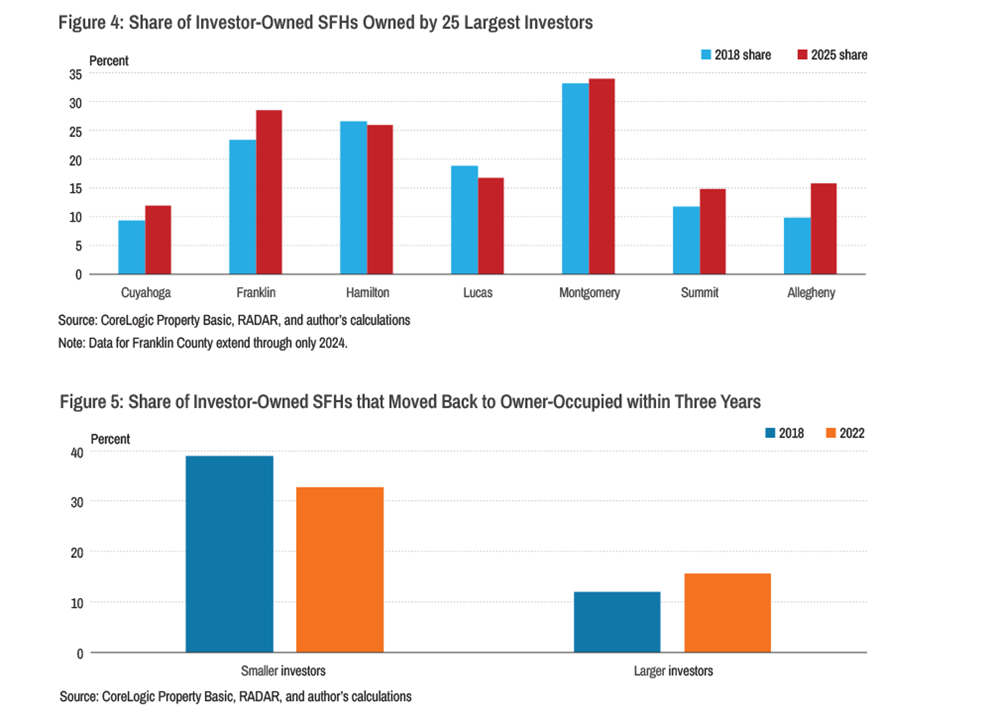
Figure 4 compares the share of investor-owned SFHs owned by the 25 largest investors in each county from 2018 through 2025. This share is calculated by adding up the number of SFHs owned by the 25 largest investors in each county then dividing it by the total number of investor-owned SFHs in that county. From 2018 through 2025, this market share increased in all the counties except Hamilton and Lucas, which saw declines. By 2025, among the seven counties, the 25 largest investors accounted for the smallest share of investor-owned SFHs in Cuyahoga County (12 percent), the largest share in Montgomery County (34 percent), and saw the largest increase from 2018 levels in Franklin County (5 percentage points), a particularly strong increase given that the county’s data were available only through 2024. Of note, the three counties in which the largest investors became most concentrated over time (Franklin, Hamilton, and Montgomery) were also the counties with the highest shares of larger investor activity in general.
How likely is it for SFHs to remain investor-owned?
To answer this question, SFHs that switched from owner-occupied to investor-owned in a given year were reexamined three years later to see what share had switched back to owner-occupied (more on this process can be found in the Methodology section). Figure 5 compares the share of investor-owned SFHs that moved back to owner-occupied within three years by investor size starting in 2018 and 2022. For example, if a SFH switched from owner-occupied to investor-owned in 2022, what was its status three years later in 2025? Two trends stand out. First, smaller investors were more likely to sell homes back to owner-occupants within three years, though that share has decreased in recent years. Second, larger investors were much less likely to sell homes back to owner-occupants, though that share has increased during the same period.
Conclusion
This analysis reveals distinct patterns for investor-owned SFHs in the Fourth District. While smaller investors represented the majority of SFH investors in all seven counties, larger investors have established a strong presence in Franklin, Hamilton, and Montgomery counties. These concentration patterns, combined with the tendency of SFHs owned by larger investors to remain investor-owned, suggest that these three counties may experience different rental market dynamics than counties in which larger investors are less prominent. Given ongoing community concerns about investor practices and the documented differences in how investors of different sizes operate, continued monitoring of these divergent trends is warranted (Goodman et al., 2023).
Data Methodology
Investor ownership: This analysis used CoreLogic property ownership data from 2018 through 2025 and focused exclusively on single-family homes (SFHs) identified by land use codes (mobile homes were excluded). Every SFH was flagged as being owned by an “investor,” “owner-occupant,” or “other,” and the owner was classified as in state or out of state. While most investors were flagged by CoreLogic, additional investors were included based on names that contain keywords such as “LLC,” “co,” or “corp.” The “other” category refers to entities such as land banks, homebuilders, cities, and churches, all of which were excluded from the calculations.
Investor size: Individual investors were identified by creating an ID string from a concatenation of the owner’s house number, street name, and five-digit zip code. This was based on a method used in Polimeni and An (2025), which found that tying clusters of properties to a single mailing address was an adequate method of determining ownership. These ID strings were aggregated, and strings associated with ≥50 SFHs in a single year were examined to determine ownership. This was done using Google and other tools such as the Ohio Business Search to try to determine ownership. One caveat was that an owner could not be identified for every relevant ID string, and some were likely registered agents associated with multiple smaller investors. The largest investors, those with portfolios of at least 1,000 SFHs, were determined by looking at SEC filings and at lists of the largest SFH investors operating in the United States. These investors did not necessarily own 1,000 SFHs in a single county. For example, investors associated with national portfolios of at least 1,000 SFHs cumulatively owned 682 SFHs in Cuyahoga County in 2025.
Ownership change: A file was created in which each row was associated with an individual SFH along with owner type and investor size from 2017 through 2025. Each SFH had to have an owner type listed for every year; if not, they were dropped from the analysis. All SFHs that switched from owner-occupied in 2017 to investor-owned in 2018 were flagged, and the share that shifted back to owner-occupied within three years was calculated. This exercise was repeated for SFHs that changed ownership type in 2022.
References
- Axelton, Karen. 2026. “How Investment Property Mortgage Rates Differ From Conventional Mortgage Rates.” Experian. https://www.experian.com/blogs/ask-experian/investment-property-mortgage-rates/.
- Christophers, Brett. 2023. “How and Why U.S. Single-Family Housing Became an Investor Asset Class.” Journal of Urban History 49 (2): 430–49. https://doi.org/10.1177/00961442211029601.
- Freddie Mac. 2026. “30-Year Fixed Rate Mortgage Average in the United States [MORTGAGE30US].” Retrieved from FRED, Federal Reserve Bank of St. Louis, August 27. https://fred.stlouisfed.org/series/MORTGAGE30US.
- Goodman, Laurie, Amalie Zinn, Kathryn Reynolds, and Owen Noble. 2023. “A Profile of Institutional Investor-Owned Single-Family Rental Properties.” Urban Institute. https://www.urban.org/research/publication/profile-institutional-investor-owned-single-family-rental-properties.
- Klesta, Matt. 2025. “Hotspots: Investor-Owned Home Trends from Select Counties in Ohio and Pennsylvania (2018–2024).” Federal Reserve Bank of Cleveland, Community Development Reports. https://doi.org/10.26509/frbc-cd-20250904.
- National Mortgage Professional. "Small Investors Dominate the Single-Family Home Market." September 26, 2025. https://nationalmortgageprofessional.com/news/small-investors-dominate-single-family-home-market.
- Polimeni, Nicholas, and Brian An. 2025. “Uncovering Neighborhood-Level Portfolios of Corporate Single-Family Rental Holdings and Community Wealth Loss.” Journal of Urban Affairs 0 (0): 1–24. https://doi.org/10.1080/07352166.2024.2447374.
Suggested Citation
Klesta, Matt. 2026. “Tracking Property Investor Patterns in Seven Urban Counties in the Fourth District.” Federal Reserve Bank of Cleveland, Community Development Reports. https://doi.org/10.26509/frbc-cd-20261015
Related resources

Community Development
Supporting low- and moderate-income communities in the Fourth District is a cornerstone of our mission at the Cleveland Fed. Find out how our Community Development team is promoting access to good jobs, housing, and credit for the residents within our district.

About Us
The Federal Reserve Bank of Cleveland (commonly known as the Cleveland Fed) is part of the Federal Reserve System, the central bank of the United States.