

- Share
Estimating Occupational Employment: A Comparison of National, State-Produced, and Trend-Based Employment Projections
In this report, we compare three types of employment projections—national, state produced, and trend based—to see how accurately they estimate realized employment growth for 647 occupations across 36 states from 2014 to 2024.


The views expressed in this report are those of the author(s) and are not necessarily those of the Federal Reserve Bank of Cleveland or the Board of Governors of the Federal Reserve System.
Introduction
Despite labor market shifts related to artificial intelligence and the future of work, an important question among job seekers remains the same: How can I find a job or career path that provides a decent wage and comfortable living for my household? Occupational employment projections are one piece of information that job seekers can use to better understand the future demand for occupations that they are considering. The Federal Reserve’s Occupational Mobility Explorer (OME) features national employment projections alongside local information on wages, educational attainment, and skills to equip users with a well-rounded understanding of different career pathways (Figure 1).
The OME is a career exploration tool that allows users to see how skills gained through previous employment can transfer to higher-paying roles.
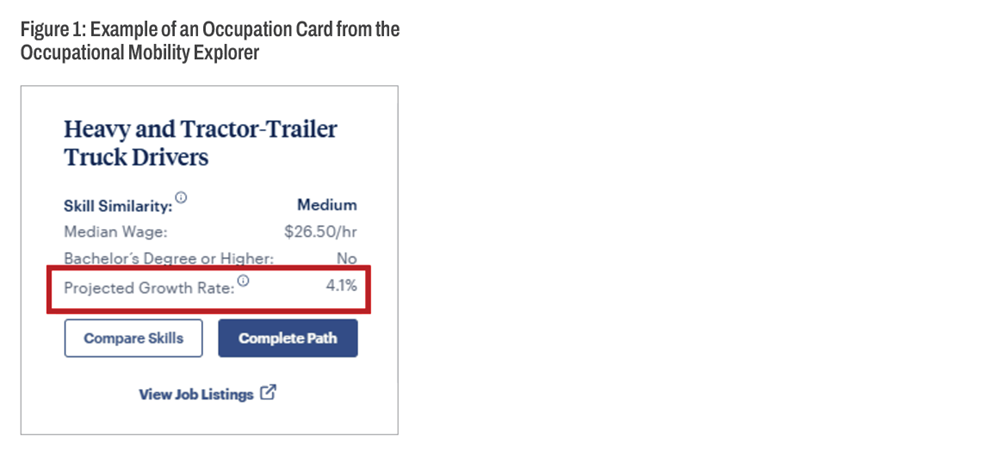
To ensure that the OME includes the best data available, we explore whether national or state-produced employment projections are more accurate indicators of future job growth. To complement the analysis of official projections, we also explore how trends observed in an occupation’s growth over the previous five years align with future growth. Comparing different measures of employment projections has broader implications for policymakers and workforce practitioners who rely on these data to inform the development of training programs and respond to the future hiring needs of businesses.
Key Findings
In this report, we compare three types of employment projections—national, state produced (“state”), and trend based—to see how accurately they estimate realized employment growth for 647 occupations across 36 states from 2014 to 2024. Our analysis shows that
- Both national and state projections are positively correlated with realized growth (r = 0.23 and r = 0.27, respectively), whereas trend-based projections (those based on previous employment growth from 2009 to 2014) exhibit little correlation with realized growth (r = 0.04).
- National and state projections perform similarly, while both outperform the trend-based projection, according to each projection’s mean absolute error (MAE). However, the large MAE for each of the three projections highlights that it is very difficult to accurately predict job growth at the state-occupation level over a long time horizon. Thus, any such projections should be considered with caution.
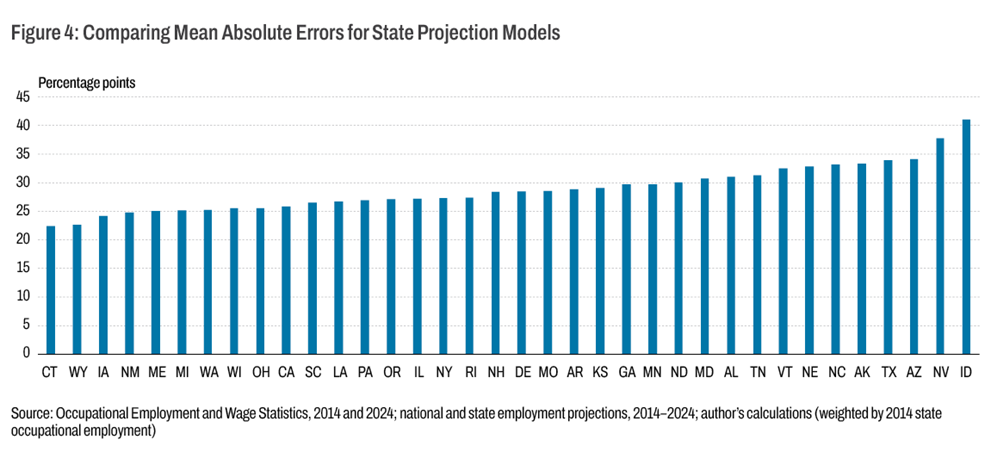
- There is notable variation in the accuracy of individual state projection models. Based on projections from 2014 to 2024, state-level occupation projections from Connecticut and Wyoming were relatively more accurate than the national average projections, while the projections from Idaho and Nevada were relatively less accurate than the national average projections.
These findings speak to the value that employment projections can provide to job seekers making long-term career decisions while suggesting some caution about the ability of any projection to predict the future. Considering that national and state projections perform similarly, we determine that the OME will continue to incorporate national projections, which offer broader coverage of occupations. However, we also recommend checking with state labor market information (LMI) offices and local businesses for additional context on future demand for occupations.
Employment Projections Explained
Every year, the Bureau of Labor Statistics (BLS) releases national 10-year employment projections (for example, for 2024–2034). In its projection calculation, the BLS uses historical and current data on the labor force, the macroeconomy, and industrial activities to estimate long-term economic trends across industries and occupations.1 These projections provide users with information on the expected growth of an occupation over the course of a decade. The forward-looking nature of these data makes them especially useful for students and job seekers who are considering different career paths. At the same time, employment projections are not designed to predict rapid changes in the economy like the sudden emergence of new technologies or abrupt demographic shifts.2 Instead, employment projections provide a measured approach to analyzing the trajectory of long-term economic growth based on neutral assumptions (for example, demographic trends will continue; the economy will be at roughly full employment).3
The BLS regularly reviews the accuracy of national employment projections. Those reviews indicate that the projections perform reasonably well. From 2014 to 2024, the directionality of the projections was accurate 86 percent of the time.4 Other studies reveal varying degrees of precision across different methodologies, time horizons, and occupational categories (Atalay, 2020; Wyatt, 2010; Alpert and Auyer, 2003; Rosenthal, 1999).
While the BLS annually develops national employment projections, state LMI offices produce state employment projections, as occupational demand can vary across states based on the mix of industries and employers, among other factors. Generally, every two years, each state LMI office develops its own 10-year employment projections using the methodology and resources provided through the Projections Managing Partnership (PMP).5 State LMI offices can incorporate information on industries that more accurately reflects statewide demand for occupations that feed into employment projections. While the BLS regularly reviews the national projections, there is little analysis available on the accuracy of state projections.
Methods and Data
In this analysis, we examine the ability of national, state, and trend-based occupational employment projections to accurately estimate the realized employment growth of an occupation at the state level from 2014 to 2024. We use employment estimates from the Occupational Employment and Wage Statistics (OEWS) program to compute realized employment growth, or the percent change in an occupation’s total state employment from 2014 to 2024. We use three different sources for projected growth rates of an occupation: national projections from 2014 to 2024, state projections from 2014 to 2024, and a trend-based projection based on the percent change in occupational employment from 2009 to 2014 observed in the OEWS. We examine the MAEs, which measure the average absolute difference between predicted and realized employment growth in percentage points for each projection.
We focus on the 2014 to 2024 period so we can align data sources on realized employment growth with historical state projections, which have limited availability in earlier years. We include 36 states with accessible historical employment projections in our analysis, focusing on six-digit Standard Occupation Classification (SOC) codes, as they provide the finest level of detail and are most relevant to job seekers.6 We limit the analysis to occupations with consistent six-digit SOC codes across the 2010 and 2018 SOC systems and exclude occupations where employment is suppressed at the state level. Collectively, these nuances allow us to examine 647 of the 867 occupations in the SOC system. Note that each state does not have observations for all 647 occupations, as state projections are not produced for all occupations. See Table A1 in the appendix for the number of occupations included in this analysis for each state.7
Comparing Projections and Realized Growth
As we compare employment projections with realized growth from 2014 to 2024, it is important to remember that projections are based on the assumption that economic conditions will proceed without major disruptions, like the global pandemic in 2020. Even with this pandemic shock, the projections are generally positively correlated with realized growth from 2014 to 2024, suggesting an association between expected and realized employment growth. National and state projections are positively correlated with realized growth (r = 0.23 and r = 0.27, respectively), whereas the trend-based projection exhibits little correlation with realized growth (r = 0.04).
Figure 2 presents the average percent change in realized employment growth from 2014 to 2024 alongside the average projected percent change for an occupation for each projection category. From 2014 to 2024, the average occupation’s employment grew by 8.3 percent across the states in our sample. On average, national projections underestimated growth by 3.1 percentage points, whereas state projections overestimated growth by 2.3 percentage points. Interestingly, even though the trend-based projection is not correlated with realized growth, the average trend-based projection (8.7 percent) is closest to average realized growth (8.3 percent).
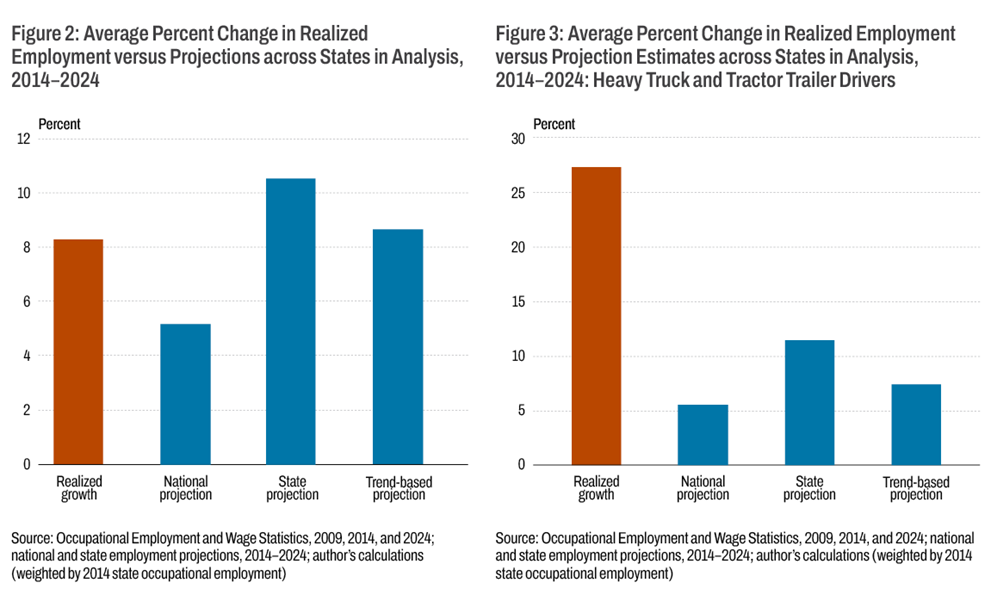
Despite general trends (Figure 2), there is considerable variability at the state and occupational level as to which projection measure aligns most closely with realized growth. For example, trend-based projections are closest to realized growth in Pennsylvania on average, whereas national projections are closest in Michigan and state projections are closest in Ohio. Figure 3 shows how these dynamics can vary depending on the occupation, as well. The realized employment growth for heavy truck and tractor trailer drivers from 2014 to 2024 well exceeded projections across all states, indicating a significant “miss” by employment projections. While state projections outperformed the other two projection measures on average, the average realized employment growth for truck drivers was still more than 15 percentage points higher than the average state projection.
Findings
As the figures above show, a more robust analysis is necessary to identify which of the three projections most likely provides the best guide for job seekers. We use MAEs to answer this question. In this context, the MAE measures the average absolute difference in percentage points between predicted and realized employment growth for each projection. A smaller MAE value indicates higher accuracy, as there is greater alignment between the projected and realized employment growth.
Table 1 presents the MAEs used to analyze the three different employment projections. We find that the average absolute difference between predicted and realized employment growth for national projections is 28.2 percentage points compared to 28.5 percentage points for state projections and 34.7 percentage points for trend-based projections. We also find that the MAEs for national and state projections are not statistically different from each other; however, both are statistically different from the trend-based MAE.8
Table 1: Mean Absolute Errors by Projection, Six-Digit SOC
| National projections | State projections | Trend-based projections | |
| MAE (percentage points) | 28.2 | 28.5 | 34.7 |
| Observations | 16,398 | 16,398 | 16,398 |
Source: Occupational Employment and Wage Statistics, 2009, 2014, and 2024; national and state employment projections, 2014–2024; author’s calculations (weighted by 2014 state occupational employment)
From this table, we conclude that national and state employment projections perform similarly, while both outperform the trend-based projection. However, the large MAEs across all three projections, in both absolute terms and relative to average realized employment growth (8.3 percent), highlights that it is very difficult to accurately predict long-term job growth at the state-occupation level. Thus, any such projections should be considered with caution.
Furthermore, it indicates just how difficult it is to estimate future employment growth across hundreds of occupations at the six-digit SOC code level. In terms of directionality, we find that national and state projections are both accurate about 60 percent of the time compared to roughly 50 percent of the time for trend-based projections.
While national and state projections perform similarly on average across the 36 states, our data allow us to examine how individual state projections perform against one another to better understand the overall performance of state projections. Figure 4 presents the MAEs for each state. Based on the range of MAEs, there is indeed notable variation in the accuracy of state projection models. Connecticut and Wyoming have relatively accurate projections from 2014 to 2024, with MAEs of less than 23.0 percentage points. By contrast, Idaho and Nevada have relatively inaccurate employment projections over this period, with MAEs of 40.9 and 37.7 percentage points, respectively. These findings indicate that despite similar methodologies and access to PMP resources, not all state employment projections are equal. From this analysis, it is unclear why some state projections would outperform others, but future research can pursue a better understanding of which practices help states produce more accurate projections.9
Conclusion
This analysis informs our collective ability to suggest occupations for individuals to pursue based on the presumption that they will grow. We find that, on average across the 36 states, national and state projections perform similarly and are more accurate than trend-based projections from 2014 to 2024. We also find considerable variation in the performance of state-produced projections. Based on this analysis, we will continue to display the national projections in the OME as a piece of information job seekers can use to gauge future demand for occupations as they explore career pathways. However, the relatively large MAEs for each of the three projections speak to the challenges in developing employment projections for detailed occupations (at the six-digit SOC level) and indicate that users should exercise caution when using employment projections. For students and job seekers, referencing employment projections alongside other career information resources can help provide a comprehensive understanding of different career options. For policymakers, workforce practitioners, and training providers, these results highlight the importance of connecting and building relationships with local employers to better understand their workforce needs. Additionally, while the PMP provides a framework for calculating projections, a greater understanding of what current practices enhance the ability of some state projections to more accurately estimate employment growth might prove beneficial to share across state LMI offices.
Endnotes
- For more information on the methodology behind the BLS’s employment projections, see https://www.bls.gov/opub/hom/emp/home.htm. Return to 1
- An underlying assumption of the BLS projections is that the pace of technological change will remain consistent with past experience. The impacts of new technologies like generative AI on employment and occupational staffing patterns are particularly challenging to determine. See https://www.bls.gov/emp/frequently-asked-questions.htm#technology. Return to 2
- For a list of the general assumptions underlying the BLS projections, see https://www.bls.gov/opub/hom/emp/concepts.htm#assumptions. Return to 3
- https://www.bls.gov/emp/evaluations/2014-2024-occupational.htm. This number is higher than previous evaluations due to methodological approaches across SOC systems. “In the 2012–22 evaluation, BLS kept only those occupations with a one-to-one match on SOC codes between the two years (2012 and 2022) and compared those employment values to determine if the BLS model or the naïve model was the better fit. In doing so, any employment that had a change in SOC code would not be counted in the comparison. For the 2014–24 evaluation, to better compare the projections results from BLS and the naïve model, BLS applied a mapping between the two SOC classification systems that allowed for all occupations to be included in the comparison. This involved aggregating employment from multiple occupations or applying ratios based on previous employment, depending on how the occupations were split or combined between the 2010 and 2018 SOC systems.” https://www.bls.gov/emp/evaluations/methods.htm. Return to 4
- This partnership between federal and state offices helps to ensure the accuracy, useability, and consistency of employment projections across states. Return to 5
- We attempted to collect projections from all 50 states, but some states do not preserve historical projection estimates. Of the 36 states in our analysis, we collected 16 states’ projections by directly contacting state LMI offices, 14 states’ projections using the Internet Archive’s Wayback Machine, and six states’ projections from archived state LMI websites. Return to 6
- It should also be noted that states do not produce employment projections for all occupations but rather tend to focus on larger occupations. Similarly, states with larger employment bases tend to produce projections for a larger number of occupations compared to states with lower levels of employment. Return to 7
- We use a two-sample test to compute statistical differences. Return to 8
- Even though the PMP provides a framework for state projections, states ultimately use different methodologies to create their projection estimates. Factors like data inputs with varying degrees of data quality or collecting reviewer feedback may affect the accuracy of state projections; however, future research is needed to determine whether certain methods result in more accurate projections than others. Return to 9
Appendix
Table A1: Occupation and Employment Coverage by States Included in the Analysis, 2014
| State | Occupations in analysis | Percent of 2014 occupations in analysis | Percent of 2014 state employment included in analysis |
| Alabama | 495 | 3.02 | 76.6 |
| Alaska | 309 | 1.88 | 71.4 |
| Arizona | 470 | 2.87 | 74.5 |
| Arkansas | 450 | 2.74 | 74.6 |
| California | 532 | 3.24 | 76.4 |
| Connecticut | 435 | 2.65 | 72.6 |
| Delaware | 286 | 1.74 | 69.0 |
| Georgia | 522 | 3.18 | 75.9 |
| Idaho | 384 | 2.34 | 73.7 |
| Illinois | 520 | 3.17 | 73.9 |
| Iowa | 292 | 1.78 | 70.5 |
| Kansas | 458 | 2.79 | 74.0 |
| Louisiana | 475 | 2.90 | 78.0 |
| Maine | 414 | 2.52 | 73.9 |
| Maryland | 501 | 3.06 | 72.9 |
| Michigan | 530 | 3.23 | 73.5 |
| Minnesota | 516 | 3.15 | 71.3 |
| Missouri | 501 | 3.06 | 72.6 |
| Nebraska | 441 | 2.69 | 75.4 |
| Nevada | 404 | 2.46 | 77.7 |
| New Hampshire | 417 | 2.54 | 72.2 |
| New Mexico | 408 | 2.49 | 73.2 |
| New York | 523 | 3.19 | 73.6 |
| North Carolina | 552 | 3.37 | 73.8 |
| North Dakota | 323 | 1.97 | 73.5 |
| Ohio | 558 | 3.40 | 73.5 |
| Oregon | 510 | 3.11 | 74.2 |
| Pennsylvania | 585 | 3.57 | 76.0 |
| Rhode Island | 313 | 1.91 | 68.5 |
| South Carolina | 490 | 2.99 | 77.1 |
| Tennessee | 474 | 2.89 | 67.5 |
| Texas | 588 | 3.59 | 76.5 |
| Vermont | 317 | 1.93 | 68.7 |
| Washington | 533 | 3.25 | 71.7 |
| Wisconsin | 535 | 3.26 | 74.6 |
| Wyoming | 337 | 2.06 | 75.9 |
| Total | 16,398 | 100 |
Source: Occupational Employment and Wage Statistics, 2014; national and state employment projections, 2014–2024
References
- Alpert, Andrew, and Jill Auyer. 2003. “Evaluating the BLS 1988–2000 Employment Projections.” Monthly Labor Review, October. https://www.bls.gov/opub/mlr/2003/article/evaluating-the-bls-1988-2000-employment-projections.htm.
- Atalay, Enghin. 2020. “How Accurate Are Long-Run Employment Projections?” Economic Insights 5 (4). Federal Reserve Bank of Philadelphia. https://www.philadelphiafed.org/the-economy/macroeconomics/how-accurate-are-long-run-employment-predictions.
- Rosenthal, Neal H. 1999. “The Quality of BLS Projections: A Historical Account.” Monthly Labor Review, May. https://www.bls.gov/opub/mlr/1999/article/quality-of-bls-projections-a-historical-account.htm.
- Wyatt, Ian D. 2010. “Evaluating the 1996–2006 Employment Projections.” Monthly Labor Review, September. https://www.bls.gov/opub/mlr/2010/09/art3full.pdf.
Suggested Citation
Fee, Kyle D., and Theresa Dunne. 2026. “Estimating Occupational Employment: A Comparison of National, State-Produced, and Trend-Based Employment Projections.” Federal Reserve Bank of Cleveland, Community Development Reports. https://doi.org/10.26509/frbc-cd-20260826
Related resources

Community Development
Supporting low- and moderate-income communities in the Fourth District is a cornerstone of our mission at the Cleveland Fed. Find out how our Community Development team is promoting access to good jobs, housing, and credit for the residents within our district.

About Us
The Federal Reserve Bank of Cleveland (commonly known as the Cleveland Fed) is part of the Federal Reserve System, the central bank of the United States.