

- Share
Revisiting Wage Growth after the Recession
In this Commentary, we show that realized wage growth since 2015 has mostly been at a rate that would be expected given observed rates of inflation and labor productivity growth. Moreover, labor productivity growth has been in line with its potential over the same period. This picture of the post-recession recovery of wages is very different from the one we observed in an earlier analysis, when all we had were data up through the end of 2015. The reasons underlying the difference are large revisions in labor productivity data and upticks in the inflation rate and labor productivity growth since our last report.

The views authors express in Economic Commentary are theirs and not necessarily those of the Federal Reserve Bank of Cleveland or the Board of Governors of the Federal Reserve System. The series editor is Tasia Hane. This paper and its data are subject to revision; please visit clevelandfed.org for updates.
Back in early 2017, we published an Economic Commentary that addressed the issue of low wage growth in the recovery period after the Great Recession. In that study, we showed that the underlying source of sluggish wage growth was low labor productivity growth. In fact, our results indicated that actual wage growth since late 2014—even though it was low in magnitude—was higher than we would have expected based on the rate of labor productivity growth.
The data we had at that point—up to 2015:Q4—were reasonably early in the recovery period. As the expansion continued, wage growth has accelerated. Because the data may now tell a different story, we redo our analysis in which we examine the contributions of labor productivity growth and inflation to wage growth, extending the period covered through 2018 and the first semester of 2019, whenever available. Our results indicate that realized wage growth since 2015 has mostly been at a rate that would be expected given the observed rates of inflation and labor productivity growth, while being somewhat below the expected value in the most recent readings. This change in the observed pattern is the result of two factors. First, labor productivity growth is catching up to its potential, due both to the acceleration of labor productivity and to data revisions. Second, actual forward inflation1 has risen, reducing significantly the gap between it and the year-ahead inflation forecast. These results stand in sharp contrast with what we observed in our earlier analysis.
Actual and Estimated Wage Growth since the Great Recession: An Updated Analysis
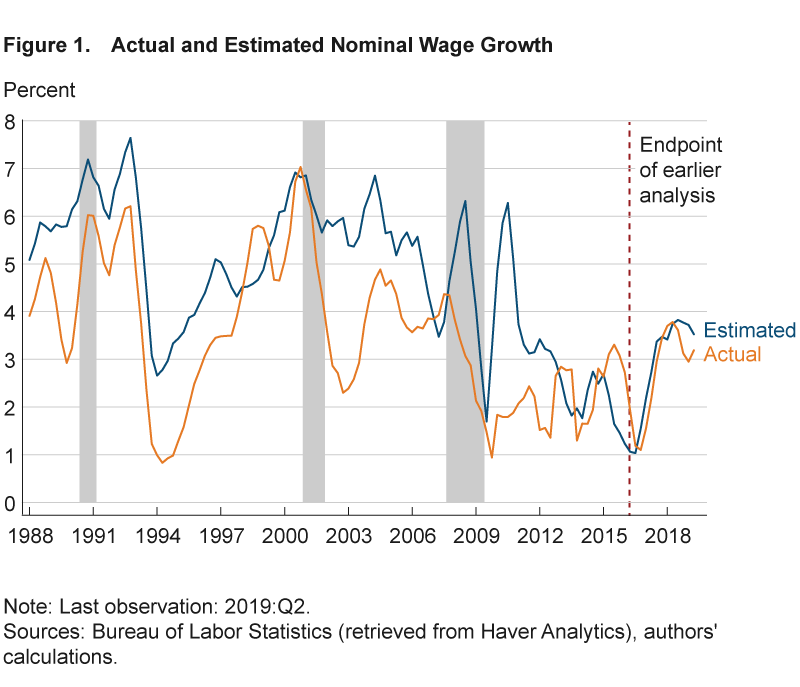
While wage growth was sluggish for half a decade after the Great Recession, it began to accelerate in 2016 (figure 1). Growth in average hourly earnings (year-over-year) rose from 2.5 percent in December 2015 to 3.3 percent in December 2018. With this acceleration, the question arises as to whether wage growth is also now more in line with its fundamentals—labor productivity growth and inflation—than it was in our earlier analysis.
To investigate this question, we use a very simple economic model to estimate the wage growth that would be consistent with realized productivity growth and inflation, and then we compare the estimates of wage growth with realized (actual) wage growth. In the model, there is a competitive market with identical firms that produce a single good and use labor as their only input. Firms take both product and input prices as given. Based on this model, we obtain:
(1) nominal wage growth ≈ price inflation + labor productivity growth.
While simplified, this model has been accurate in describing long-run patterns of wage and labor productivity growth (see Stansbury and Summers, 2017, and Pessoa and van Reenen, 2013). To calculate the inflation rate, we use the consumer price index (CPI); to calculate wage growth and productivity, we use compensation per hour and the labor productivity series, respectively, from the Bureau of Labor Statistics’ (BLS) Major Sector Productivity and Costs database. Both series are consistently measured and consequently comparable across time.2
Comparing the estimates we obtain from the model with actual wage growth data, we find that actual wage growth and estimated wage growth have converged since 2016, after a period in which actual wage growth was higher than expected wage growth (figure 1).3 This result suggests that wage growth is now mostly in line with what we would expect based on its fundamental determinants: realized labor productivity growth and inflation.
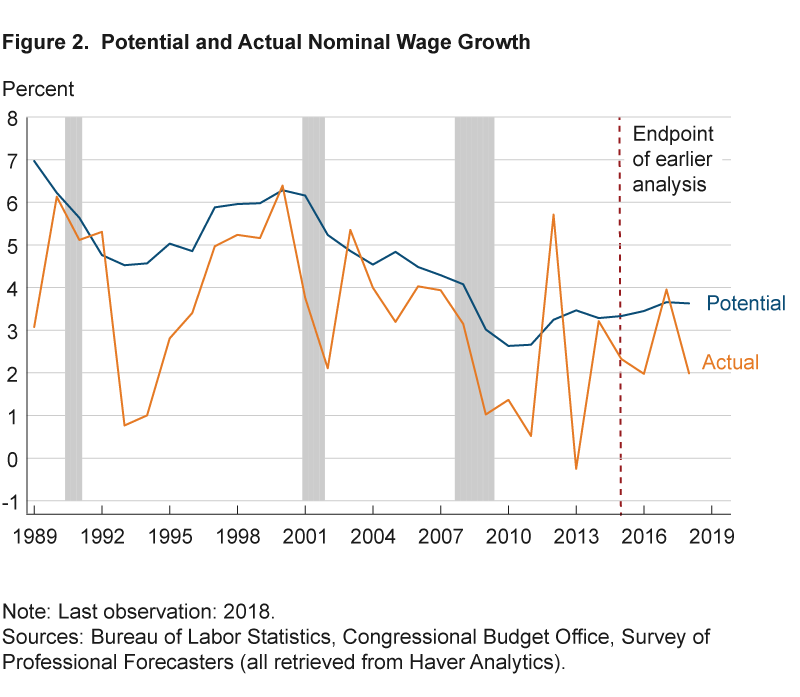
To further evaluate actual wage growth since 2016, we compare it against potential wage growth, that is, the wage growth we would expect if the economy were operating close to its productive capacity. We find that actual wage growth has been close to, though recently somewhat under potential wage growth (figure 2). Considering the narrowing of the estimated–actual wage gap together with the narrowing of the actual–potential wage gap suggests that there is nothing anomalous about the wage growth we have experienced in this recovery period.
What Has Changed since 2015?
The picture of wage growth we get from the current data is quite different from the one we observed in our previous analysis. The convergence of actual, estimated, and potential wages since 2015 appears to be the result of several factors: large revisions in labor productivity data, an uptick in the growth rate of labor productivity, and an uptick in the inflation rate.
Data Revisions
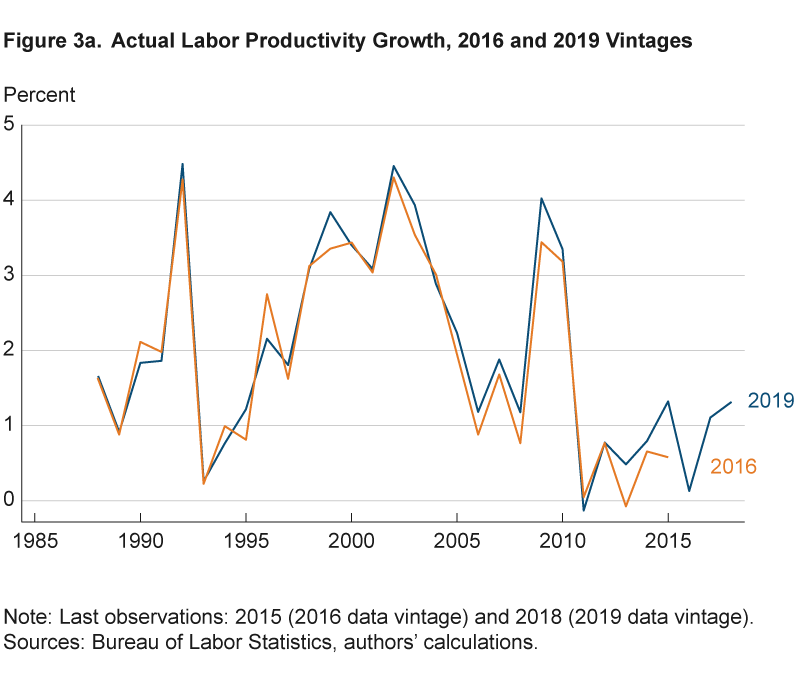
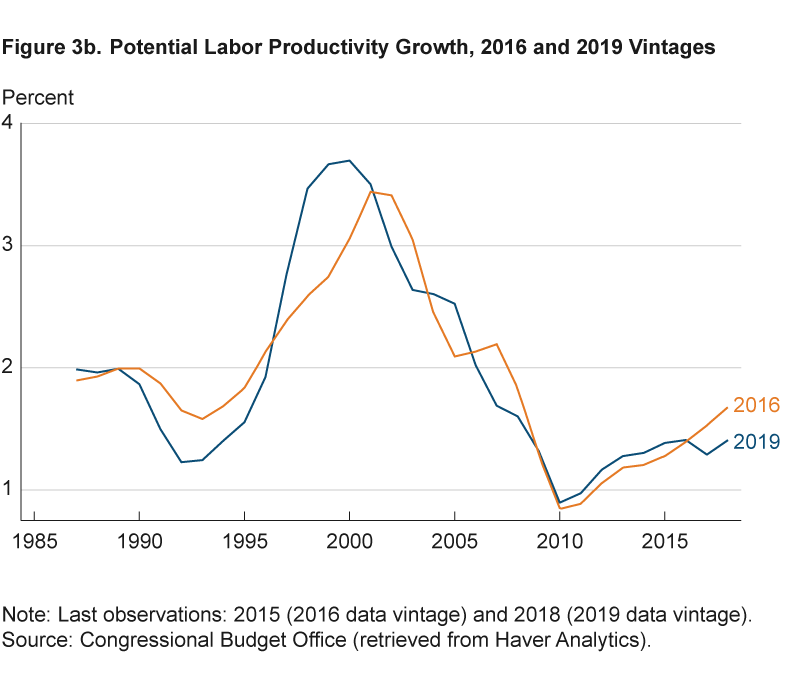
The data on labor productivity growth have been revised since our earlier analysis, and after 2010 the revisions have been upward (figure 3a). Comparing the current data to the 2016 vintage we used in our previous analysis shows that revisions have shifted realized growth up in the post-Great Recession period by an average of 0.48 percentage points, an increase of 124 percent.4 The revised data now suggest that realized labor productivity growth in 2013–2015 was not as low as originally thought.5 Similarly, data on potential labor productivity growth were also revised. While the revisions were also positive, they were significantly smaller (figure 3b). Overall, these data revisions contributed to the narrowing of the gap previously observed in our earlier analysis between actual and potential wage growth.
Labor Productivity Growth
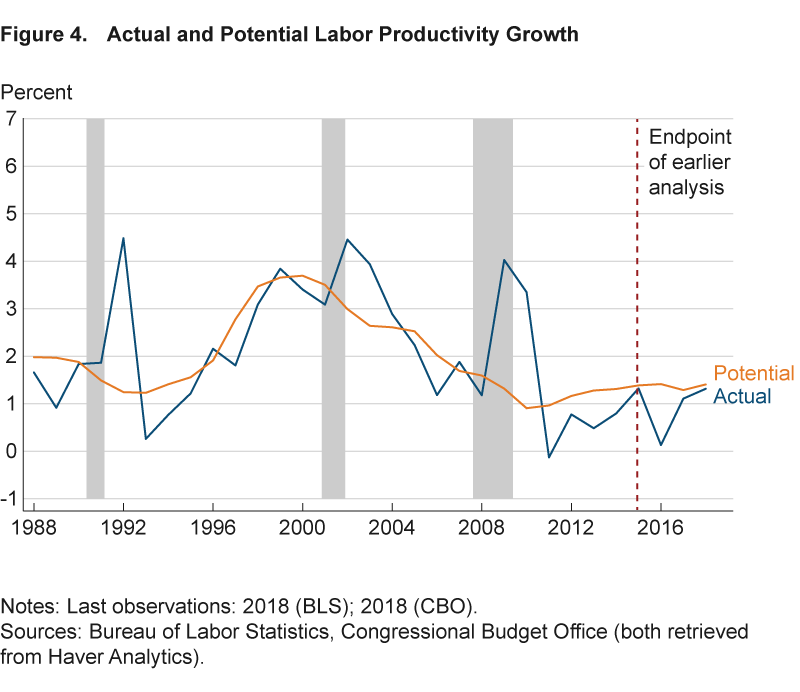
When the data revisions are factored in to our analysis, labor productivity growth has a positive trend, even though the data are rather noisy (figure 4). Labor productivity growth went from 0.1 percent in 2016 to 1.3 percent (year-over-year) in 2018.
Rising Inflation
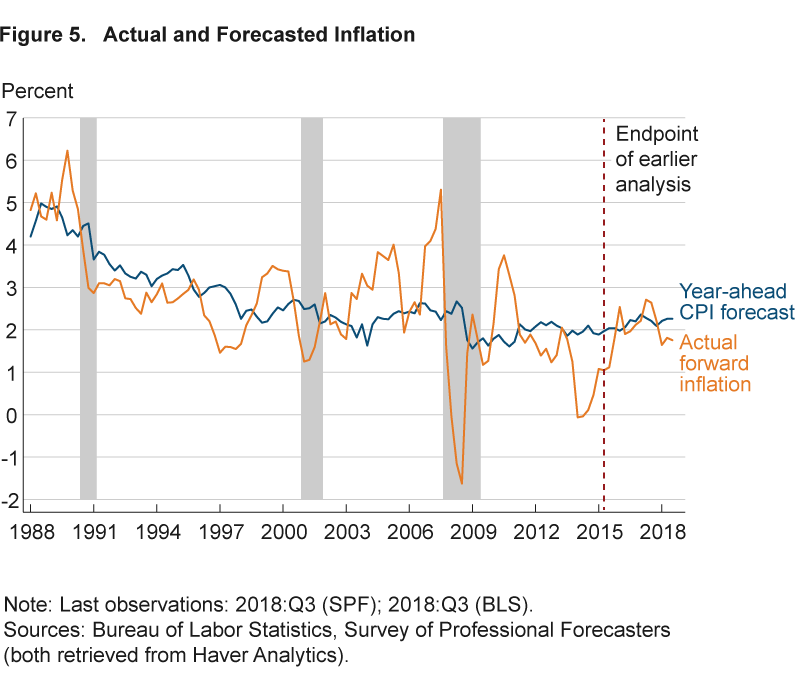
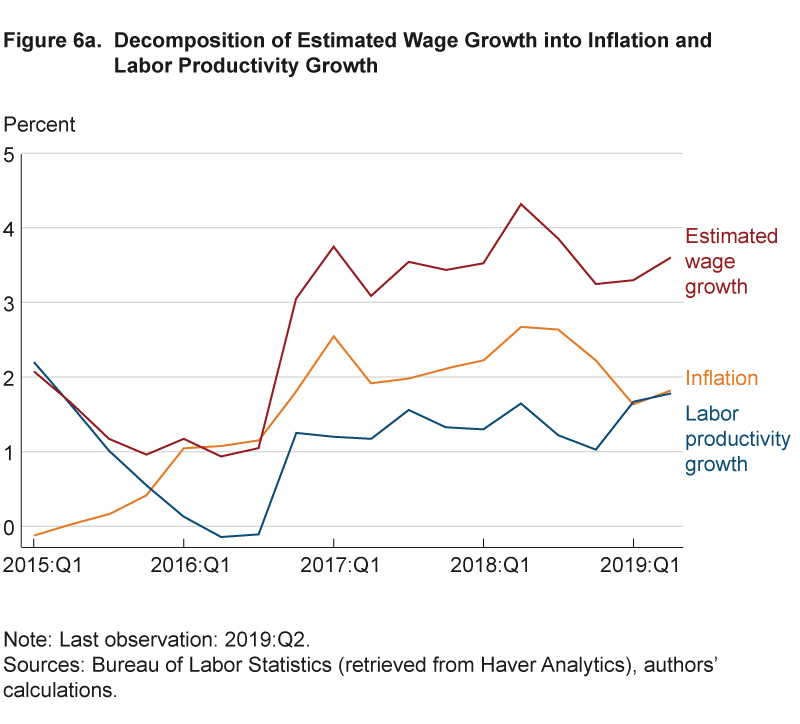
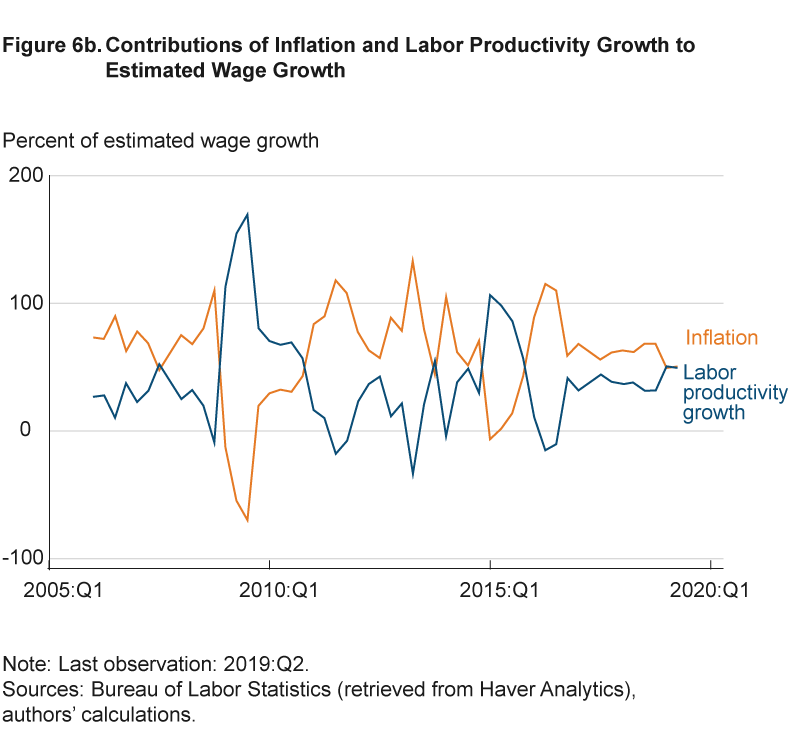
Since 2015, actual inflation has picked up, reducing significantly the gap between realized and expected inflation (figure 5). Decomposing estimated wage growth into its two components, inflation and labor productivity growth, we can see that for most of the period after 2016, the pickup in the inflation rate explained more than two-thirds of the estimated wage growth (figure 6a). This pattern is not far off from what we have seen in the recent past (figure 6b).
Conclusion
In this Commentary, we show that realized wage growth since 2015 is mostly in line with the observed inflation rate and labor productivity growth in the period. Moreover, labor productivity growth in the period is generally in line with the potential labor productivity growth estimated by the CBO. As a result, the gap between realized wage growth and potential wage growth has narrowed. This picture is in sharp contrast with the scenario we described in late 2015 in our earlier analysis. The reasons underlying this difference are: large revisions in labor productivity data and upticks in the inflation rate and labor productivity growth since 2015.
Footnotes
- We consider actual forward inflation to be the observed inflation rate in the year-ahead period for which we had professional forecasts’ issued forecasts. For example, imagine that in 2015:Q4 the average professional forecast for the inflation rate in the period 2015:Q4-2016:Q4 was 2.04 percent, while the actual inflation rate in the period was 1.80 percent. We call 2.04 percent the year-ahead inflation forecast for 2015:Q4 and 1.80 percent the actual forward inflation for 2015:Q4. Return
- Although we use the CPI for inflation, our results are robust to alternative measures (personal consumption expenditures (PCE), core PCE, and core CPI, for example). Moreover, as we showed in Pinheiro and Yang (2017), while the deflators used in the calculations of labor productivity growth and inflation are different (GDP deflator and CPI, respectively), this difference does not significantly impact the observed patterns. Return
- However, it is not clear what the trend of wage growth would be, given there are only a few data points since 2016. It could be due to noise; thus, we are not making any conclusion on the convergence yet. Return
- As Bognanni and Zito (2016) point out, we can see substantial revisions that occur even 20 years later. As a result, at this point in time, we are unable to say if further revisions are going to occur. Return
- Such large revisions are consistent with Bognanni and Zito (2016), who show that periods with low real-time labor productivity growth are usually associated with unusually large positive revisions. Return
References
- Bognanni, Mark, and John Zito. 2016. “New Normal or Real-Time Noise? Revisiting the Recent Data on Labor Productivity.” Federal Reserve Bank of Cleveland, Economic Commentary, 2016-16.
- Pessoa, Joao Paulo, and John van Reenen. 2013. “Decoupling of Wage Growth and Productivity Growth? Myth and Reality.” Center for Economic Performance Working Paper No. 1246.
- Pinheiro, Roberto, and Meifeng Yang. 2017. “Wage Growth after the Great Recession.” Federal Reserve Bank of Cleveland, Economic Commentary, 2017-04.
- Stansbury, Anna M., and Lawrence H. Summers. 2017. “Productivity and Pay: Is the Link Broken?” NBER Working Paper No. 24165.
Suggested Citation
Pinheiro, Roberto B., and Meifeng Yang. 2020. “Revisiting Wage Growth after the Recession.” Federal Reserve Bank of Cleveland, Economic Commentary 2020-02. https://doi.org/10.26509/frbc-ec-202002
This work by Federal Reserve Bank of Cleveland is licensed under Creative Commons Attribution-NonCommercial 4.0 International

