

- Share
The Evolution of the Labor Share across Developed Countries
In most developed countries, the share of output accruing to labor has declined over the last 20 years. However, the underlying reasons for the decrease may have differed in the United States and other developed countries. In this Commentary, we examine some of the explanations economists have proposed for the decline in the labor share and discuss how well these explanations account for the decline across developed countries.

The views authors express in Economic Commentary are theirs and not necessarily those of the Federal Reserve Bank of Cleveland or the Board of Governors of the Federal Reserve System. The series editor is Tasia Hane. This paper and its data are subject to revision; please visit clevelandfed.org for updates.
In most developed countries, the labor share—the percentage of economic output that accrues to workers as labor compensation—has declined over the last 20 years. Economists and policymakers study changes in the labor share over time because those changes indicate how much of the growth in labor productivity is captured by workers through real compensation growth. Examining ways in which the labor share has changed in other developed countries may suggest the possible future path of the labor share in the United States. As Blanchard (1997) pointed out, developed countries tend to be similar and close to each other in terms of technological innovation, so differences in the evolution of the labor share should not persist over time.1 In addition, studying changes in the labor share across countries may allow us to evaluate the generalizability of proposed explanations for the underlying causes of the changes.
In this Commentary, we compare changes in the labor share in the United States with changes in 34 other developed countries, including European Union (EU) member states, EU candidate countries,2 and other countries belonging to the Organization for Economic Cooperation and Development (OECD).3 We investigate two potential explanations for changes in the labor share over time across different countries. The first explanation suggests that changes in the labor share across time can be partly accounted for by structural changes in the sectoral composition of the economy and partly by movements in the labor share within sectors (see Elsby et al. 2013 for the US case). The second explanation suggests that changes in the relative price of inputs, particularly a decrease in the relative price of investment goods, may have induced firms to replace labor with capital, such as machines and software (see Karabarbounis and Neiman 2013). Other reasons for changes in the labor share have been suggested, such as deunionization, increases in globalization that induced more international trade and offshoring, and changes in demographics, among others, so our analysis is not exhaustive and does not rule out the effects of other variables. However, the explanations we focus on are those that appear in the papers most often cited in the literature.
Structural Changes in Sectoral Composition as an Explanation
According to Elsby et al. (2013), the decline in the US labor share happened because of two changes in the US economy. The first was a shift in the country’s sectoral composition from a high-labor-share sector (manufacturing) to a low-labor-share sector (services). Second, the labor share within the manufacturing sector itself declined over time, and this decline was not compensated for by an increase in the labor share within the services sector. Elsby et al. suggest that these combined changes led to the observed decline in the overall US labor share.
Figure 1 shows that the decline in the labor share was steeper in other developed countries than in the United States, and it started earlier. In fact, most research shows that most developed European countries started experiencing a decline in the labor share in the mid-1970s (see Commission 2007), while the decline began in the late 1980s in the United States (see Armenter 2015 and Elsby et al. 2013).
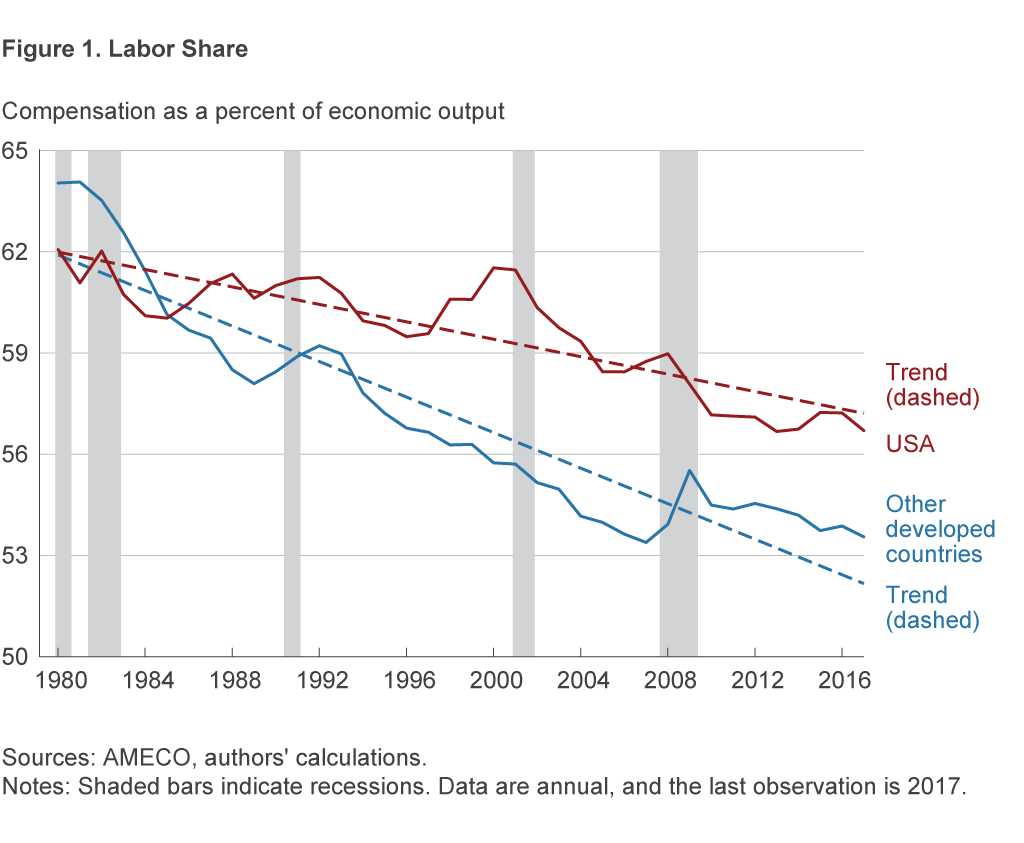
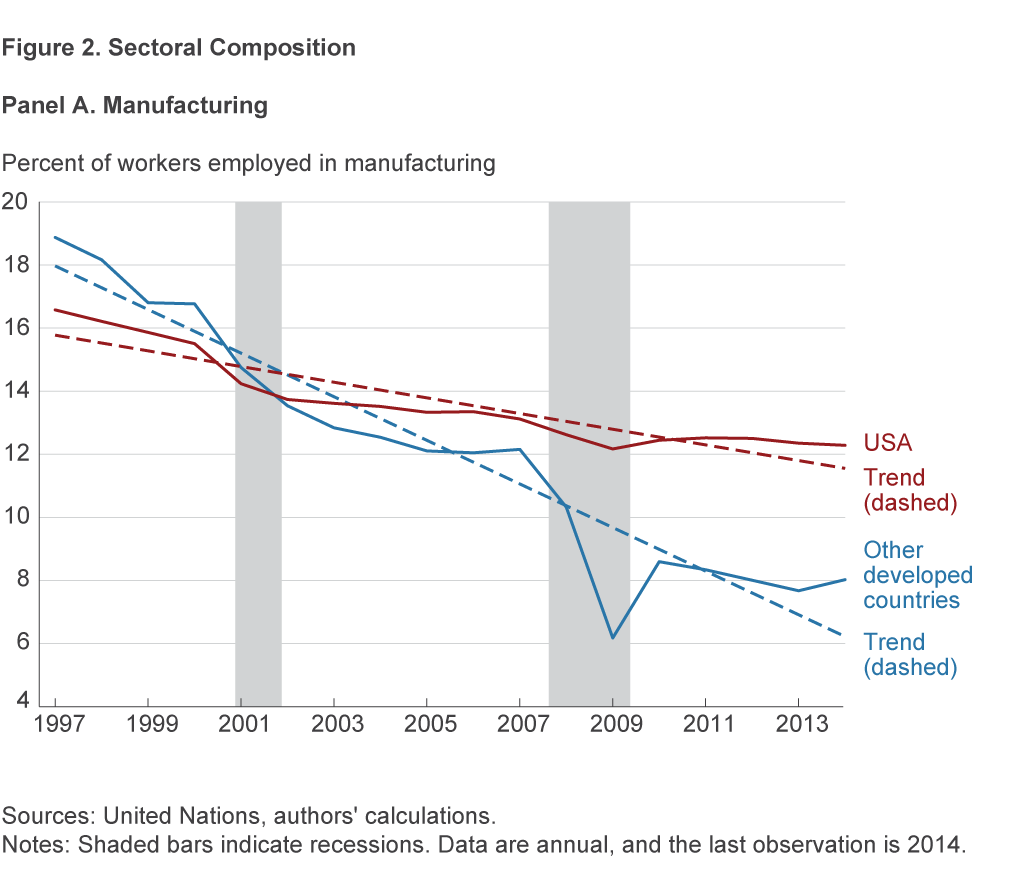
Figure 2 depicts changes in the composition of industrial sectors in the United States and other developed countries.4 We focus on the period 1997–2015 because the data are comparable across countries in this period because of uniform methodology.5 As shown in the figure, there was a shift from manufacturing toward services in all countries, but the shift was significantly less pronounced in the United States.
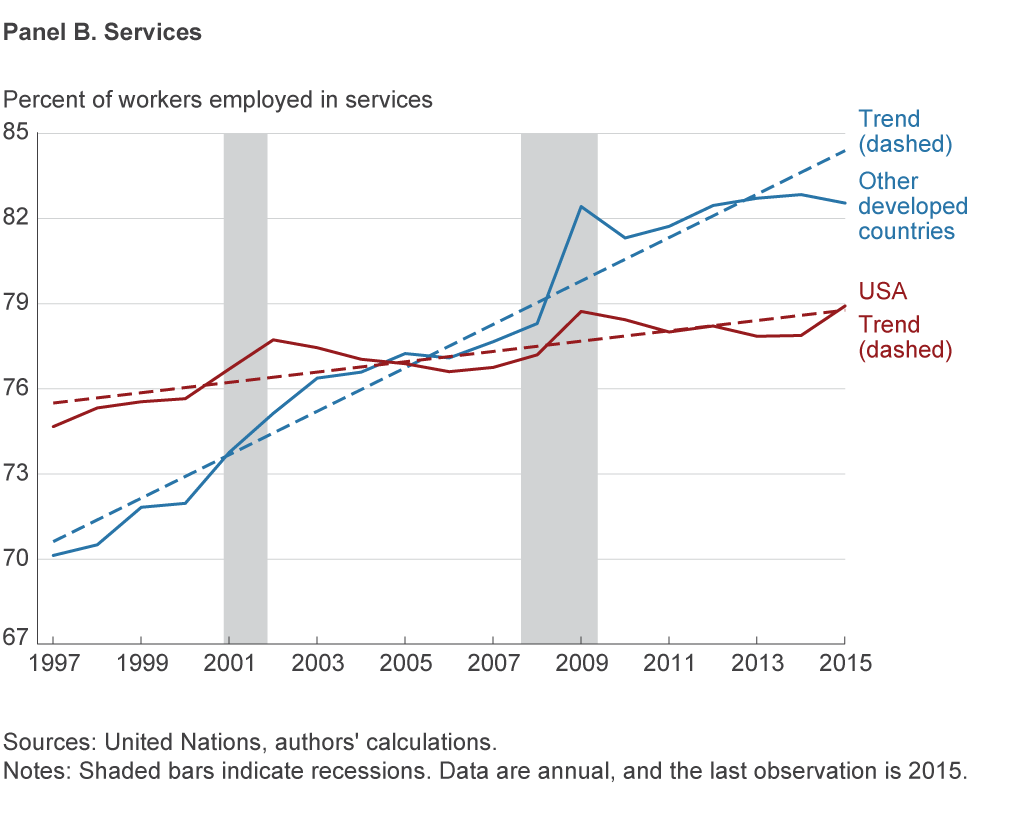
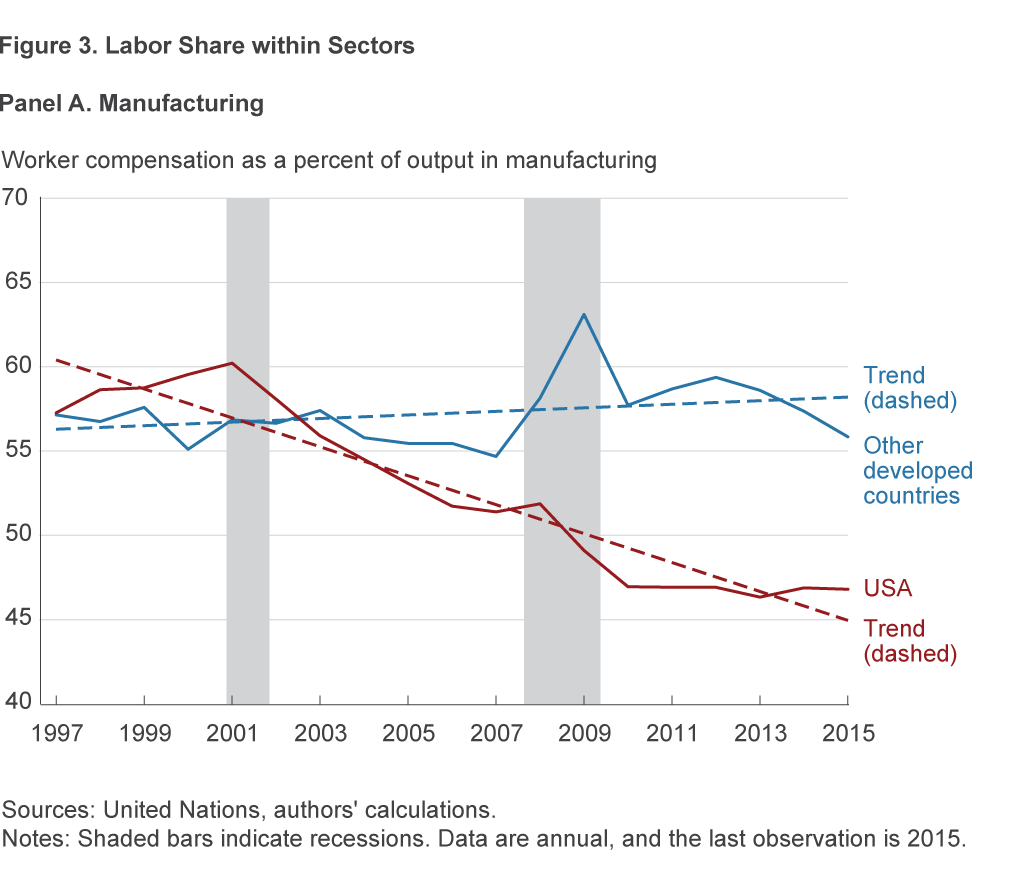
Moreover, as shown in figure 3, the decrease in the labor share within the manufacturing sector has been mostly a US phenomenon; that is, the share of manufacturing output that accrues to workers in the form of compensation has declined in United States but not in other developed countries. So, while the share of manufacturing jobs has declined less in the United States than in other developed countries, US workers retained less of the output produced in the sector in the form of compensation than did workers in other developed countries. In fact, the average labor share in manufacturing in other developed countries actually increased slightly over the period 1997–2015. In addition, while the labor share in the services sector was mostly flat in the United States in the 1997–2015 period, it increased in other developed economies. As a result, the gap between the manufacturing and services labor shares has decreased in other developed countries.
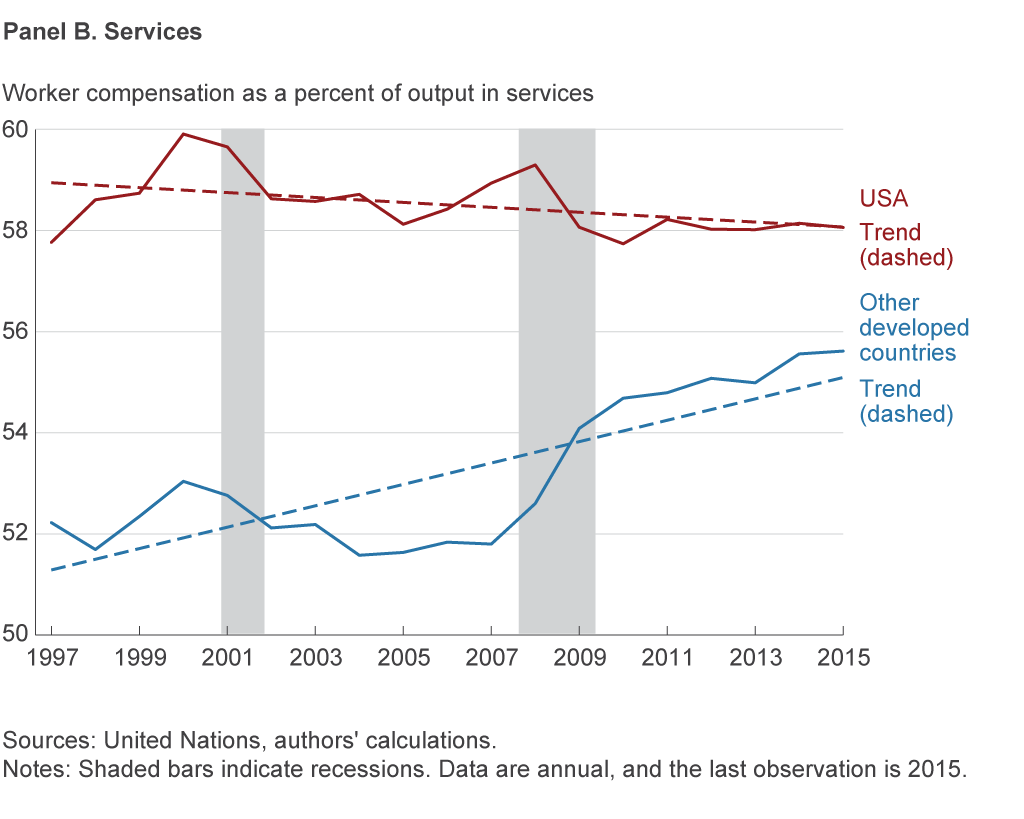
Overall, figures 1–3 show that the decline in the labor share in the United States has occurred because of changes both in sectoral composition and changes in the labor share within sectors over time. By contrast, in other developed countries the shift in sectoral composition from manufacturing to services, while it occurred and was in fact larger than in the United States, is unlikely to account for the overall decline in those countries’ labor share. That is because changes in the labor shares within those sectors in other developed countries have resulted in a smaller gap between the labor shares in the two sectors. Because labor shares in manufacturing and services are more similar in other developed countries, shifts in sectoral composition from manufacturing to services affect the overall labor share less than in the United States.
Changes in the Relative Price of Investment as an Explanation
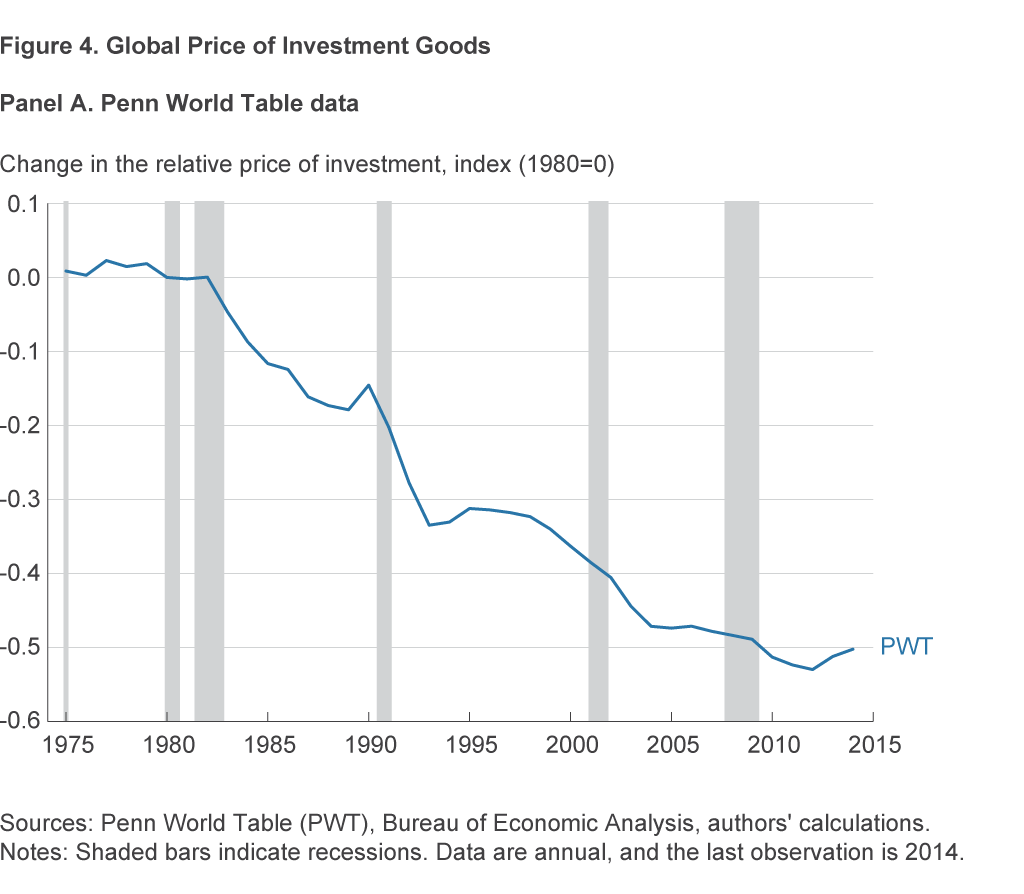
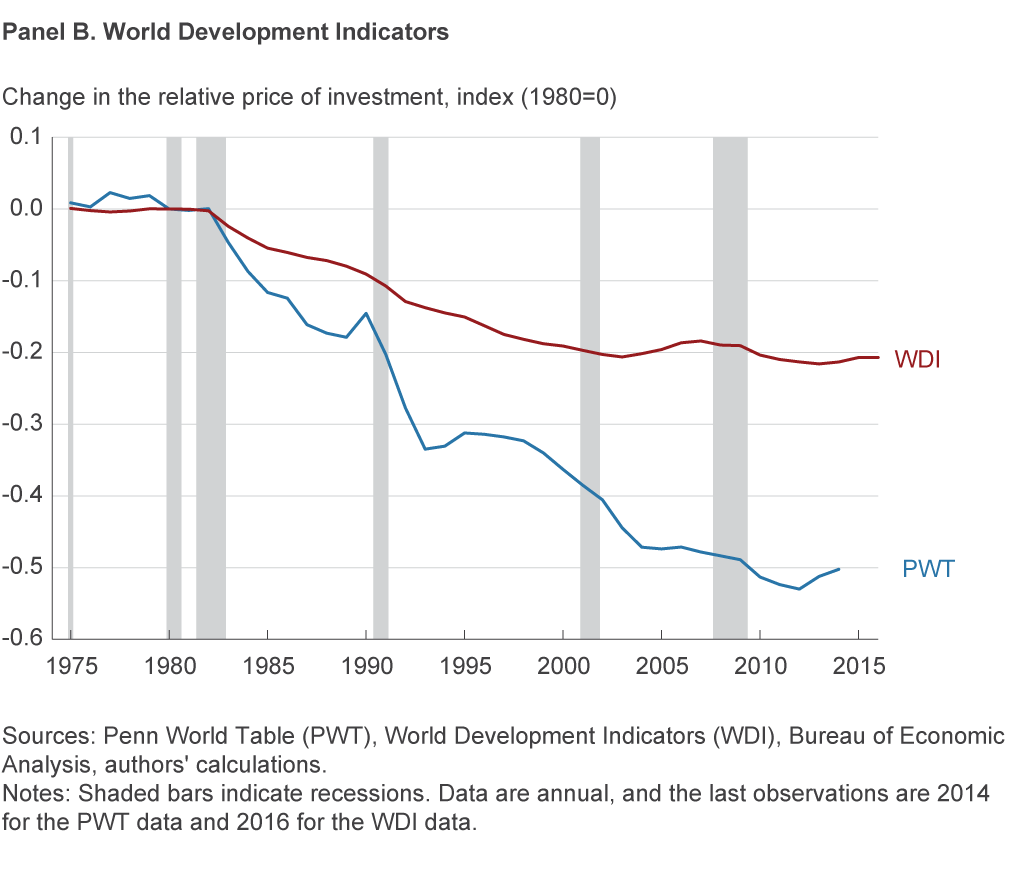
Karabarbounis and Neiman (2013) suggest that a decline in the relative price of investment goods is responsible for the downward movement in the labor share. To investigate this hypothesis, we plot the change in the relative price of investment goods over time across all countries in the sample using data from the Penn World Table (figure 4, panel A).6 Similar to what Karabarbounis and Neiman found, we see a decline in the relative price of investment goods. This pattern is broadly consistent with the hypothesis that suggests a capital-labor substitution could trigger the decline in the labor share that is observed in the data. A similar pattern—although somewhat less steep—is observed when we use an alternative measure of the relative price of investment goods that is based on data from the World Bank’s World Development Indicators (WDI), shown in figure 4, panel B.7
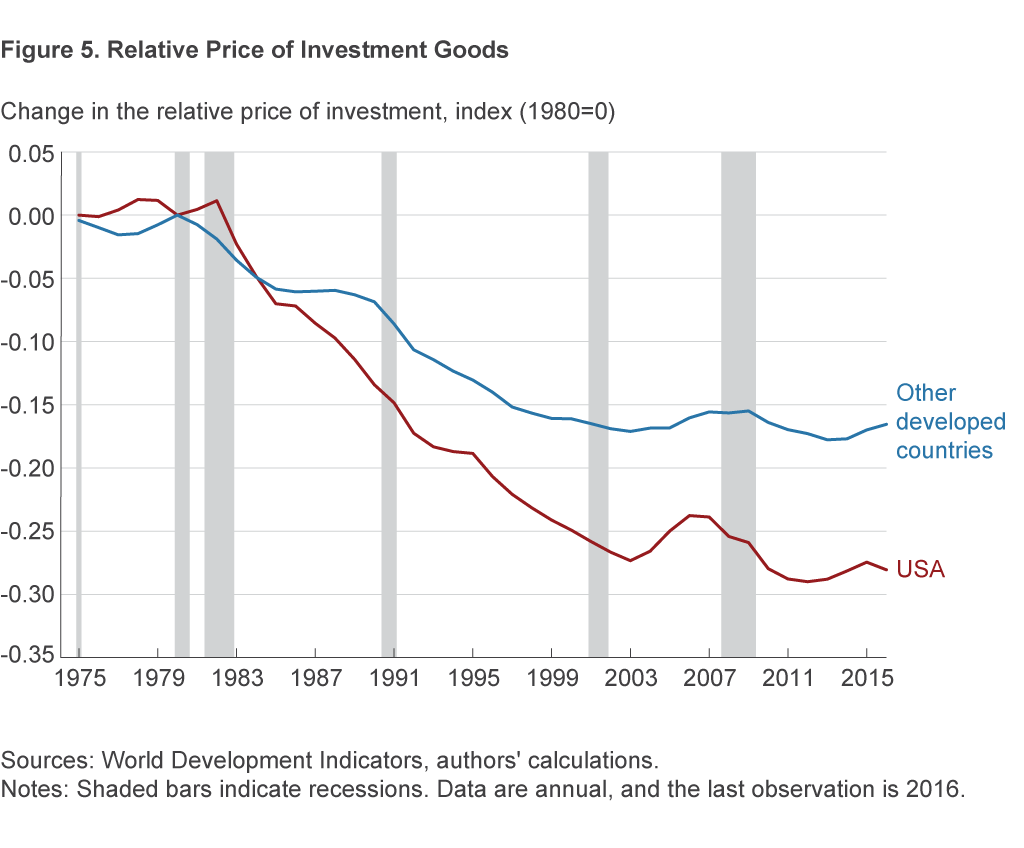
The benefit of the WDI measure is that it allows us to present the results for the United States and other developed countries separately, without the above-mentioned concerns about uniform methodology. This comparison is presented in figure 5, and it shows that movements in the relative price of investment goods have been similar for the United States and other developed countries, although the decline in the United States has been larger, a difference that possibly explains the bigger decline in the US manufacturing labor share.
Conclusion
In most developed countries, the labor share has declined over the last 20 years. However, the underlying reasons for the decline may be different in the United States and other developed countries. We find that explanations based on changes in the sectoral composition of the economy are better suited to explain the US experience than the experience of other developed countries. Both the United States and other developed countries experienced a shift from manufacturing to services, and the shift was in fact smaller in the United States, but because labor shares within each sector are more similar in other developed countries, the sectoral shift affects those countries’ overall labor share less than in the United States where the gap is more significant.
We also find that explanations for the decline in the labor share based on a decline in the relative price of investment goods triggering a substitution of capital for labor are broadly consistent with the empirical evidence in both the United States and other developed countries. However, the decline in the relative price of investment goods was significantly larger in the United States, and the size of the decrease could possibly explain a bigger share of the decline in the US labor share.
Footnotes
- The evolution of the labor share in developing countries tends to be quite different than the evolution observed in developed countries (see Harrison 2005). Return
- Candidate countries are countries that have applied to become members of the European Union and are in the process of negotiations to determine whether they can join the EU. http://ec.europa.eu/environment/enlarg/candidates.htm. Return
- In order to calculate the labor share and related measures, we combine the following databases: the AMECO database provided by the European Commission, the UN database from the National Accounts Official Country Data, the Penn World Table, and the World Bank’s World Development Indicators. Our estimates for total labor share include the following countries: Australia, Austria, Belgium, Bulgaria, Canada, Croatia, Cyprus, the Czech Republic, Denmark, Estonia, Finland, France, Germany, Greece, Hungary, Iceland, Ireland, Italy, Latvia, Lithuania, Luxembourg, Malta, Mexico, the Netherlands, New Zealand, Norway, Poland, Portugal, Romania, Slovakia, Slovenia, Spain, Sweden, and the United Kingdom. Data sources can be found at the following locations: AMECO, https://ec.europa.eu/info/business-economy-euro/indicators-statistics/economic-databases/macro-economic-database-ameco/download-annual-data-set-macro-economic-database-ameco_en; the UN database, http://data.un.org/Explorer.aspx?d=30; Penn World Table (PWT) and the relative price of investment goods, https://www.rug.nl/ggdc/productivity/pwt/; the World Bank’s World Development Indicators (WDI) and the relative price of investment goods, https://data.worldbank.org/products/wdi. Return
- The only available data source that allows us to perform this decomposition came from the UN database. Return
- The statistics for each country or area are presented according to the uniform table headings and classifications as recommended in the United Nations System of National Accounts 1993 (1993 SNA). Different series numbers (dimension “Series”) are used to store different time-series versions of national accounts statistics. In addition to different methodologies, different series numbers are used when data are reported in different currencies, fiscal years, or by different sources. Furthermore, data are stored under a new series number whenever there are significant changes in compilation practices that make the time series no longer comparable. In our calculations, we focus on series that follow the 2008 SNA national accounts methodology and are coded Series=1000. The drawback of using this restriction is that it limits us to the 1997–2015 period. More details are presented in the online appendix that accompanies this Commentary. Return
- As Karabarbounis and Neiman (2013) point out, the Penn World Table (PWT) data are converted using investment-specific and consumption-specific purchasing power parity exchange rates. This measurement is undesirable for our exercise because we want to know the price of investment relative to consumption that a domestic producer faces. Following Restuccia and Urrutia (2001), we divide the PWT relative price of investment (pli/plc) of each country by the PWT relative price of investment in the United States. We then multiply this ratio by the ratio of the investment price deflator to the personal consumption expenditure deflator for the United States, obtained from the Bureau of Economic Analysis. Moreover, we normalize the result by indexing the first observation for each country to be one. We take logs and standardize results such that the value at 1980 is 0. This procedure yields for each country the relative price of investment measured at domestic prices. Finally, because all the calculations involve adjustments based on the US price deflators, in order to avoid spurious comovements, we present all countries together and do not split out the US change from the change in other developed countries. Return
- We follow the calculations presented by Karabarbounis and Neiman (2013) using World Development Indicators (WDI). In particular, we divide the fixed investment deflator by the private consumption deflator, where the deflator is created as the GDP deflator, i.e., (nominal/real)*100. Moreover, we normalize the result by indexing the first observation for each country to be one. Finally, we take logs and standardize results such that the value at 1980 is 0. Return
References
- Armenter, Roc. 2015. “A Bit of a Miracle No More: The Decline of the Labor Share.” Federal Reserve Bank of Philadelphia, Business Review, Third Quarter: 1–9.
- Blanchard, Oliver J. 1997. “The Medium Run.” With comments by William D. Nordhaus and Edmund S. Phelps. Brookings Papers on Economic Activity, 1997, 89–158.
- Commission, European. 2007. Employment in Europe 2007. European Commission Technical Report.
- Elsby, Michael W. L., Bart Hobijn, and Aysegul Sahin. 2013. “The Decline of the US Labor Share.” Brookings Papers on Economic Activity, 2013, 1–63.
- Harrison, Ann. 2005. “Has Globalization Eroded Labor’s Share? Some Cross-Country Evidence.” University Library of Munich, Germany, MPRA Paper.
- Karabarbounis, Loukas, and Brent Neiman. 2013. “The Global Decline of the Labor Share.” The Quarterly Journal of Economics, 129(1): 61–103.
- Restuccia, Diego, and Carlos Urrutia. 2001. “Relative Prices and Investment Rates.” Journal of Monetary Economics, 47(1): 93–121.
Suggested Citation
Pinheiro, Roberto B., and Meifeng Yang. 2018. “The Evolution of the Labor Share across Developed Countries.” Federal Reserve Bank of Cleveland, Economic Commentary 2018-08. https://doi.org/10.26509/frbc-ec-201808
This work by Federal Reserve Bank of Cleveland is licensed under Creative Commons Attribution-NonCommercial 4.0 International

