

- Share
Unconventional Monetary Policy Measures and Inflation Expectations
The record increase in the size of the Federal Reserve’s balance sheet after the financial crisis ignited fears among some people that high inflation would inevitably follow. We investigated whether those fears were supported in survey or market measures of inflation expectations around the time that large-scale asset purchases were announced. Nothing suggests that the Fed’s new policy tools have been perceived by professional forecasters or financial markets as harbingers of hyperinflation.
The views authors express in Economic Commentary are theirs and not necessarily those of the Federal Reserve Bank of Cleveland or the Board of Governors of the Federal Reserve System. The series editor is Tasia Hane. This paper and its data are subject to revision; please visit clevelandfed.org for updates.
After its conventional monetary policy tool, the federal funds rate, hit the zero lower bound, the Federal Reserve implemented a number of new tools, including large-scale asset purchases, to provide stimulus to the economy in the Great Recession and the subsequent slow recovery. Such measures caused an unprecedented increase in the Fed’s balance sheet and led some to fear that high inflation would soon follow. In this Economic Commentary, we argue that historical data for various measures of expected inflation did not provide any support for those fears. In addition, a look at the past six years shows that these fears have not materialized.
Unusual Times and the Expansion of the Fed Balance Sheet
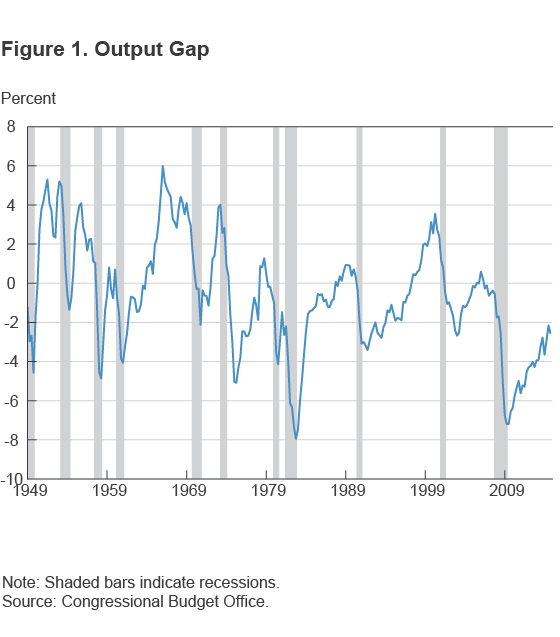
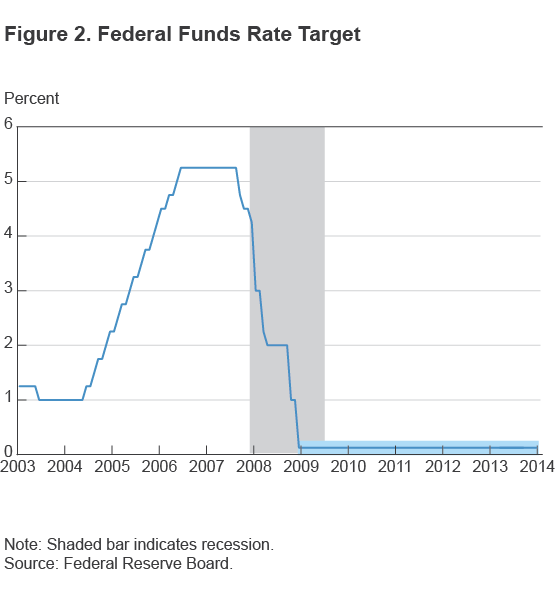
Figure 1 shows the severity of the Great Recession in terms of the output gap, the difference between actual and potential output (GDP). A negative output gap refers to a period in which the economy produces less than its potential, and the Great Recession was associated with an exceptionally large and persistent negative output gap. The recovery that followed has also been slow. According to the estimate published by the Congressional Budget Office (CBO), the output gap bottomed out in 2009:Q2 but still has not turned positive more than five years into the recovery. Figure 2 shows that the Federal Open Market Committee (FOMC) responded to the financial crisis and the recession by cutting the federal funds rate target, finally dropping it to a range between zero and 0.25 percent on December 16, 2008.
In addition, at the peak of the financial crisis, the Federal Reserve also introduced its first Large-Scale Asset Purchases (LSAP) program, or quantitative easing (QE), through which it would purchase agency debt, agency mortgage-backed securities (MBS), and long-term Treasury securities. Since then, it has introduced several unconventional policy measures, as there was no room to stimulate the economy with further rate cuts. The direct and easily observable outcome of these measures was a record increase in the Fed’s balance sheet—it nearly quintupled between September 2008 and December 2014.1 According to the quantity theory of money, an increase in the money supply leads to an equal increase in prices (assuming other things stay constant). Some people feared that the increase in the Fed’s balance sheet would eventually be reflected in inflation of a similar magnitude.
We are interested in whether those fears were supported in survey or market measures of inflation expectations. To answer that question, we look at these expectations measures at various points in time around three major policy changes, namely the first, second, and third rounds of the LSAP program (QE1, QE2, and QE3). The points at which we check inflation expectations are those when the program was signaled or announced, as well as 3 and 6 months after the program was put into effect. The choice of the 3- and 6-month periods is arbitrary; nevertheless, they should still reflect any changes that the survey participants and market players had in their outlook after the policies started.
Since some rounds of QE were introduced in stages, we date the 3- and 6-month points from the time of the last announcement for that particular round. For example, the first round, QE1, started with the purchase of agency debt and agency MBS in November 2008 and continued with the purchase of long-term Treasury securities in March 2009, so we date it from March 2009. In table 1, we show the signaling and announcement dates for each round of QE. The Fed adopted other unconventional policy tools like forward guidance and the Maturity Extension Program (Operation Twist), but we focus on QE because it affects the size of the balance sheet directly. Forward guidance has no direct effect on the balance sheet, while Operation Twist affected only the composition of the balance sheet.
Table 1. Timeline for Large-Scale Asset Purchase Program (Quantitative Easing)
| Round | Phase | Signaling or announcement date | Program specifics |
|---|---|---|---|
| First (QE1) |
1 | November 25, 2008 | The Federal Reserve announces that it will purchase up to $500 billion of agency mortgage-backed securities (MBS) and $100 billion of federal-agency debt. |
| December 16, 2008 | The Federal Reserve first mentions the possible purchase of long-term Treasury securities. | ||
| 2 | March 18, 2009 | The Federal Reserve announces that it will purchase up to an additional $750 billion of agency MBS and increase its purchases of agency debt this year by up to $100 billion. Moreover, the FOMC decides to purchase up to $300 billion of long-term Treasury securities over the next six months. | |
| Second (QE2) |
August 27, 2010 | Chairman Bernanke signals that the FOMC is likely to buy longer-term securities by saying it is one of the tools that the Federal Reserve retains for providing additional stimulus. | |
| 1 | November 3, 2010 | The Federal Reserve announces that it will purchase a further $600 billion of longer-term Treasury securities by the end of 2011:Q2, at a pace of about $75 billion per month. | |
| Third (QE3) |
August 31, 2012 | Chairman Bernanke states that the Federal Reserve will provide additional policy accommodation as needed to promote a stronger economic recovery and sustained improvement in labor market conditions in a context of price stability. | |
| 1 | September 13, 2012 | The Federal Reserve announces an open-ended commitment to purchase $40 billion in agency mortgage-backed securities per month until the labor market improves substantially. | |
| 2 | December 12, 2012 | The Federal Reserve adds a commitment to purchase $45 billion in longer-term Treasury securities per month. |
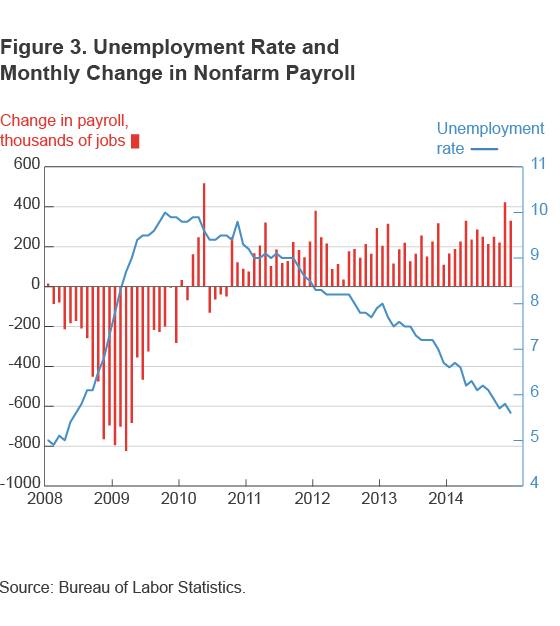
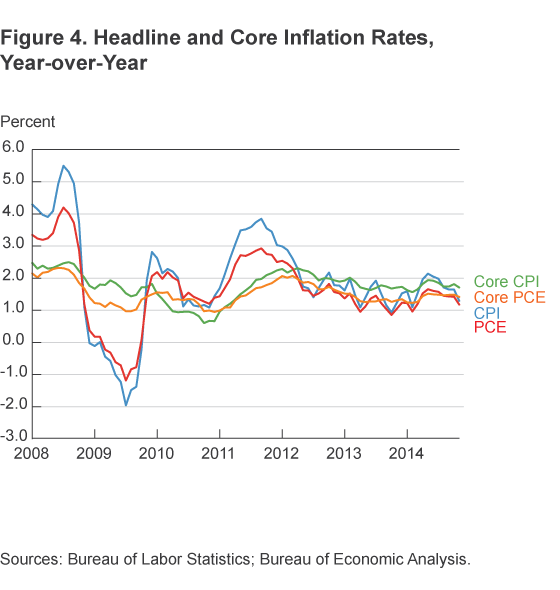
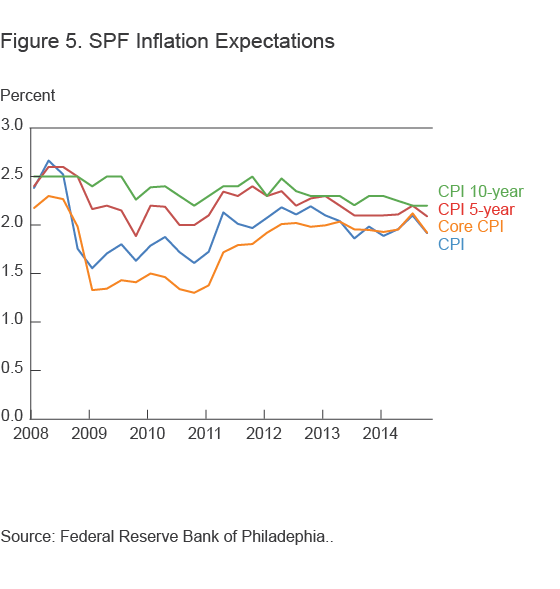
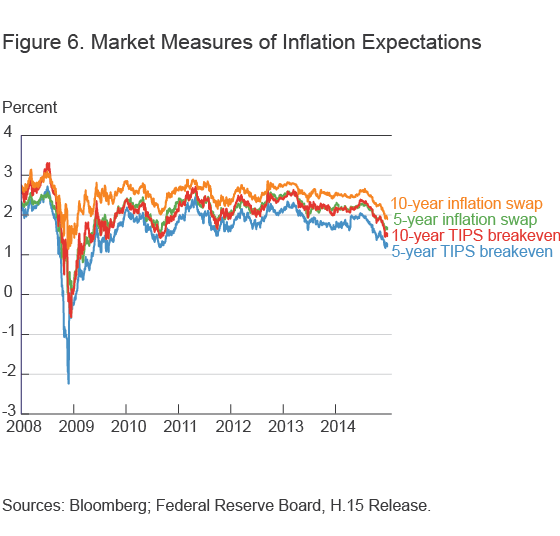
For each round of QE, we summarize the economic conditions around the time it was introduced. We consider a number of indicators that the Federal Reserve may have considered when making its decision to introduce a new measure. We include GDP, the unemployment rate, and payroll employment to reflect economic activity; the CPI, PCE, core CPI, and core PCE for inflation; and survey and market measures of inflation expectations. Survey measures come from the Philadelphia Fed’s quarterly Survey of Professional Forecasters (SPF), and market measures include medium- and long-term inflation expectations derived from TIPS breakeven rates and inflation swap rates. Figures 3-6 present these economic indicators for the period between 2008 and 2014, which spans all three rounds of QE.2
First Round of the LSAP (QE1)
The US economy entered the recession in the fourth quarter of 2007. Although GDP grew by 2 percent in the second quarter of 2008, the economy started to lose jobs in February 2008. The pace of the job losses intensified toward the end of summer 2008, and GDP growth turned negative again in the third quarter of 2008. In addition, there was considerable distress in financial markets in the months leading up to and following the Lehman Brothers collapse.
In order to reduce the cost and increase the availability of credit for the purchase of homes, and in turn to support housing markets and foster improved conditions in financial markets more generally, the Fed announced on November 25, 2008, that it would buy government-sponsored enterprise (GSE) debt and mortgage-backed securities (MBS) backed by GSEs. Economic activity continued to deteriorate, and policymakers saw a decline in GDP in the last quarter of 2008 of 8.2 percent (annualized). By March 2009, the unemployment rate had climbed to 8.7 percent, and the economy had lost about 3 million jobs in the last four months. In response, the Fed announced a second phase of QE1, in which it would start buying long-term Treasury securities and engage in further purchases of GSE debt and MBS.
In addition to measures of economic activity, the Fed also paid attention to measures of inflation and inflation expectations in assessing economic conditions and policy options. Although the 12-month increase in the CPI was running high in October 2008, this was the result of a rapid increase in energy prices in the summer of 2008. With the decline in GDP in the fourth quarter of 2008, inflation started to decelerate rapidly. By January 2009, the annual CPI and PCE inflation rates had declined to 0.0 percent and 0.2 percent, respectively.
Market measures for five- and ten-year inflation expectations started to decline in July 2008. For example, the 5-year TIPS breakeven inflation rate and the 5-year inflation swap rate declined about 1.4 percentage points to 1.2 percent and1.9 percent, respectively, between July 1 and September 15, 2008, the day Lehman Brothers filed for bankruptcy protection. The declines continued, and by November 25, 2008, the 5-year TIPS breakeven inflation rate had already turned negative at −2.1 percent. One can argue, quite fairly, that these measures are contaminated by liquidity premiums, especially at the peak of the financial crisis. It also seems that the TIPS measures are more prone to this than the inflation swaps. Nevertheless, the measures reflect a long disinflationary period. Survey measures of the medium- and long-term inflation outlook diverged from the market measures during this time: Long-term survey expectations were well-anchored.
As for short-term inflation expectations, SPF participants cut their 1-year inflation expectation for both CPI and core CPI from the 2008:Q3 to 2008:Q4 survey, the last of which was released about two weeks before the QE1 announcement. Their 1-year CPI inflation expectation fell by 0.7 percentage points to 1.8 percent, and their core CPI expectation fell by 0.3 percentage points to 2 percent. As the decline in economic activity became more evident in the first quarter of 2009, SPF survey respondents adjusted their inflation outlook. For example, by February 2009, SPF 1-year inflation expectations for the CPI and the core CPI were 1.6 and 1.3 percent, respectively, their lowest point historically until then. On average, SPF forecasters gave a 50 percent chance to the possibility that the core CPI would be less than 1 percent by the end of the year and an 90 percent chance that it would be 2 percent by then.
After the introduction of QE1, survey and market measures of inflation expectations behaved differently. For example, the 10-year SPF inflation expectation was 2.4 percent at the time the last phase of QE1 was announced, while three and six months later it was 2.5 percent. Long-term expectations from surveys were well-anchored after QE1. On the other hand, market measures of medium- and long-term expectations increased significantly after QE1, though they were still consistent with convergence toward the then-implicit medium-term inflation target of the FOMC, not with high inflation. For example, the 20-day average of the 10-year TIPS breakeven inflation rate was 1.0 percent on March 18, 2009. Three months later it was 1.9 percent, and six months later 1.9 percent.
We conclude that QE1 was a reaction to a quickly worsening economic environment, with a high level of financial distress and market expectations of disinflation in the medium- and long-term. We see that neither professional forecasters nor the markets worried about a looming inflationary environment at the start of the program or after.
Second Round of the LSAP (QE2)
The Great Recession ended in the second quarter of 2009, but the recovery that followed was slow. The monthly change in both total nonfarm employment and total private employment was not positive until March 2010. By July 2010, the unemployment rate was 9.4 percent, and CPI and core CPI inflation measures were low—annual CPI inflation was 1.3 percent and core CPI inflation was 1.0 percent. While long-term survey expectations were well-anchored during this period, medium- and long-term market inflation expectations reflected a disinflationary outlook. In addition, survey measures reflected a high likelihood of short-term inflation being below 2 percent.
At the Jackson Hole conference on August 27, 2010, then-Fed-Chairman Ben Bernanke signaled that the FOMC was likely to buy longer-term securities, stressing the economic challenges facing the nation, especially the stagnation of the labor market. In particular, he mentioned that conducting additional purchases of longer-term securities was one of the policy options that had been part of recent discussions at FOMC meetings. Economic conditions continued to deteriorate, and about two months later, on November 3, 2010, the FOMC announced a second round of the LSAP program (QE2). The new round was intended to support the recovery and help ensure that inflation, over time, was at a level consistent with the Fed’s mandate.
A look at survey measures of inflation expectations from three and six months after the announcement of QE2 show that disinflationary pressures abated after the program’s introduction. The SPF 1-year core CPI inflation expectation increased by 0.4 percentage points between the announcement and the 6-month marks, reaching 1.7 percent, whereas the 1-year CPI inflation expectation increased by 0.5 percentage points, ending at 2.1 percent. Market measures of inflation expectations also rose. For example, the 20-day average of the 5-year TIPS breakeven inflation rate increased from 1.5 percent on November 3, 2010, to 2.0 percent on February 3, 2011, and to 2.3 percent on May 3, 2011. The (risk-neutral) probability of CPI inflation in one year being lower than 1 percent, as measured from the 20-day average of inflation floors, dropped from 43 percent to 25 percent and 3 percent on those dates.
We conclude that QE2 was a response to a troublingly slow and worsening recovery as well as potential disinflation. Both survey and market measures of inflation expectations show that rather than stoking a fear of high inflation, QE2 corrected inflation expectations toward a level consistent with the FOMC’s inflation mandate.
Third Round of the LSAP (QE3)
The pace of the recovery increased in the fourth quarter of 2011, and payroll growth was strong between November 2011 and April 2012. But GDP growth declined again in the first and second quarters of 2012. The unemployment rate was still over 8 percent, three years into the recovery. However, unlike the earlier periods in which QE1 and QE2 were announced, nothing around this time pointed to a significant disinflationary outlook. We don’t see a considerable worsening of short- or long-term survey expectations or low levels of breakeven or inflation swap rates before QE3 was announced in September 2012. For example, the SPF 1-year inflation expectation for the CPI and core CPI were 2.1 percent and 2 percent in August 2012, levels much higher than in the summer and fall of 2010 before QE2 was introduced.
While 5- and 10-year SPF inflation expectations fell a bit at this time, they were still well in line with the FOMC’s mandate, at 2.2 percent and 2.4 percent, respectively. Although there was some ease on the breakeven rates and inflation swap rates in spring and early summer, by the time Chairman Bernanke signaled further long-term asset purchases, these were already reversed. For example, as of August 31, 2012, the 20-day average of 10-year inflation swaps was 2.5 percent—quite a bit higher than before QE1 and QE2. Consistent with the stable inflation outlook suggested by these measures, when the FOMC announced the start of QE3, it cited the need to continue the program until labor markets improved substantially.
The change in both short-and long-term survey expectations after QE3 was very limited. For example, the SPF 1-year CPI inflation expectation increased slightly by 0.1 percentage points to 2.2 percent in the 2012:Q4 survey followed by declines of 0.1 percentage points in the next two surveys. The SPF 10-year CPI inflation expectation declined by 0.1 percentage points to 2.3 percent in 2012:Q4 survey and stayed there for the next two quarters. Market measures, on the other hand, increased after Chairman Bernanke stated in August 2012 that a third round of the LSAP program might be needed and further rose following the official announcement in September 2012. For example, the 10-year TIPS breakeven rate rose by 0.4 percentage points to 2.6 percent between August 30 and September 14, 2012. Market measures continued to rise through the start of the second phase of QE3, and three months later they were higher than they had been at the end of August 2012. However, by June 2013 they were even lower than they had been before the start of QE3.
We see that QE3 was introduced to support the recovery of labor markets and that inflation expectations around the time do not support the view that QE3 created expectations of high inflation. Survey measures were virtually unaffected, and market measures, while they did rise throughout the early part of the program, they fell again later.
Has the Fear of High Inflation Materialized?
We have argued that the LSAP program was designed to support real economic activity and to offset disinflationary pressures. We have shown that fears of high inflation were not supported by survey or market measures of inflationexpectations at the time each round was introduced, or three and six months after their introduction. Nevertheless, one may argue the possibility of an adverse effect on inflation over the long term. In table 2 we show that those fears have not materialized six years after the FOMC started the first round of the LSAP program.
In table 2, we compare inflation levels in different periods. The table shows the average inflation for all decades since the 1960s (panel A) as well as some for particular periods defined by using December 1984, February 1994, and November 2008 as break points (panel B). The first of these dates is associated with the start of the Great Moderation, the second with when the Fed started to use the federal funds rate as its explicit policy tool, and the final one with the start of QE1.
Table 2A. Annualized Inflation Rates over Different Decades (percent)
| CPI | Core CPI | PCE | Core PCE | |
|---|---|---|---|---|
| 12/1959–12/1969 | 2.51 | 2.59 | 2.27 | 2.38 |
| 12/1969–12/1979 | 7.39 | 6.75 | 6.65 | 6.07 |
| 12/1979–12/1989 | 5.09 | 5.69 | 4.68 | 5.03 |
| 12/1989–12/1999 | 2.94 | 3.11 | 2.25 | 2.29 |
| 12/1999–12/2009 | 2.56 | 2.14 | 2.12 | 1.84 |
| 12/2009–12/2014 | 1.68* | 1.63* | 1.48* | 1.43* |
Table 2B. Annualized Inflation Rates over Different Periods (percent)
| CPI | Core CPI | PCE | Core PCE | |
|---|---|---|---|---|
| 12/1959–12/1984 | 5.24 | 5.14 | 4.74 | 4.62 |
| 12/1959–11/2008 | 4.13 | 4.09 | 3.63 | 3.56 |
| 12/1984–11/2008 | 2.98 | 3.01 | 2.48 | 2.46 |
| 12/1984–2/1994 | 3.66 | 4.13 | 3.22 | 3.47 |
| 2/1994–11/2008 | 2.57 | 2.31 | 2.02 | 1.83 |
| 11/2008–12/2014 | 1.71* | 1.64* | 1.47* | 1.42* |
* indicates the lowest across the periods.
Sources: Bureau of Labor Statistics; Bureau of Economic Analysis.
Average inflation—as measured by all four of the different price measures in table 2—is lowest in the recent period. Moreover, only in this period is average inflation below 2 percent.
Current readings of survey and market-based inflation expectations also show that forecasters and market participants do not expect high inflation in the short, medium or long terms. For example, as of November 2014, the SPF 10-year inflation expectation is at 2.2 percent. As of December 31, 2014, the 20-day average of the 10-year breakeven rate is 1.6 percent, and the 10-year inflation swap rate is 2.0 percent.
We conclude that each round of QE should be viewed as a response to very unfavorable economic conditions at a time when further stimulus to the economy could not be provided by means of the federal funds rate because of the zero lower bound. Nothing suggests that the Fed’s new policy tools have been perceived by professional forecasters or financial market participants as harbingers of hyperinflation.
Footnotes
- The figure (All Federal Reserve Banks - Total Assets, Eliminations from Consolidation) was about $0.9 trillion on September 3, 2008. It was about $4.5 trillion on December 31, 2014. The Federal Reserve had initiated various liquidity programs before the first round of QE (QE1), and these led to increases in the Fed’s balance sheet which predated QE1. Although these liquidity programs ended, the balance sheet kept increasing due to asset purchases. That is why we took the balance sheet figure from September 3, 2008, for the comparison. Return to 1
- In the figures, we present the revised numbers, not the real-time data. Although the revised and real-time data differ, sometimes to a large extent, our qualitative analysis is not different with respect to our preferred choice of revised data. In addition, the data we use for the expectations, like the market data or the measures from the SPF survey, do not have any revisions. Return to 2
Suggested Citation
Pasaogullari, Mehmet. 2015. “Unconventional Monetary Policy Measures and Inflation Expectations.” Federal Reserve Bank of Cleveland, Economic Commentary 2015-07. https://doi.org/10.26509/frbc-ec-201507
This work by Federal Reserve Bank of Cleveland is licensed under Creative Commons Attribution-NonCommercial 4.0 International

