

- Share
Education and Employment Opportunities for Younger Workers in the Cleveland MSA
This data brief describes changes in the Cleveland MSA labor market during the recession and recovery period of 2006-2011. We see welcome gains in education at both ends of the spectrum: the share of young workers with a Bachelor’s degree has risen and the share of those without a high school degree has dropped. However, among occupations requiring less than a college degree, lower-wage service occupations have remained more robust to declines in employment and wages compared to other low-skill, higher-wage occupations.

The views expressed in this report are those of the author(s) and are not necessarily those of the Federal Reserve Bank of Cleveland or the Board of Governors of the Federal Reserve System.
This data brief describes changes in the Cleveland MSA labor market during the recession and recovery period of 2006-2011. We see welcome gains in education at both ends of the spectrum: the share of young workers with a Bachelor’s degree has risen and the share of those without a high school degree has dropped. However, among occupations requiring less than a college degree, lower-wage service occupations have remained more robust to declines in employment and wages compared to other low-skill, higher-wage occupations.
In this data brief, we examine the educational attainment levels, employment status, and occupations of workers in the Cleveland MSA. Our analysis focuses primarily on the job prospects for those aged 18 to 35—referred to herein as “young”—with no post-secondary degree. We describe changes in education, employment, and wages between 2006 and 2011 and provide projected job growth in the region by skill-level requirements.
Between 2006 and 2011, the Cleveland MSA experienced a notable increase in the share of young workers holding a bachelor’s degree (from 15% to 19%) and a decline in the share of young workers with less than a high school diploma (from 9% to 7%). In fact, Cleveland experienced larger improvements at both ends of the educational attainment distribution in this time period compared to Ohio. Overall, the educational attainment of young labor market participants in the Cleveland MSA in 2011 is very similar to that of Ohio, as seen in Chart 1.
Chart 1: Educational Attainment of Individuals 18-35 Years of Age, 2011
Source: Public Use Micro Data Sample (PUMS), 1-year estimates, 2011
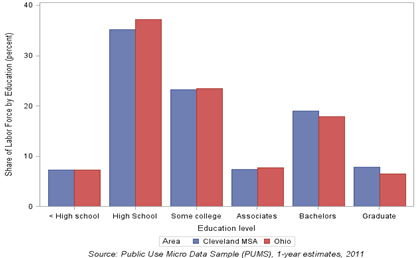
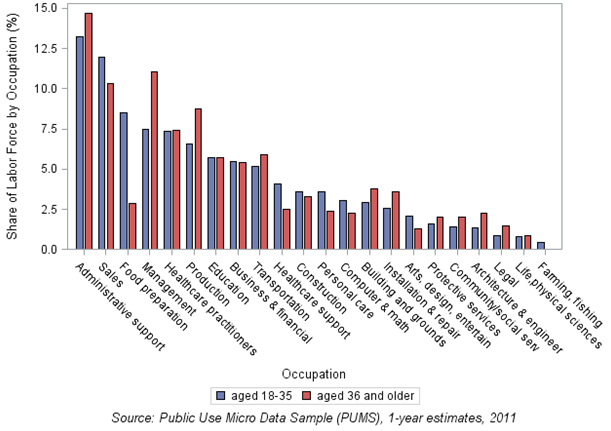
Chart 2 shows the distribution of younger and older (aged 36+) workers across occupations in the Cleveland MSA. Relative to the older group, the younger group has a smaller share of workers in management jobs. While This may be due to obvious differences in work experience, as well as changes in the educational levels required for these positions. But younger workers are also less represented than older workers in Production, Administrative Support, and Installation & Repair occupations, all of which had average annual wages far above those for Food Preparation & Services and Healthcare Support, occupations with relatively high shares of young workers.
Chart 2: Distribution of workers in occupations by age groups in Cleveland MSA, 2011
Source: Public Use Micro Data Sample (PUMS), 1-year estimates, 2011
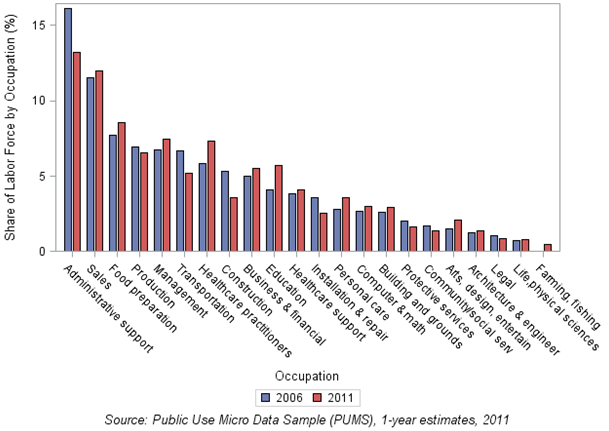
Young workers in the Cleveland MSA experienced increasing shares in both the lower-skill, lower-wage occupations and in higher-skill, higher-wage occupations, but decreasing shares in occupations that tend to offer middle-class wages. Between 2006 and 2011, for example, the share of Administrative Support occupations declined among workers of all ages, and more so for young workers, whose share dropped from 16 percent in 2006 to 13 percent in 2011. Similarly, the share of young workers employed in Construction and Transportation occupations in the Cleveland MSA also declined, a trend also seen at the national level. Although young workers saw gains in their shares of employment in both Food Preparation & Services and Personal Care & Services occupations in this time period, jobs in these sectors on average pay less than either Construction or Transportation jobs. However, the Cleveland MSA has also experienced an increase in the share of younger workers in occupations that tend to require more education and, on average, pay higher wages, such as Education and Healthcare Practitioner jobs.
Chart 3: Distribution of young workers in occupation by year, Cleveland MSA
Source: Public Use Micro Data Sample (PUMS), 1-year estimates, 2011
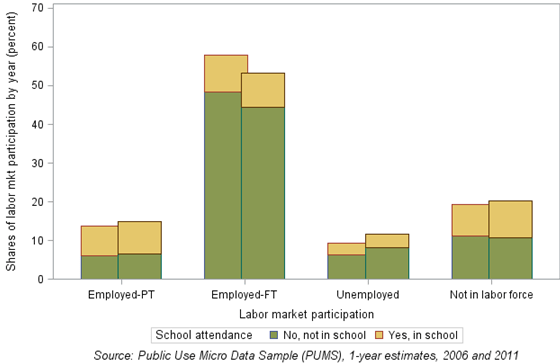
Next, we look at changes in the share of young adults in the labor market and the share of young workers employed full-time from 2006 to 2011. Individuals working 30 or more hours a week are considered to hold a full time job. The move from full-time to part-time positions has occurred mainly in Food Preparation & Services, Transportation, and Sales. About 56 percent of part-time and 17 percent of full-time young workers report attending school in the Cleveland MSA, both in 2006 and 2011. At the same time, the school attendance rate of young adults not in the labor force rose from 42 percent to 47 percent from 2006 to 2011.
Chart 4: Labor market participation and school attendance of population aged 18-35 in the Cleveland MSA
Note: 2006 left bars and 2011 bars right
Source: Public Use Micro Data Sample (PUMS), 1-year estimates, 2006 and 2011
At this point in our analysis, we characterize recent changes in occupations based on differences in the educational attainment of their workers, their wages, and employment. In Chart 4, we look at workers aged 18 and older who reported working at least 40 weeks in the previous 12 months, regardless of the number of hours worked per week. These full-year workers make up 81 percent of all workers in the Cleveland MSA who were at least 18 years old in 2011. In Chart 5 we further narrow this sample to individuals reporting at least 30 hours of work in a usual week, which allows us to consider their reported wages as full-time wages. The share of full-time, full-year young workers in 2011 is 69 percent of all young workers in the Cleveland MSA.
Chart 5 shows occupations plotted by the share of full-year workers with a post-secondary degree in 2006 and in 2011.1 In this scatter plot, occupations above the line indicate an increase in the share of workers with a post-secondary degree from 2006 to 2011. Those below the line indicate a decrease in the share of workers with a post-secondary degree in that time period. For example, the educational attainment of workers employed in Protective Services increased slightly from 2006 to 2011.
A shift toward higher shares of post-secondary workers within specific occupation categories could be the result of changes in young workers’ perceived value of a college degree, a relative increase in the demand for jobs requiring higher skills, or on-the job-opportunities for improving their skills. On the other hand, such shifts could also be the result of higher-skilled workers moving to lower-skilled jobs as the economy contracted. While our analysis cannot pinpoint the reason for the shifts in the educational attainment of these workers, we do see a general increase in post-secondary degrees among those employed in high-skill occupations (shown in green) and very little change for low-skill occupations (shown in blue). In fact, the share of full-year workers with a post-secondary degree declined in the Healthcare Support occupations, due mainly to the decline in the share of workers with an Associate’s degree.
Chart 5: Shifts in the share of workers in the Cleveland MSA with a post-secondary degree by occupation. Workers aged 18 and older, 2006 and 2011
Source: Public Use Micro Data Sample (PUMS), 1-year estimates
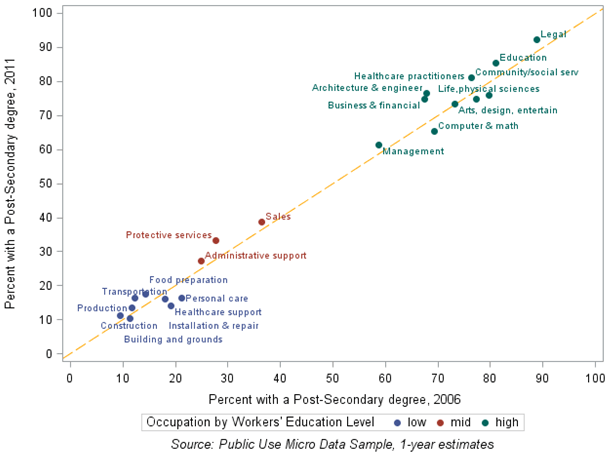
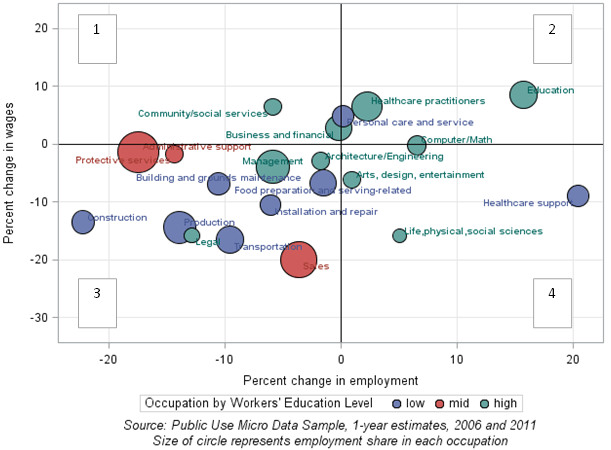
Chart 6, below, shows the change in employment and real average wages of full-time, full-year workers by occupations from 2006 to 2011. Occupations are color coded by the educational level of their full-time, full-year workers. The size of each bubble is proportional to employment shares across occupation in 2011. In other words, the larger the circle, the greater the share of employees working in that occupation. The bubbles’ location on this chart tells us a great deal, too. Administrative support, for example, employed the greatest proportion of workers aged 18 and older in 2011 and experienced a slight decline in wages as well as a more pronounced drop in employment. In fact most mid-skilled (red bubbles) and low-skilled (blue bubbles) occupations experienced a decline in real wages, employment, or both during these slow recovery years, as seen by the concentration of occupations in quadrants 3 and 4 of Chart 6. Only the Personal Care & Services occupation has remained relatively stable in both employment and wages. Healthcare Support increased employment by about 20 percent, but saw a reduction in the average full-time, full-year real wage. However, by 2011, just 5 percent of full-time, full-year workers in the Cleveland MSA held jobs in either field.
Chart 6: Employment and wage growth between 2006 and 2011 in Cleveland MSA, of full-year, full-time workers aged 18 and older
Source: Public Use Micro Data Sample (PUMS), 1-year estimates, 2006 and 2011
Size of the circle represents employment share in each occupation
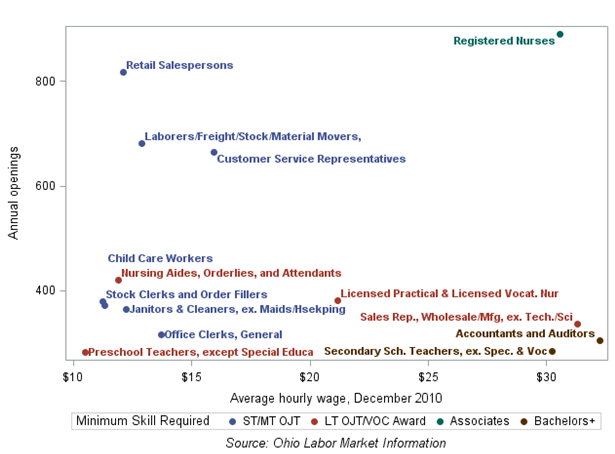
Looking ahead to which fields show the greatest prospects, data from Ohio’s Labor Market Information system shows that registered nurses, who are required to obtain at least an Associate’s degree, top the list of professions with the greatest projected annual openings between 2008 and 2018 in the Cleveland MSA (see Chart 7) and Ohio. Other occupations with a large number of projected openings include retail sales, laborers, and customer service representatives—all jobs that could be filled by non-college-bound individuals, but are relatively low-paying.
Chart 7: Projected annual openings between 2008 and 2018 by wages in Cleveland MSA
Source: Ohio Labor Market Information
Summary
This data brief covers changes in the labor market landscape during the recovery period after the Great Recession. In the Cleveland MSA, we see welcome gains in education at both end of the educational spectrum; the shares of young workers with Bachelor’s degrees has risen and the share of those without a high school degree has dropped. Still, the share of young workers with a Bachelor’s degree in the Cleveland MSA is lower when compared to Cincinnati and Pittsburgh MSAs. Occupations showing growth in both wages and employment from 2006 to 2011 are those that tend to require a college degree. The share of young workers in the higher-paid, higher-skill Education and Healthcare Practitioners jobs has increased over these five years and employment growth is projected to continue in these fields, particularly for Registered Nurses.
However, employment prospects for those without a college degree—a particular focus of this brief—are more concentrated in the lower-wage occupations. We see growing shares of young workers in Food Preparation & Services and declining shares in the relatively higher-paying Construction and Transportation jobs. At the same time, much of the shift from full-time to part-time work among young workers occurred in the lower-skilled Food Preparation and Transportation fields.
Data Notes
The PUMS wage data used in this analysis is based on workers’ self-reported wages in the previous 12 months (52 weeks). Since the data provide a range of weeks worked (i.e. 1-13 weeks) rather than the exact number of weeks worked in the previous year, we are not able to estimate the yearly wage of individuals working less than a year in proportion to the time worked. Thus, we compute average wages only among individuals reporting at least 40 weeks of work and use the wage reported as their yearly wage.
Data Source
The 1% Public Use Micro Data Sample (PUMS) data includes individual-level data on the demographics, education, wages and employment of the population. Data were extracted from IPUMS at https://usa.ipums.org (IPUMS citation: Steven Ruggles, J. Trent Alexander, Katie Genadek, Ronald Goeken, Matthew B. Schroeder, and Matthew Sobek. INTEGRATED PUBLIC USE MICRODATA SERIES: VERSION 5.0 [Machine-readable database]. Minneapolis: University of Minnesota, 2010.) The data on annual openings, minimum skill level and averages wages by occupation was extracted from the Ohio Labor Market Information, found at http://ohiolmi.com/.
Footnotes
- The color-coding of occupations into three groups provides more detail on the educational attainment of their full-year workers in 2011. Occupations with at least half of their workers holding a Bachelor’s or post-graduate degree are classified as high-skilled (green). Occupations for which at least half of their workers do not hold more than a HS degree are classified as low-skilled (blue). The remaining occupations are considered to be mid-skilled as they have less of a concentration of workers at either end of the educational attainment spectrum.