

- Share
Flexible Average Inflation Targeting and Inflation Expectations: A Look at the Reaction by Professional Forecasters
This Commentary examines the response of longer-run inflation expectations to the FOMC’s August 2020 announced switch to a flexible average inflation-targeting (FAIT) regime. The data indicate an upward shift in the lower end (below 2 percent) of the distribution of inflation expectations and a stronger anchoring of expectations around the 2 percent inflation objective following the announcement, evidence that is consistent with intended effects of the change in the monetary policy framework. To provide context, we also include a retrospective assessment of the response of inflation expectations to the FOMC’s January 2012 announcement of an inflation objective. Lessons from the 2012 announcement suggest that conclusions about the adoption of the FAIT regime should be viewed as tentative. Consequently, we also describe indicators and features of the data to monitor developments going forward.

The views authors express in Economic Commentary are theirs and not necessarily those of the Federal Reserve Bank of Cleveland or the Board of Governors of the Federal Reserve System. The series editor is Tasia Hane. This paper and its data are subject to revision; please visit clevelandfed.org for updates.
In August 2020 the Federal Open Market Committee (FOMC) adopted new approaches to its inflation and employment objectives, with the inflation objective involving a shift to a flexible average inflation-targeting (FAIT) regime.1 An FAIT regime is different in that the Committee will seek to achieve its inflation target, which is still 2 percent, on average over time. The change implies that if inflation has been running persistently below the target, the FOMC will likely aim to achieve inflation moderately above the target for some time to return the average to 2 percent.
The August 2020 announcement followed an FOMC review of its monetary policy framework that was motivated by several considerations. One consideration was that, for much of the prior expansion, inflation had remained below the Federal Reserve’s 2 percent target. An important concern with this situation is that persistently lower-than-target inflation outcomes could lower inflation expectations, and these lower inflation expectations could reinforce the low inflation outcomes, thereby making it more difficult for the FOMC to attain its inflation target on a regular basis. In addition, if inflation runs below target during recessions when monetary policy is constrained by the zero lower bound on nominal interest rates but it only rises to the target during expansions, then people will come to expect that inflation over long stretches will end up being below the target on average.2 The implementation of the FAIT regime is thus intended to raise (where appropriate) and better anchor the inflation expectations of households, businesses, and financial markets to facilitate the Federal Reserve’s ability to reach and maintain inflation at 2 percent on average over time.
In this Commentary, we examine the extent to which the shift to an FAIT regime has affected longer-run inflation expectations. For expectations, we focus on 5-year/5-year forward personal consumption expenditures (PCE) price inflation from the US Survey of Professional Forecasters (SPF).3 We compare developments subsequent to the August 2020 announcement of the FAIT regime with the evolution of expectations following the FOMC’s January 2012 adoption of a 2 percent objective for PCE price inflation. The January 2012 announcement is an especially relevant comparison because the FOMC at that time was also intending to influence inflation expectations as part of the strategy to achieve its inflation and employment objectives.
We find that the data indicate an upward shift at the lower end (below 2 percent) of the distribution of inflation expectations following the announced switch to an FAIT regime. In addition, there is a stronger anchoring of inflation expectations around the 2 percent objective. While this evidence suggests the change in the monetary policy framework could be having the effects it intends, we note that conclusions about the adoption of the FAIT regime should be viewed as tentative. Consequently, we also discuss indicators and features of the data to monitor developments going forward.
Inflation Expectations after the 2012 Announcement
The FOMC’s adoption of the Statement on Longer-Run Goals and Monetary Policy Strategy in January 2012 marked an important step to provide greater transparency about the operation of policy. In addition to offering the first-ever comprehensive review of its monetary policy strategy, tools, and communication practices, the 2012 announcement clarified the goal of price stability in terms of a specific inflation measure and associated numerical value. Specifically, the FOMC announced a 2 percent objective for PCE price inflation. It was widely recognized that the ability to achieve the inflation objective would depend on the key determinants of inflation, which included inflation expectations. In particular, the ability to “anchor” PCE price inflation expectations at 2 percent would greatly enhance the FOMC’s ability to meet its inflation objective. Consequently, the 2012 announcement, like the recent 2020 announcement, featured inflation expectations as a prominent element in the narrative
We follow Detmeister, Jorento, Massaro, and Peneva (2015) and examine the effect of the 2012 announcement on survey measures of inflation expectations. For the analysis, our measure of inflation expectations is PCE price inflation at a 5-year/5-year forward horizon, or equivalently forecasts for inflation over the period between 5 and 10 years in the future, from the Survey of Professional Forecasters (SPF) conducted by the Federal Reserve Bank of Philadelphia. The choice of this horizon acts to filter out short- and medium-term movements in inflation that reflect the effects of nonmonetary factors, and thereby helps to isolate the longer-term movements of inflation expectations influenced by monetary policy. We extend the analysis of Detmeister, Jorento, Massaro, and Peneva by considering a longer sample period and provide additional information about forecast revisions. In contrast to their analysis, we do not examine the inflation expectations of households from the University of Michigan survey or expectations of consumer price index (CPI) inflation because these forecasts are not linked to PCE price inflation.4
The SPF is conducted on a quarterly basis, and participants are professional forecasters who are largely employees of research institutions and the financial services industry. The SPF forecast data provide predictions for PCE price inflation at the 5-year/5-year forward horizon starting in 2007:Q1. On average, 33 forecasters have participated per survey round.5 The SPF, like other surveys, has experienced exit and entry of respondents over time, and there are occasional nonresponses by participants to the complete questionnaire. We return to the issue of the unbalanced panel structure in subsequent discussion.
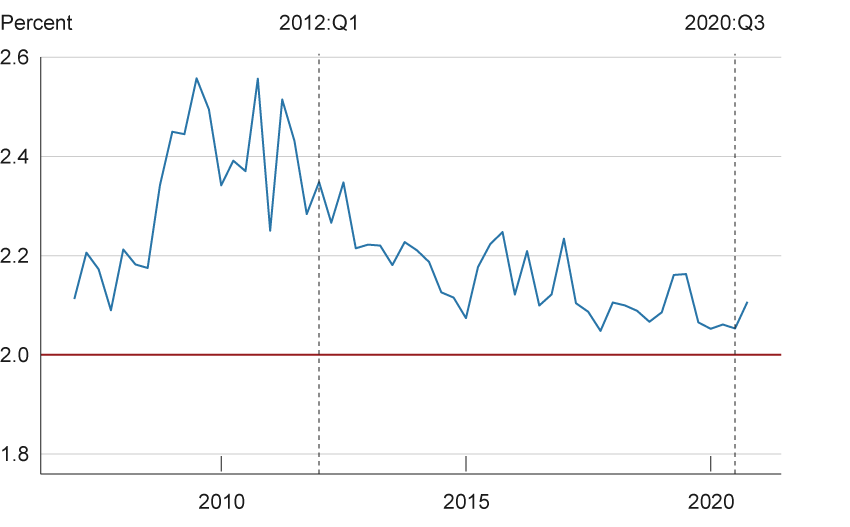
The FOMC’s 2012 announcement was made public on January 25. The 2012:Q1 survey was fielded from January 27 to February 7, implying that news about the new explicit inflation objective was available to respondents for the survey round. Figure 1 plots various percentiles of the distribution of 5-year/5-year forward PCE price inflation expectations from 2007:Q1 to 2020:Q4. The chart shows that inflation expectations were widely dispersed during the time leading up to the announcement. The median long-term inflation forecast consistently exceeded 2 percent.
Figure 1. 5-Year/5-Year Forward PCE Price Inflation by Quartile
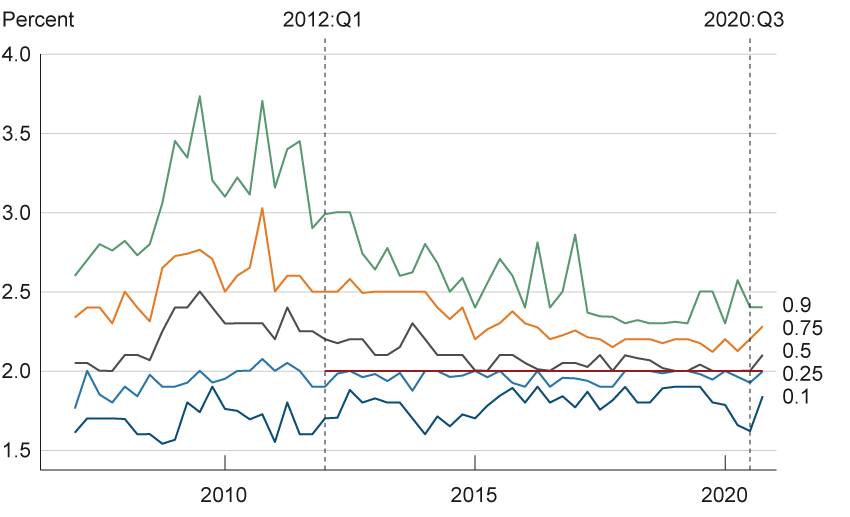
Source: Survey of Professional Forecasters, Federal Reserve Bank of Philadelphia.
A look at the series in the immediate aftermath of the announcement provides mixed evidence about whether expectations across the percentiles moved toward the 2 percent objective or not. Inflation expectations at the10th percentile moved up 10 basis points to 1.7 percent, while inflation expectations at the 50th percentile moved down 5 basis points to 2.2 percent. However, inflation expectations at the 25th and 75th percentiles were unchanged, with inflation expectations at the 90th percentile actually increasing.
Figure 2 examines the data from the perspective of individual forecast revisions. Specifically, we focus on participants who provided forecasts in both the 2011:Q4 and 2012:Q1 survey rounds, with the former denoted by the diamond shapes and the latter by the crosses. We order the forecasts from lowest to highest based on the 2011:Q4 survey round. Given the nature of the announcement, one would expect to observe larger revisions from forecasters located in the tails of the distribution because their inflation expectations are the farthest above or below the 2 percent objective. Looking at the lower end of the distribution generally indicates that participants either did not revise their forecasts or undertook only modest revisions. There are also examples of participants moving noticeably close to (#568) or further away (#518) from the 2 percent objective. Looking at the upper end of the distribution reveals one notable downward revision and two very visible and perhaps surprising upward revisions. For the other participants in this segment of the distribution, their forecasts were essentially unchanged even though they were at least 0.5 percentage point above the 2 percent objective. Taken together, the 2012 announcement appears to have exerted very little initial impact on inflation expectations. Given the relative stability of the percentiles prior to the announcement, there is no evidence to suggest that the lack of response is due to an anticipation of the policy change.
Figure 2. 5-Year/5-Year Forward PCE Price InflationForecasts: 2011:Q4 and 2012:Q1
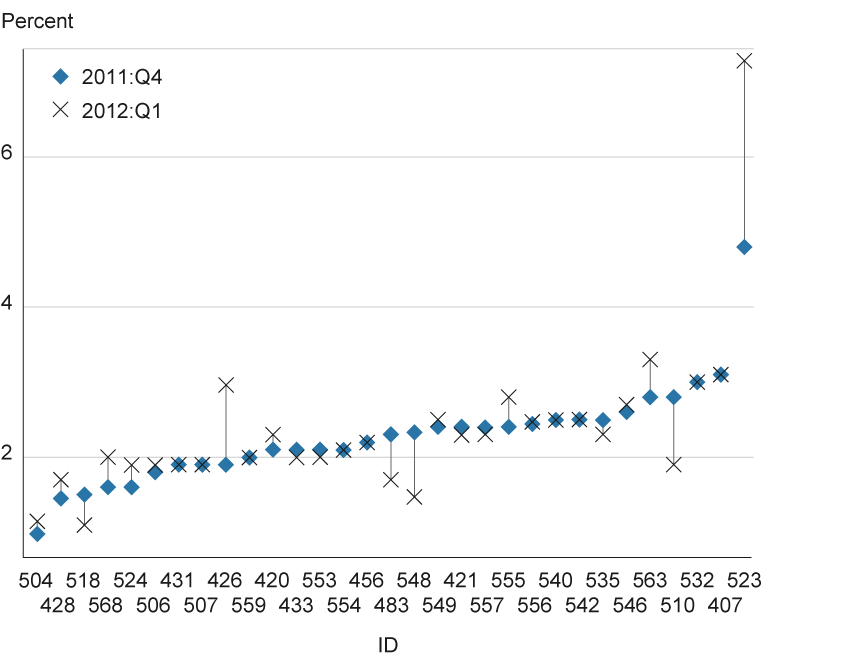
Source: Authors’ calculations using data from the Survey of Professional Forecasters, Federal Reserve Bank of Philadelphia.
Prelude to the 2020 Announcement: The Anchoring of Expectations and Inflation Shortfalls
Looking beyond the 2012:Q1 survey round, one eventually sees evidence of a change in the behavior of this measure of inflation expectations. In particular, there is a stronger anchoring of inflation expectations around the 2 percent inflation objective. To gain a better appreciation of the timing and extent of the anchoring, we adopt the following measure of anchoring that calculates the average absolute distance of the individual forecasts from the 2 percent objective:
(1) ![]()
where ![]() is the reported 5-year/5-year-forward point forecast of PCE price inflation of respondent i, and Nt denotes the total number of respondents in the survey conducted in period t.6
is the reported 5-year/5-year-forward point forecast of PCE price inflation of respondent i, and Nt denotes the total number of respondents in the survey conducted in period t.6
Figure 3 plots our measure of the anchoring of expectations from 2012:Q1 to 2020:Q4, where lower values indicate a greater degree of anchoring. Consistent with the observed wide dispersion of inflation expectations leading up to the 2012 announcement, the metric in (1) indicates the average distance from 2 percent was 55 basis points. The initial decline in the anchoring measure coincides with forecasts in the tails of the distribution moving toward the 2 percent objective shortly after the announcement. Looking a little further out, there is an additional decline in the anchoring measure in 2014 that results from the downward drift in inflation expectations at the 50th, 75th, and 90th percentiles. Figure 3 captures a clear, albeit delayed, improvement in the anchoring of inflation expectations in the two years following the 2012 announcement. The decline in forecast dispersion has also been noted by Detmeister, Jorento, Massaro, and Peneva (2015) who compared the behavior of the forecasts from 2009 to 2011 to those from 2012 to 2014. Beyond 2014, however, anchoring has shown further improvement, with dispersion moving in a narrow range between 15 basis points and 25 basis points since 2018.
Figure 3. Average Absolute Deviation of Forecasts from 2 Percent
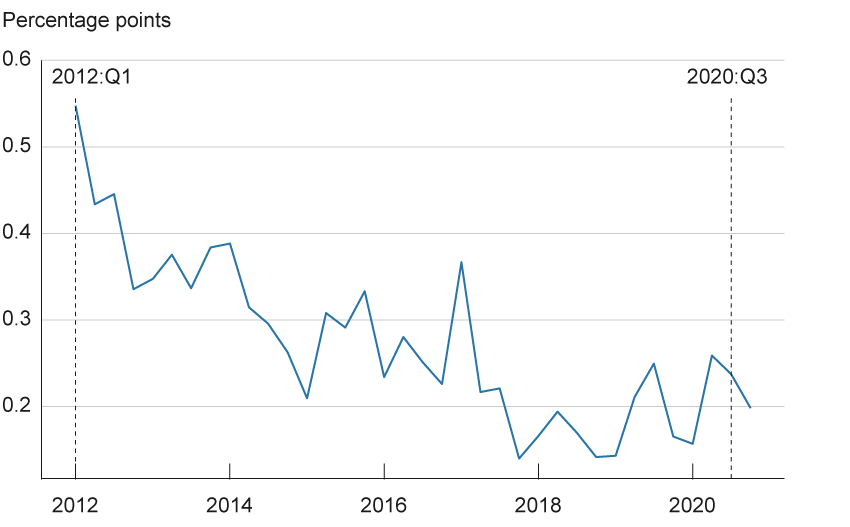
Source: Authors’ calculations using data from the Survey of Professional Forecasters, Federal Reserve Bank of Philadelphia.
While the FOMC was able to achieve a greater alignment of inflation expectations, it has not enjoyed the same success at meeting its inflation objective. Figure 4 plots the four-quarter growth rate of the PCE price index from 2009:Q2 to 2020:Q3. Since the 2012 announcement, PCE price inflation has consistently run below the 2 percent target. Moreover, the shortfalls from the 2 percent objective have been acute at times, such as the marked slowdown over the 2015-2016 period resulting from the combination of a collapse in energy prices and a significant appreciation of the dollar. During that time, PCE price inflation was nearly 2 percentage points away from the objective. Thus, it is worth noting that the previously highlighted improvement in the anchoring of inflation expectations was taking place during an episode that featured a notable and persistent undershooting of inflation relative to the objective.
Figure 4. PCE Price Inflation
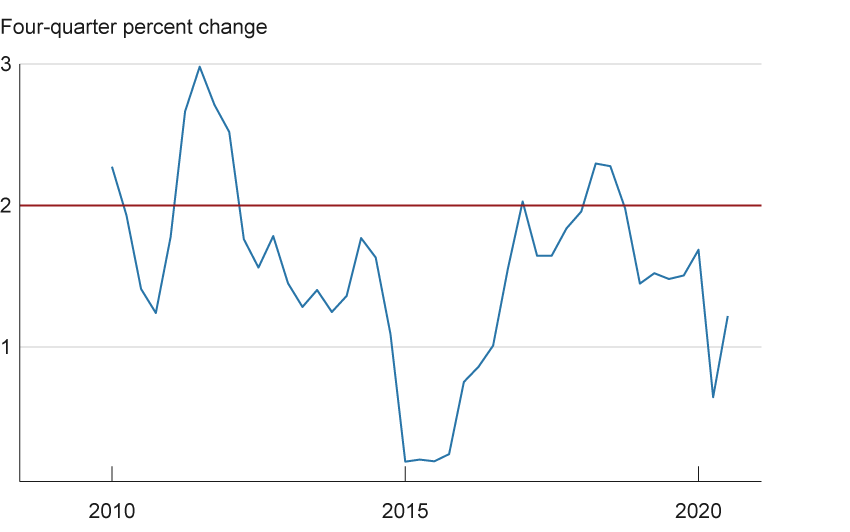
Source: Bureau of Economic Analysis.
Moving ahead, we note several salient features about the recent behavior of inflation and the evolution of inflation expectations. First, after having rebounded in 2017 and spending most of 2018 near the 2 percent objective, inflation more recently has again moved away from 2 percent. Second, the concern remains that persistent shortfalls of inflation from the FOMC’s inflation objective could undo or reverse the improved anchoring of inflation expectations in the post-announcement period. Last, while figure 1 shows little variation in inflation expectations across most percentiles in recent years, it is worth noting the 10th percentile displayed a steady downward drift since the middle of 2019. Against the background of these considerations, the adoption of the FAIT regime should not be viewed solely as a safeguard against a decline in inflation expectations, but additionally as a strategy to potentially guide them above the 2 percent target for a time if inflation is expected to run below 2 percent over the near and medium term.
The 2020 Change in the FOMC’s Monetary Policy Framework
The 2020:Q4 survey was fielded from October 29 to November 10 and was the first survey conducted after the August 27 announcement of the FAIT regime. Consequently, we principally focus on the 2020:Q4 survey to analyze the initial effects of the FAIT regime on our measure of inflation expectations. However, it will also be important to examine surveys that preceded the announcement to determine whether there were important composition effects associated with changes in the panel of participants or anticipatory movements in expectations. If such effects or movements were present, then restricting attention to the 2020:Q4 survey round could give a misleading account of the announcement’s influence on expectations. Moreover, under FAIT, longer-term inflation expectations may now depend on what is expected to happen to inflation over the near- and medium-terms. If inflation in the near term is expected to run below 2 percent, then inflation further in the future would need to run above 2 percent to make up for the earlier misses.
Returning to figure 1, the 2020:Q4 survey indicates that longer-run inflation expectations rose across all percentiles except at the 90th percentile, which did not change. There was a 20 basis point rise at the 10th percentile, while the 25th, 50th, and 75th percentiles rose by approximately 10 basis points. In the case of the 10th and 25th percentiles, the increases reversed a series of previous declines. Moreover, the increases in the individual percentiles were large on a historical basis dating back to the start of the series in 2007:Q1. For example, the increase at the 10th percentile was the third largest for the series, while the increases at the 50th and 75th percentiles were the sixth largest for each series.
Given these changes, it appears that the 2020:Q4 survey round exhibits a noticeable response of longer-run inflation expectations following the adoption of the FAIT regime. However, any judgment about the effect or initial success of the announcement requires consideration of four additional issues.7 The first issue concerns composition effects from the changing panel structure between the 2020:Q3 survey and the 2020:Q4 survey. There were 27 forecasters in 2020:Q3 and 25 forecasters in 2020:Q4, but only 19 common forecasters across the two surveys.
Because the panel is not the same, it is especially important when making comparisons across just two survey rounds to determine whether changes in the reported forecasts are attributable to forecast revisions or to the exit and entry of forecasters. For example, a stronger case can be made for the efficacy of the announcement if the upward shift in the distribution of inflation expectations reflects participants updating their forecasts, rather than participants with relatively higher forecasts in 2020:Q4 replacing participants with relatively lower forecasts in 2020:Q3. The latter case is problematic because there is no basis to judge the influence of the FAIT regime on the forecasts of respondents who did not participate in the survey round preceding the announcement.
We can examine the importance of composition effects for the 2020:Q4 survey in two ways. One way is to examine the change in inflation expectations at various percentiles of the distribution for the 2020:Q3 and 2020:Q4 survey rounds using the full sample and the restricted sample of common forecasters. If the changes are comparable, then composition effects are not an important consideration.
A second way is to use the following decomposition of the change in the mean of the point forecasts that holds under the condition that the number of forecasters leaving the survey equals the number of forecasters joining the survey:
(2) ![]()
where N is the total number of forecasters, NS is the number of forecasters participating in both surveys, ![]() denotes the mean of the point forecasts using the full sample,
denotes the mean of the point forecasts using the full sample, ![]() denotes the mean of the point forecasts using common forecasters, and
denotes the mean of the point forecasts using common forecasters, and ![]() and
and ![]() denote the mean of the point forecasts for the forecasters joining and leaving the survey, respectively.8 The decomposition indicates that the overall change in the mean of the point predictions is a weighted average of the mean changes of the common forecasters and the differential mean forecast between forecasters joining and leaving the survey. The latter terms represents the composition effect. While the number of forecasters joining and leaving the survey is not identical in our situation, they are very close and so (2) should provide a reliable approximation.
denote the mean of the point forecasts for the forecasters joining and leaving the survey, respectively.8 The decomposition indicates that the overall change in the mean of the point predictions is a weighted average of the mean changes of the common forecasters and the differential mean forecast between forecasters joining and leaving the survey. The latter terms represents the composition effect. While the number of forecasters joining and leaving the survey is not identical in our situation, they are very close and so (2) should provide a reliable approximation.
The evidence from both diagnostic checking procedures suggests that composition effects play almost no role in the 2020:Q4 survey results. As shown in table 1, the changes in inflation expectations at various percentiles for the set of common forecasters are comparable to those using the full sample.
| Change in expectation by percentile (basis points) | |||||
|
|
10th | 25th | 50th | 75th | 90th |
| Set of common forecasters | 14 | 3 | 20 | 5 | −4 |
| Set of all forecasters | 22 | 7 | 10 | 8 | 0 |
Source: Authors’ calculations based on data from the Survey of Professional Forecasters, Federal Reserve Bank of Philadelphia.
In addition, an examination of the change in the mean of the 5-year/5-year forward PCE price inflation predictions indicates that it is driven by forecast revisions. Figure 5 plots the mean of the series starting in 2007:Q1. As shown, the mean displayed an ongoing decline toward the 2 percent objective after the 2012 announcement.9 Compared to the 2020:Q3 survey, the mean increased 6 basis points to 2.11 percent in 2020:Q4. However, the mean predictions of the forecasters joining and leaving the survey were nearly identical at 1.97 percent and 1.96 percent, respectively, implying these participants contributed almost nothing to the observed change in the mean.
Figure 5. Mean of 5-year/5-year Forward PCE Price Inflation Forecasts
Source: Authors’ calculations based on data from the Survey of Professional Forecasters, Federal Reserve Bank of Philadelphia.
A second issue concerns features of the forecast revisions. An examination of the data indicates that the average forecast revision was 6 basis points.10 For our purposes, it is also important to consider information at the individual level such as the number and size of the forecast revisions as well as their location in the distribution of inflation expectations. Given the nature of the announcement, we would expect to observe upward revisions from forecasters with low (below 2 percent) inflation expectations. The upward revision could reflect an attenuation of the bias effect in longer-term expectations due to the presence of the effective lower bound on nominal interest rates or the anticipation of a higher and/or more sustained overshoot of 2 percent PCE price inflation in the future.11
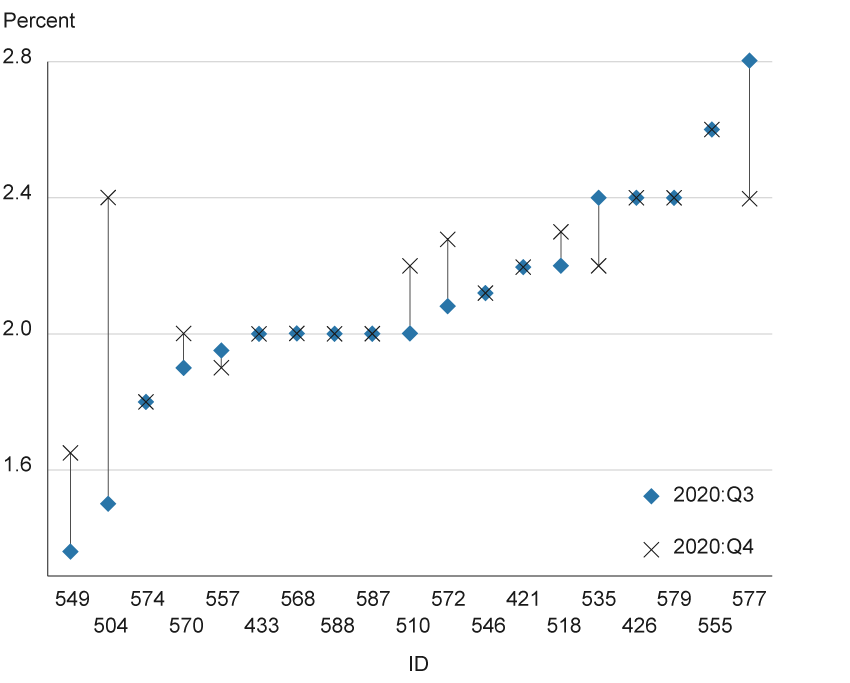
Figure 6 plots the forecasts across the 19 common participants in the 2020:Q3 and 2020:Q4 surveys, with the former denoted by the diamond shapes and the latter by the crosses. We order the forecasts from lowest to highest based on the 2020:Q3 survey round. As shown, three of the five forecasters with inflation expectations below 2 percent in 2020:Q3 displayed upward revisions in 2020:Q4. Moreover, the two largest upward revisions registered in 2020:Q4 were among these forecasters and corresponded to 90 basis points (#504) and 30 basis points (#549). While the other upward revision was modest, it is interesting to note that the participant’s forecast was now aligned at 2 percent. Our examination of the revisions offers additional insights into the nature of the shift in the percentiles depicted in figure 1, especially at the lower end of the distribution.
Figure 6. 5-year/5-year Forward PCE Price Inflation Forecasts: 2020:Q3 and 2020:Q4
Source: Authors’ calculations based on data from the Survey of Professional Forecasters, Federal Reserve Bank of Philadelphia.
As previously discussed, it would be extremely challenging to try to provide an account for all of the observed patterns in figure 6. Nevertheless, a reasonable interpretation of the FAIT regime suggests a third issue that relates to expectations at the 5-year and 5-year/5-year forward horizons. Specifically, if SPF participants are expecting inflation at the 5-year horizon to be less than 2 percent and also expecting that the Federal Reserve will attempt to make up for the shortfall over the subsequent 5-year period, then they should raise their 5-year/5-year forward forecast. Consequently, it is of interest to ask whether SPF participants who revised up their 5-year/5-year forward expectations were also reporting expectations below 2 percent at the 5-year horizon.12 We find general support for this implication as this condition holds in four out of six cases. Looking across the revisions as a whole, there is another important result that emerges. Returning to figure 3, the measure plotted there indicates an improvement in the anchoring of expectations around the 2 percent objective following the 2020 announcement.
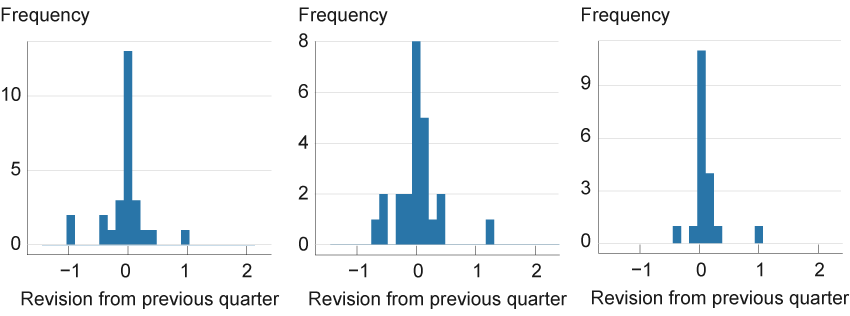
A final issue is whether there were anticipatory movements in inflation expectations preceding the announcement. If such movements took place, then restricting attention to the 2020:Q4 survey round could give the misleading impression that the announcement had no influence, or only a limited influence, on expectations. In particular, figure 6 indicates that 10 forecasters did not revise their forecasts between the 2020:Q3 and 2020:Q4 survey rounds. To address the issue of anticipatory movements, we extend the analysis of forecast revisions to include the revisions in the 2020:Q2 and 2020:Q3 survey rounds.13 While it is difficult to say anything about how anticipations of the announcement would impact forecast revisions quantitatively, from a qualitative standpoint we would expect the distribution of forecast revisions to display a positive mean and few negative revisions if participants believed that the new framework would generally raise inflation over longer horizons.
Figure 7 provides histograms of forecast revisions of participants for 2020:Q2 and 2020:Q3, where we include the 2020:Q4 survey round for comparison purposes. The means of the forecast revisions for the 2020:Q2 and 2020:Q3 survey rounds are −5 basis points and 1 basis point, respectively, which are lower than the 6 basis point increase for the 2020:Q4 survey round. Perhaps more striking are the shapes of the histograms. In contrast to the histogram for the 2020:Q4 round, which largely displays non-negative forecast revisions, the histograms for the previous two survey rounds show a mixture of positive and negative revisions. While caution is required whenever drawing conclusions from data presented in this type of format, we would argue the patterns depicted in figure 7 do not suggest there were anticipatory movements in inflation expectations preceding the announcement.
Figure 7. SPF Participants’ Forecast Revisions for PCE Price Inflation
Source: Authors’ calculations based on data from the Survey of Professional Forecasters, Federal Reserve Bank of Philadelphia.
Conclusion
This Commentary examines the FOMC’s adoption of an FAIT regime in August 2020 and the impact on professional forecasters’ longer-run inflation expectations. The data suggest that, compared to the FOMC’s 2012 announcement of an inflation objective, the FOMC’s 2020 announcement generated more of an immediate effect on inflation expectations. Specifically, there is a noticeable upward shift among low (below 2 percent) inflation expectations and a stronger anchoring of expectations around the 2 percent inflation objective that cannot be attributed to composition effects. When we examine the data along other dimensions, such as the nature of the linkage between forecasts at different horizons, we find evidence that is consistent with intended effects of the change in the monetary policy framework. Moreover, there is little evidence to suggest the impact of the announcement is understated due to anticipatory effects. It is, however, important to draw upon the lessons from the 2012 announcement that indicate the effects of that policy played out over several years rather than only in one quarter. In addition, the forecast revisions are concentrated among a few forecasters. Consequently, it will be important to look to future surveys to inform the analysis of the efficacy of the FAIT regime.
Footnotes
- Powell, Jerome. 2020. “New Economic Challenges and the Fed’s Monetary Policy Review.” Speech at the Jackson Hole Symposium on August 27, 2020. https://www.federalreserve.gov/newsevents/speech/powell20200827a.htm. Return to 1
- We will use the term “bias in inflation expectations” to describe this situation. Return to 2
- Coibion, Gorodnichenko, Knotek, and Schoenle (2020) examine households’ expectations for inflation and other variables around the announcement of the FAIT regime. Return to 3
- The Michigan survey asks households to report expectations about the movements in “prices in general.” Return to 4
- The SPF does not directly ask for these forecasts but instead calculates them as an implied projection based on reported forecasts of PCE price inflation at 5-year and 10-year horizons. We thank Tom Stark of the Federal Reserve Bank of Philadelphia for his assistance with details about the construction of the series. Return to 5
- Note that our measure of anchoring symmetrically treats deviations of inflation expectations above and below 2 percent. Return to 6
- While we do not comment on them, we acknowledge that other factors could have affected expectations besides monetary policy, such as changing views on the long-term impacts of the pandemic between the third and fourth quarters. Return to 7
- The derivation of (2) is provided in the appendix. Return to 8
- The mean is above the median value during this period due to the positive skewness of the distribution of inflation expectations. Return to 9
- As shown in (2), the average forecast revision and the change in the mean forecast will be equal when there are no composition effects. Return to 10
- See footnote 2 for discussion of the bias effect. Return to 11
- The degree of any spillover between the 5-year and the 5-year/5-year forward inflation expectations will depend in part on the specifics of the implementation of the FAIT regime. Return to 12
- While we could go further back, we believe that examining these two survey rounds is sufficient for our purposes. Return to 13
References
- Coibion, Olivier, Yuriy Gorodnichenko, Edward S. Knotek II, and Raphael Schoenle. 2020. “Average Inflation Targeting and Household Expectations.” Federal Reserve Bank of Cleveland, Working Paper No. 20-26. https://doi.org/10.26509/frbc-wp-202026.
- Detmeister, Alan K., Daeus Jorento, Emily Massaro, and Ekaterina V. Peneva. 2015. “Did the Fed’s Announcement of an Inflation Objective Influence Expectations?” Board of Governors of the Federal Reserve System. FEDS Notes (June 8). https://doi.org/10.17016/2380-7172.1550.
Suggested Citation
Naggert, Kristoph, Robert W. Rich, and Joseph Tracy. 2021. “Flexible Average Inflation Targeting and Inflation Expectations: A Look at the Reaction by Professional Forecasters .” Federal Reserve Bank of Cleveland, Economic Commentary 2021-09. https://doi.org/10.26509/frbc-ec-202109
This work by Federal Reserve Bank of Cleveland is licensed under Creative Commons Attribution-NonCommercial 4.0 International

