

- Share
Can Yield Curve Inversions Be Predicted?
An inverted Treasury yield curve—a yield curve where short-term Treasury interest rates are higher than long-term Treasury interest rates—is a good predictor of recessions. Because of this, economists and policymakers often assess the risk of a yield curve inversion when the yield curve is flattening. I study the forecastability of yield curve inversions. Professional forecasters did not predict the beginning of the yield curve inversions prior to the 1990–1991, 2001, and 2008–2009 recessions. In all three cases, professional forecasters failed to predict the magnitude of the rise in short-term interest rates. Prior to the 2008–2009 recession, forecasters also overpredicted long-term interest rates.

The views authors express in Economic Commentary are theirs and not necessarily those of the Federal Reserve Bank of Cleveland or the Board of Governors of the Federal Reserve System. The series editor is Tasia Hane. This paper and its data are subject to revision; please visit clevelandfed.org for updates.
The Treasury yield curve, the curve showing interest rates on Treasury securities at different maturity horizons, contains important information about the US economy. In particular, an inverted yield curve, where interest rates on short-term Treasury securities are higher than interest rates on long-term Treasury securities, is a good predictor of recessions.1 While there are reasons to believe that the relationship between the yield curve and recessions has changed,2 Bauer and Mertens (2018) show that an inverted yield curve has preceded each of the previous nine recessions in the United States. Further, they show that an inverted yield curve has been consistently followed by an economic slowdown.3
Given the recent flattening of the Treasury yield curve, it is natural for economists and policymakers to be concerned about the potential for an upcoming inversion and a corresponding economic slowdown. Indeed, at the June 12–13, 2018, Federal Open Market Committee meeting, a number of participants thought monitoring the slope of the yield curve was important given that an inverted yield curve has historically indicated an increased risk of recession. However, in order to have the option of adjusting interest rates before the yield curve inverts, policymakers would need to be able to predict when an inversion is likely.
In this Commentary, I study whether professional forecasters predict yield curve inversions. To do this, I use the consensus or average forecasts of the interest rate on 10-year Treasury securities and the interest rate on 1-year Treasury securities from the Blue Chip Financial Forecasts. These data cover 1988 to the present, and I find that forecasters failed to forecast the beginning of the yield curve inversions that preceded the 1990–1991, 2001, and 2008–2009 recessions. Further, they forecasted yield curve inversions only once the yield curve inversion had occurred.4
I find that a common cause of the failure to predict yield curve inversions is a failure to predict the magnitude of the rise in the 1-year Treasury rates. However, these short-term rate forecast errors have shrunk with each inversion episode, a situation that is consistent with the Federal Reserve’s increased transparency. In addition, professional forecasters overpredicted 10-year Treasury rates prior to the 2008–2009 recession.
The Yield Curve and Recent Inversions
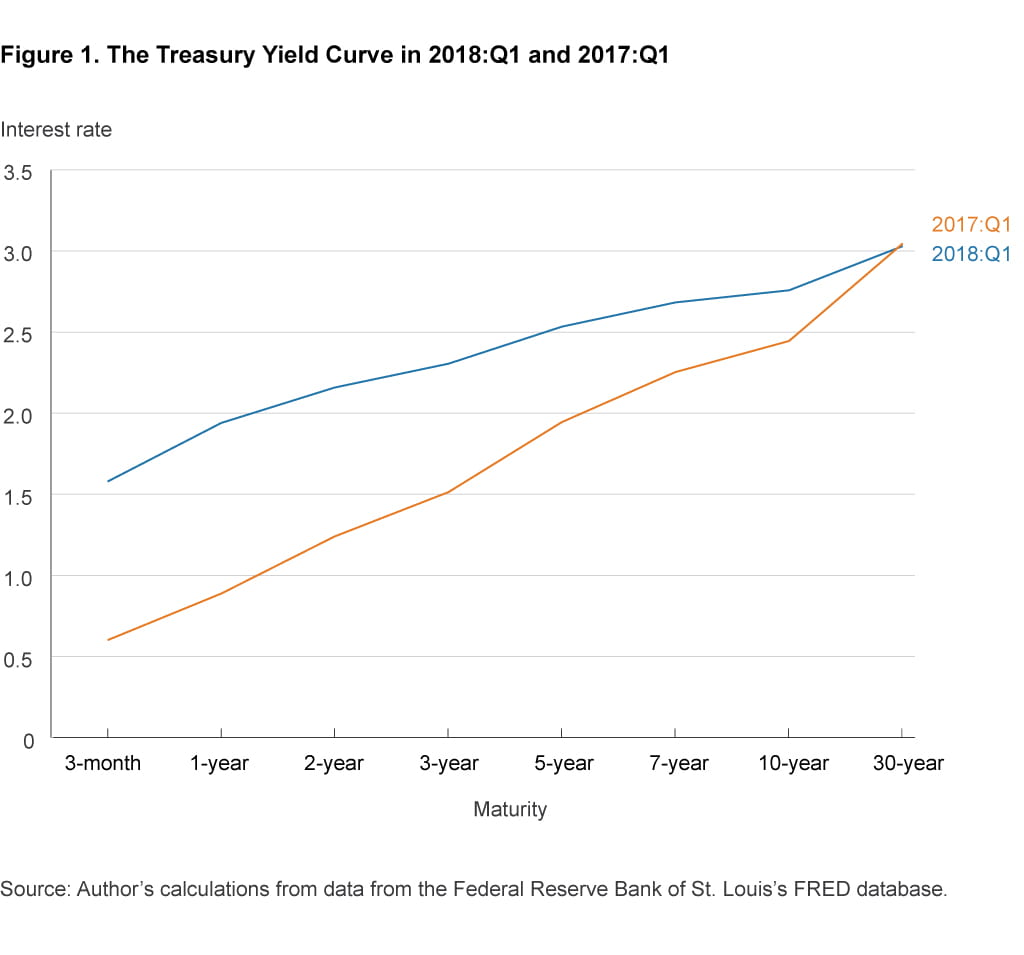
Yield curves contain a collection of data points, each of which is an interest rate for a given Treasury maturity and any of which can vary over time. Figure 1 shows the Treasury yield curve for 2018:Q1 and 2017:Q1. Each data point is the quarterly average of daily constant maturity interest rates for a given maturity.5 A comparison of the two yield curves shows that the yield curve has flattened over the past year, driven by increases in short-term Treasury interest rates.
To simplify the analysis in this Commentary, I do not study the interest rate for every maturity displayed in figure 1. Rather, following Bullard (2017) and Bauer and Mertens (2018), I study the term spread as measured by the difference between the 10-year Treasury rate and the 1-year Treasury rate. A negative value of this term spread indicates an inverted yield curve because the shorter 1-year Treasury interest rate is above the longer 10-year Treasury interest rate. Figure 2 shows this term spread from 1987 to 2018 along with recession periods, indicated by shaded bars. As with figure 1, the data are quarterly averages of daily constant maturity interest rates. This figure shows that yield curve inversions preceded each of the three previous recessions. Further, it shows that the yield curve has flattened, albeit not smoothly, throughout the course of the current expansion as it has in previous expansions.
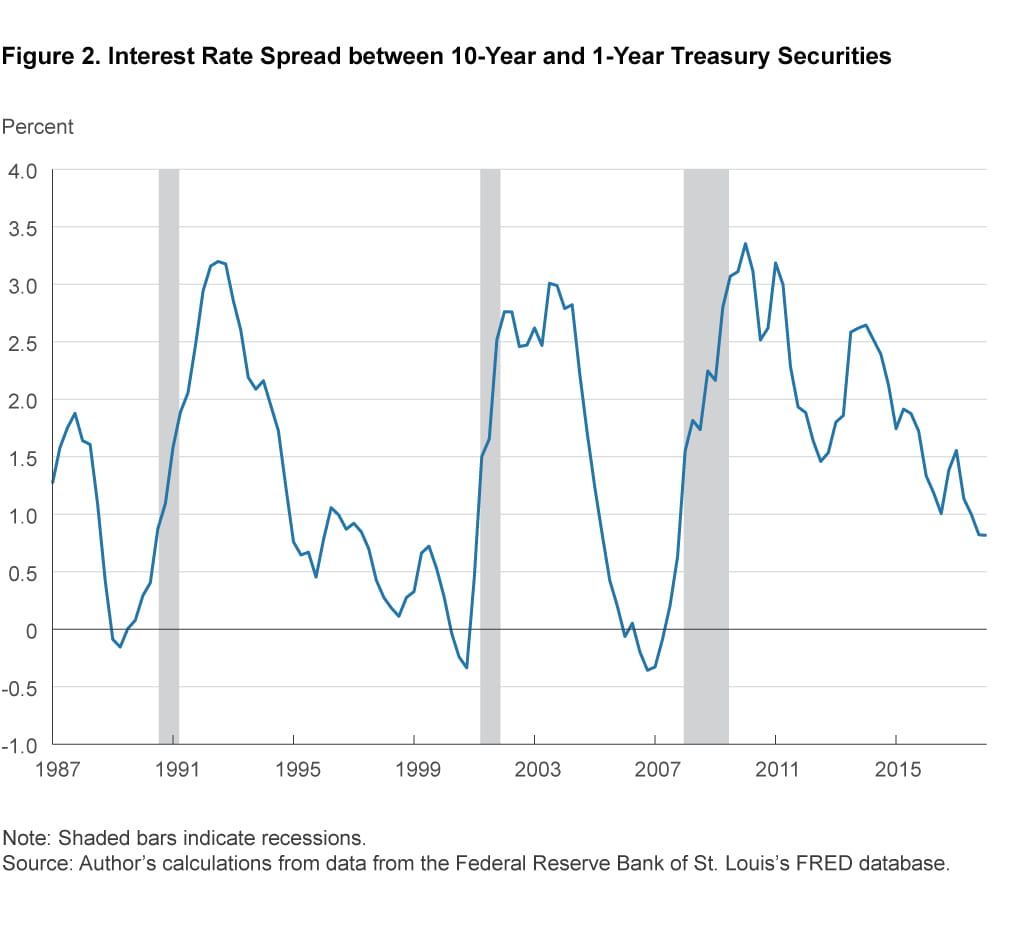
The yield curve inversions studied in this Commentary are the three shown in figure 2. Their timing, taken from the figure, is as follows. The first inversion was 1989:Q1 to 1989:Q2, the second was 2000:Q2 to 2000:Q4, and the third came in two pieces: 2006:Q1 and 2006:Q3 to 2007:Q2.
The Professional Forecasts
The question I investigate is whether professional forecasters predicted the three yield curve inversions shown in figure 2. To answer this question, I use the Blue Chip Financial Forecasts, which have forecasts for the 1-year and 10-year constant maturity Treasury interest rates going back to 1988. I use the consensus forecast for each maturity, the consensus forecast being the average of the individual Blue Chip forecasts. The forecasts are of average interest rates over a quarter, and these forecasts are produced monthly. To give the forecasters the most available information when making their forecasts, I use the forecasts produced in the last month of each quarter: March, June, September, and December.
Figure 3 shows the Treasury term spread along with two forecasts. In both panels, the blue line is the actual term spread in a given quarter. In the top panel, the orange line shows the predicted value of the quarter’s term spread made two quarters prior. In the bottom panel, the orange line shows the predicted value of the quarter’s term spread made four quarters prior. Shaded bars in both panels indicate a yield curve inversion.
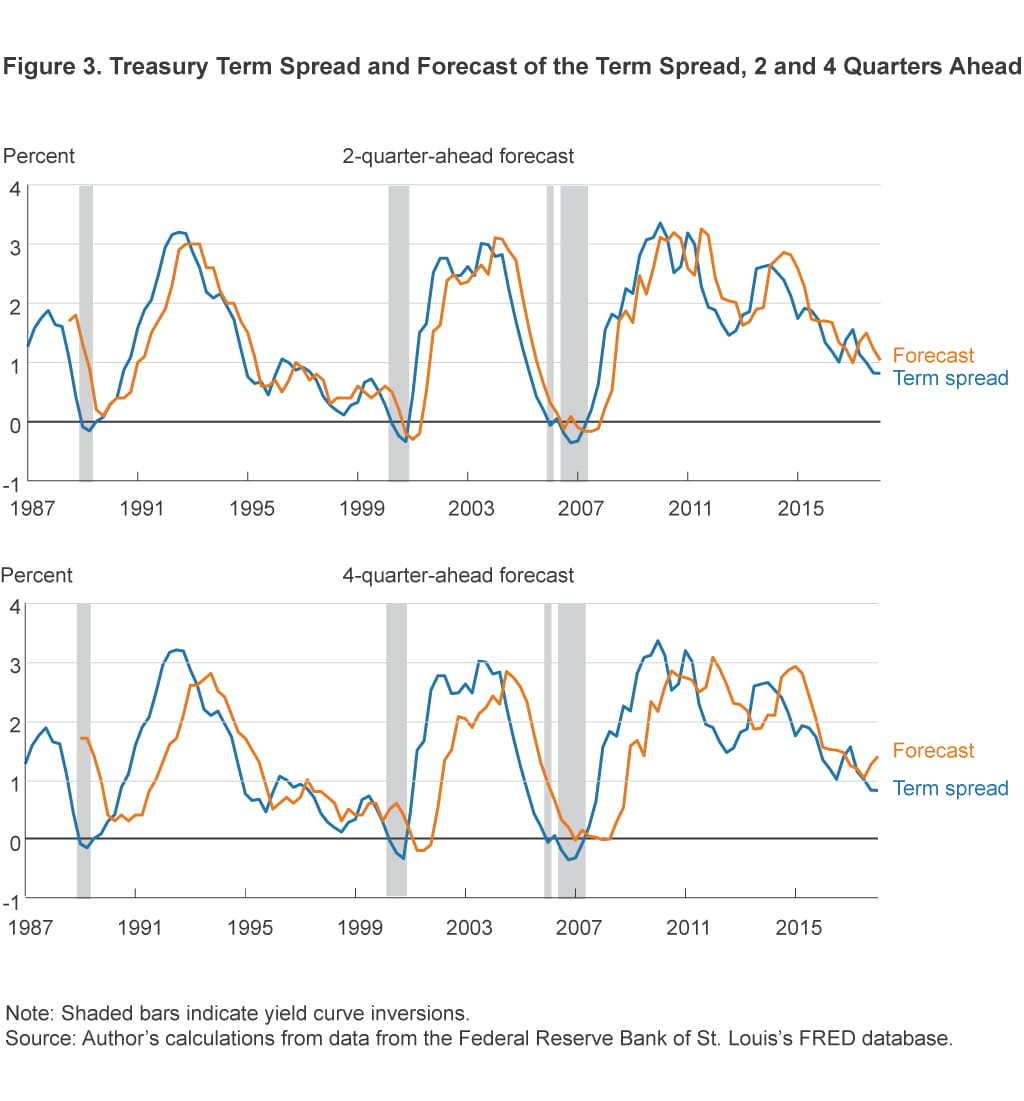
Because the predicted values of the term spreads, the orange lines, are positive both during and after the 1989:Q1 to 1989:Q2 yield curve inversion, figure 3 indicates that professional forecasters failed to predict the 1989:Q1 to 1989:Q2 yield curve inversion at both a 2-quarter-ahead and 4-quarter-ahead horizons.
In contrast, around the 2000:Q2 to 2000:Q4 inversion, the predicted values of the terms spreads are negative for three quarters, 2000:Q4, 2001:Q1, and 2001:Q2, when making 2-quarter-ahead forecasts. That is, forecasters predicted yield curve inversions for these quarters. They also predicted inversions for 2001:Q2, 2001:Q3, and 2001:Q4 when making 4-quarter-ahead forecasts. Essentially, once the yield curve had inverted, professional forecasters continued to forecast an inversion for subsequent quarters. However, they were not able to forecast the beginning of the yield curve inversion.
The results are very similar around the 2006:Q1 and the 2006:Q3 to 2007:Q2 inversions. The forecasters predicted inversions for 2006:Q3 and 2007:Q1 to 2007:Q4 when making 2-quarter-ahead forecasts, and they predicted inversions for 2007:Q1, 2008:Q1, and 2008:Q2 when making 4-quarter-ahead forecasts. As with the previous inversion, the forecasters were not able to forecast the beginning of the yield curve inversion in 2006:Q1.6
One important note is that the forecast errors shrank for each successive inversion. In 1989:Q1 and 1989:Q2, the average absolute forecast errors of the 2-quarter-ahead and 4-quarter-ahead term spread forecasts were 1.22 percent and 1.70 percent, respectively. For the 2000:Q2 to 2000:Q4 inversion, the 2-quarter-ahead and 4-quarter-ahead absolute average forecast errors were 0.37 percent and 0.50 percent, respectively. Lastly, for the 2006:Q1 and the 2006:Q3 to 2007:Q2 inversions, the 2-quarter-ahead and 4-quarter-ahead absolute average forecast errors were 0.24 percent and 0.32 percent, respectively. I discuss these improving forecasts further in the next section.
These findings show that professional forecasters have not forecasted a yield curve inversion unless an inversion has already taken place. This result is similar to how recessions are only identified with lag.7 It also shows that professional forecasters have not made any false alarms about a yield curve inversion.
What Do Professional Forecasters Get Wrong?
To see why professional forecasters missed the onset of all three yield curve inversions, I examined their forecasts of 1-year and 10-year Treasury interest rates separately. Figure 4 shows the 1-year and 10-year Treasury interest rates during each yield curve inversion episode along with the corresponding professional forecasts. Shaded bars indicate yield curve inversions. The left panels of figure 4 show the 1-year interest rates and forecasts. In all three yield curve inversions, professional forecasters failed to forecast the magnitude of the rise in 1-year Treasury rates.8 Hence, an unpredictably rapid rise in the short end of the yield curve is a common cause in failing to predict yield curve inversions.
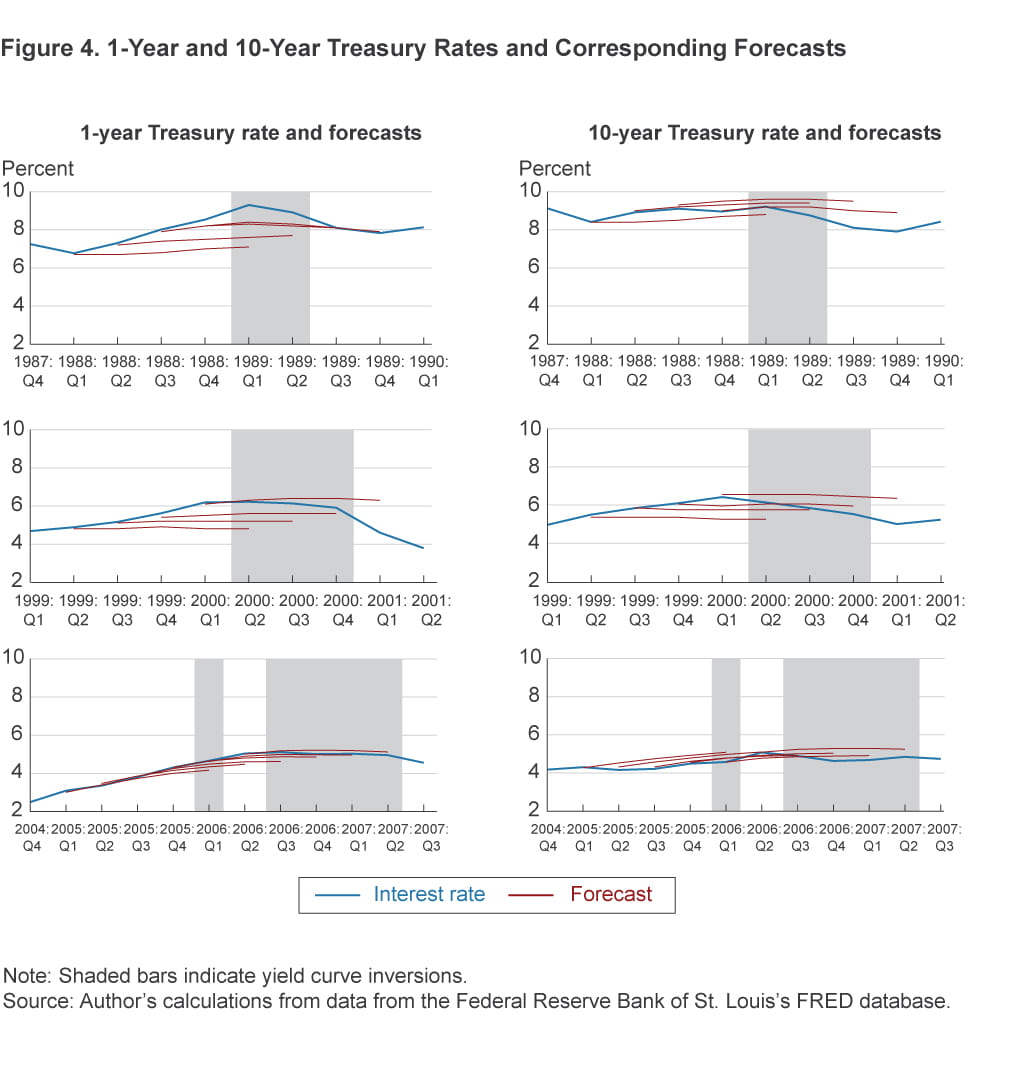
While professional forecasters failed to predict these increases in 1-year Treasury rates, the magnitude of their forecast errors decreased with each successive inversion. At a 4-quarter-ahead horizon, professional forecasters missed the 1989:Q1 and 1989:Q2 1-year rates by an average of 1.7 percent. At this same horizon, they missed the 2000:Q2, 2000:Q3, and 2000:Q4 1-year rates by an average of 0.9 percent. Finally, they missed the 2006:Q1 and 2006:Q3 to 2007:Q2 1-year rates by an average of 0.3 percent. These improvements in forecasting the short-end of the yield curve are consistent with the findings of Swanson (2006), who argues that increases in Federal Reserve transparency have made forecasters better able to predict the federal funds rate and less surprised by Federal Reserve announcements.
The right panels of figure 4 show the 10-year interest rates and forecasts. For the 1989:Q1 to 1989:Q2 inversions, forecasters generally did a good job predicting the 10-year rate for 1989:Q1; however, they failed to forecast the drop in 10-year rates that occurred in 1989:Q2. Similarly, for the 2000:Q2 to 2000:Q4 inversion, forecasters modestly underpredicted 10-year rates for 2000:Q2, generally did a good job predicting 10-year rates for 2000:Q3, and then overpredicted 10-year rates for 2000:Q4.
In contrast to the two earlier inversions, professional forecasters generally predicted upward paths of 10-year Treasury rates in 2005 and 2006. This caused them to systematically overpredict 10-year rates for 2006:Q1 and for 2006:Q3 to 2007:Q2.
Relative to 1-year Treasury rates, the forecast improvements for 10-year Treasury rates across the three inversions were modest. At a 4-quarter-ahead horizon, professional forecasters missed the 1989:Q1 and 1989:Q2 1-year rates by an average of 0.5 percent. At this same horizon, they also missed the 2000:Q2, 2000:Q3, and 2000:Q4 1-year rates by an average of 0.5 percent. Finally, they missed the 2006:Q1 and 2006:Q3 to 2007:Q2 1-year rates by an average of 0.3 percent. These results suggest that the decreasing term spread forecast errors during yield curve inversions are largely driven by improvements in forecasts of the short end of the yield curve.
Summary
With the recent flattening of the yield curve, economists and policymakers are currently discussing the likelihood of a yield curve inversion. In this Commentary, I study the historical forecastability of yield curve inversions. I find that professional forecasters failed to predict the beginning of the yield curve inversions prior to the 1990–1991, 2001, and 2008–2009 recessions. These failures were largely driven by failures to predict the magnitude of the rise in short-term interest rates. In addition, forecasters overpredicted long-term interest rates prior to the 2008–2009 recession. While Federal Reserve transparency has likely helped reduce professional forecasters’ errors for the short end of the yield curve, forecast errors for the long end of the yield curve have had little reduction.
Footnotes
- The Federal Reserve Banks of Cleveland and New York provide recession probabilities based on the yield curve. See: clevelandfed.org/indicators-and-data/yield-curve-and-predicted-gdp-growth for the Cleveland Fed probabilities and newyorkfed.org/research/capital_markets/ycfaq for the New York Fed probabilities. Return
- In the press conference following the December 12–13, 2017, Federal Open Market Committee meeting, former Chair Janet Yellen noted that a low term premium is one factor that could cause this change. Return
- Wheelock and Wohar (2009) survey the academic literature and find that the difference between long-term and short-term interest rates is also useful for forecasting recessions across many countries and with several different statistical models. Return
- Documenting this failure to predict yield curve inversions is not intended to question the abilities of professional forecasters. Indeed, Diebold and Li’s (2006) model, a standard yield curve forecasting model, also fails to predict the beginning of yield curve inversions and only forecasts inversions after an inversion has happened. See the online appendix for details. Return
- These data are from the Federal Reserve Bank of St. Louis’s FRED database: fred.stlouisfed.org/.Return
- Note that this failure to predict the beginning of yield curve inversions is a failure on the part of forecast averages. However, it is also rarely the case that individual forecasters predict inversions. No individual forecaster predicted a negative term spread at a 4-quarter horizon for 1989:Q1, 2000:Q2, or 2006:Q1. At a 2-quarter horizon, no individual forecaster predicted a negative term spread for 1989:Q1 or 2000:Q2. At a 2-quarter horizon, 3 of 46 forecasters predicted a negative term spread for 2006:Q1.Return
- See Hamilton (2011) for a discussion about identifying recessions in real time.Return
- The Survey of Professional Forecasters has similar forecast errors. See figure A.10 in the supplemental appendix of Clark, McCracken, and Mertens (2018). The Diebold and Li (2006) model also fails to predict the rise in 1-year rates. See the online appendix for details.Return
References
- Bauer, Michael D., and Thomas M. Mertens. 2018. “Economic Forecasts with the Yield Curve,” Federal Reserve Bank of San Francisco, Economic Letter, 2018-07.
- Bullard, James. 2017. “Assessing the Risk of Yield Curve Inversion,” Regional Economic Briefing, Little Rock, Arkansas, December 1.
- Clark, Todd E., Michael W. McCracken, and Elmar Mertens. 2018. “Modeling Time-Varying Uncertainty of Multiple-Horizon Forecast Errors,” Federal Reserve Bank of Cleveland Working Paper no. 17-15R.
- Diebold, Francis X., and Canlin Li. 2006. “Forecasting the Term Structure of Government Bond Yields,” Journal of Econometrics, 130: 337–364.
- Hamilton, James D. 2011. “Calling Recessions in Real Time,” International Journal of Forecasting, 27(4): 1006–1026.
- Swanson, Eric T. 2006. “Have Increases in Federal Reserve Transparency Improved Private Sector Interest Rate Forecasts?” Journal of Money, Credit and Banking, 38(3): 791–819.
- Wheelock, David C. and Mark E. Wohar. 2009. “Can the Term Spread Predict Output Growth and Recessions? A Survey of the Literature,” Federal Reserve Bank of St. Louis, Review, 91(5, Part 1): 419–440.
Suggested Citation
Lunsford, Kurt G. 2018. “Can Yield Curve Inversions Be Predicted?” Federal Reserve Bank of Cleveland, Economic Commentary 2018-06. https://doi.org/10.26509/frbc-ec-201806
This work by Federal Reserve Bank of Cleveland is licensed under Creative Commons Attribution-NonCommercial 4.0 International

