- Share

What Causes Inflation?
Inflation is the sustained rise in the general level of the prices of goods and services in an economy over time. It is an important consideration in many economic decisions. But what causes it?
What are the causes of inflation?
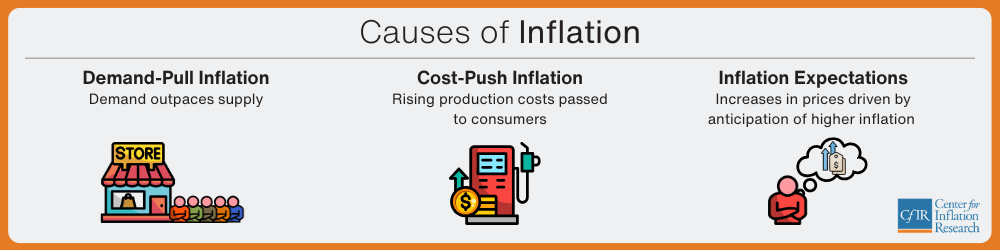
Inflation is linked to three factors: demand, supply, and inflation expectations. There can be positive or negative developments in these factors, but generally one or more of these factors is at work when inflation increases or decreases. When these factors are not putting upward or downward pressure on inflation, inflation is equal to its underlying level, which usually measures about 2 percent.
Inflation can increase when growing demand outstrips changes in the supply of goods and services. Economists call this “demand-pull inflation.”
Another source of higher inflation, known as “cost-push inflation,” occurs when the cost of producing these goods and services rises notably or when they can’t be produced in sufficient quantities to meet demand.
Inflation also depends on people’s expectations about where it will be in the future. These expectations influence economic decisions, and this, in turn, affects inflation.
To make this discussion clearer, we illustrate the causes of inflation by using examples that focus on a change in the price level. However, it is important to remember that inflation involves ongoing increases in the price level.
What is demand-pull inflation?
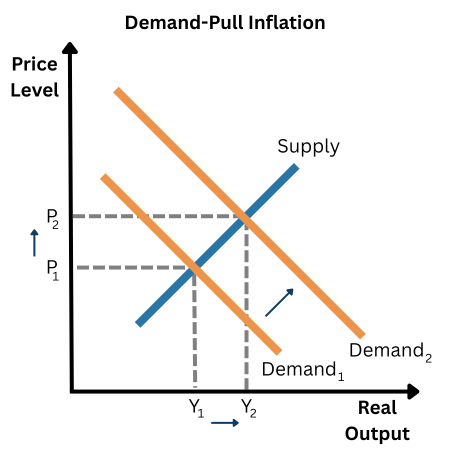
Inflationary pressures can arise from events affecting demand conditions in an economy. This is referred to as demand-pull inflation and occurs when the increased demand by consumers, firms, and the government for goods and services outpaces their supply and leads producers to raise prices for those items. As shown in the Demand-Pull Inflation graphic, these conditions (also referred to as “positive” demand shocks) cause a rightward shift in the aggregate demand curve, resulting in higher price levels and higher economic output.
This kind of inflationary demand can occur in a range of scenarios. One simple example is when a famous singer with a hot new album announces a tour, but with only a few concert dates. Millions want tickets. Because demand far outstrips the number of tickets on offer and because the number of tickets is limited to the number of seats in the venue, prices increase. When this happens across a range of goods and services in the economy, the result is demand-pull inflation.
Other potential sources of demand-pull inflation are rising incomes or lower borrowing costs. With bigger paychecks, people may be willing to spend more on goods or services. Lower borrowing costs have a similar impact. They make financing large purchases such as houses, appliances, and cars less expensive for borrowers and make businesses and households more willing to take out loans for these and similar items. Either of these conditions—rising incomes or lower borrowing costs—can create greater demand for goods or services, and this increased demand pushes up prices and increases inflation.
The role of monetary policy
Monetary policy—which includes actions a central bank such as the Federal Reserve takes to influence interest rates—is an important tool for stimulating or slowing the overall demand for goods and services in an economy. The Federal Reserve affects interest rates by setting the federal funds rate, the rate of interest banks charge for excess reserves they lend each other.
Changes in the federal funds rate are reflected in the prime rate that banks charge their most creditworthy customers and is a benchmark that lenders use for other loans such as mortgages, credit cards, and car loans. So, for example, if the Fed is worried that inflation is moving too high, it can increase the federal funds rate with the expectation that this increase will be transmitted across different lending rates and make it more expensive to borrow. More expensive borrowing should lead to a reduction in the demand for goods and services in the economy.
Conversely, if the Fed sees a need to stimulate the demand for goods and services in the economy, it can lower the federal funds rate, making it less expensive to borrow. Consumers will borrow more to buy houses and durable goods, and firms will borrow more to invest in space and equipment.
What is cost-push inflation?
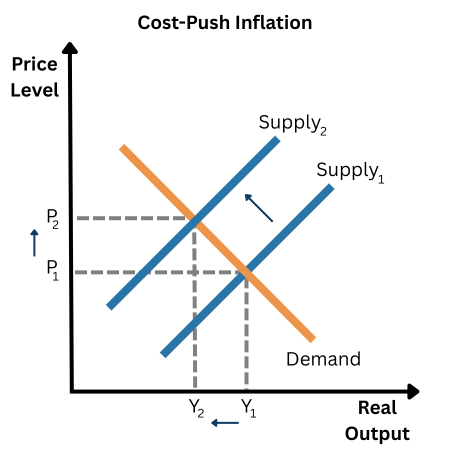
Inflationary pressures can also arise from adverse events affecting supply conditions in an economy. This is referred to as cost-push inflation, and it occurs when there are sharp increases in the overall costs of production of goods or services that lead producers to raise prices for those items. As shown in the Cost-Push Inflation graphic, these types of adverse events (also referred to as “negative” supply shocks) cause a leftward shift in the aggregate supply curve, resulting in higher prices and lower economic output.
There are a variety of factors that can raise production costs. For example, geopolitical conflicts and embargos can lead to higher prices for energy or raw materials. Severe weather and widespread droughts can reduce the supply of agricultural items. Wage increases that are not offset by improved productivity can result in higher per-unit labor costs in the production of goods or supply of services. Natural disasters, pandemics and health crises, and supply chain disruptions can increase input costs or disrupt production and thereby generate widespread and persistent shortages of items.
If the types of supply shocks described above are large enough, they can help create stagflation, which is the combination of economic stagnation—higher unemployment and slowing economic growth—and rising inflation. While stagflation is a rare occurrence, with the US last experiencing a severe stagflation episode from roughly 1973 to 1982, there were also stagflation concerns following the COVID-19 pandemic and in 2025 because of geopolitical and trade developments.
Stagflation presents a challenge to policymakers because it is difficult to address with the usual policy tools. Raising interest rates to curb inflation may further suppress growth and increase unemployment, while cutting interest rates to stimulate growth and lower unemployment risks may move inflation higher. As described in this document on longer-run goals and monetary policy from the Board of Governors, the Federal Reserve pays close attention to economic data and carefully weighs risks to the outlook for inflation and employment when setting interest rates to promote its two goals, maximum employment and price stability, often referred to as the dual mandate.
What are inflation expectations, and how do they impact inflation?
Inflation can also be affected by what people expect it to be in the future because people make decisions based in part on these beliefs. If consumers expect higher inflation in the future, then they may make purchases of items such as a car or an appliance sooner to avoid paying higher prices later. Similarly, a business may choose to raise prices in anticipation of higher future inflation to cover expected increases in their input costs or in the demand for their goods or services. Collectively, these actions can influence actual inflation and demonstrate an important self-fulfilling element associated with inflation expectations: the inflation that people expect can result in actions that help determine the inflation they get.
What’s a wage-price spiral?
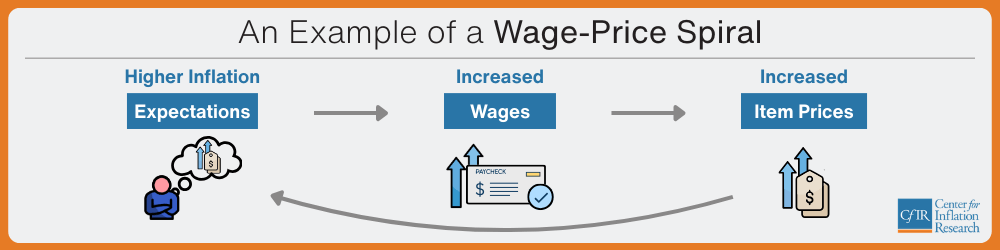
Inflation expectations can also have an important influence on decisions and outcomes in the labor market. If workers expect higher inflation, they may seek higher wages to offset an expected loss in their purchasing power. In response, firms may raise the prices of their goods or services further to cover their increased labor costs. Workers, in turn, may seek still higher wage increases. If workers and firms continue to expect higher inflation, then their wage- and price-setting behavior can lead to a self-reinforcing, circular feedback loop. This self-sustaining cycle is called a “wage-price spiral.” It can be hard to break, but fortunately it doesn’t occur often.
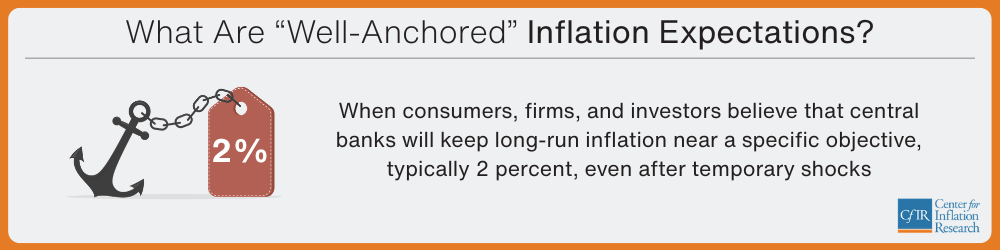
The importance of maintaining well-anchored inflation expectations
One way a central bank can help prevent a wage-price spiral is by establishing a credible low-inflation objective. In the US, the Fed announced a 2 percent inflation goal in 2012. If people expect the Fed to achieve the inflation goal over the long run, then their inflation expectations are said to be well-anchored. Under these conditions, workers and firms are less likely to respond to a short-term increase in inflation by asking for higher wages or by raising prices because they are confident that the Fed will work toward bringing inflation back to the 2 percent objective. This credibility of the inflation objective reduces the likelihood of the onset of a wage-price spiral.
The Fed works hard to ensure that inflation expectations remain well-anchored through its policy actions and communications. It is widely accepted that inflation expectations became unanchored during the 1970s and that it is much more difficult and costly to lower inflation once households and firms believe that inflation will remain elevated. Consequently, well-anchored inflation expectations help monetary policy by reducing the probability that temporary shocks result in persistent, high inflation, thus allowing central banks to maintain price stability with smaller and shorter interest rate adjustments.