

- Share
Trends in Manufacturing in the United States
Manufacturing remains an important component of the US economy, yet its role has shifted: productivity growth in the sector has slowed, and its employment share has declined, the latter of which is a trend driven by reduced entry of workers into the sector. At the same time, the manufacturing workforce has become more educated, while the sector’s historical wage premium has diminished. These trends reflect a broader shift in the role that manufacturing plays in the US economy and in the labor market opportunities it provides.

The views authors express in Economic Commentary are theirs and not necessarily those of the Federal Reserve Bank of Cleveland or the Board of Governors of the Federal Reserve System. The series editor is Tasia Hane. This paper and its data are subject to revision; please visit clevelandfed.org for updates.
Introduction
In recent decades, the manufacturing sector in the United States has undergone profound transformation, moving from its place at the center of the US economy to a less significant status. Employment share in the sector has declined, and the wage premium once associated with manufacturing work has been steadily eroded. This Economic Commentary traces the evolution of manufacturing in the US economy. It first reviews trends in manufacturing output and productivity and then documents the long-term decline in employment share alongside changes in the education-level composition of the manufacturing workforce. The analysis also considers how wage premia in manufacturing have evolved and reviews evidence on the growing role of automation and technological adoption in shaping production and labor demand. Documenting these trends together helps characterize how manufacturing's contribution to the US economy, and to the employment and earnings prospects of American workers, has diminished over recent decades.
The scale of manufacturing today
According to the US Bureau of Economic Analysis (2026b), real value-added output in the manufacturing sector reached approximately $2.4 trillion as of 2025:Q3, accounting for about 9.5 percent of US GDP and making manufacturing the third-largest private sector in the country behind professional and business services and real estate and rental and leasing. That share of GDP is a marked departure from the mid-twentieth century’s approximately 25 percent of GDP. In the same quarter, manufacturing also represents the largest component of the goods-producing sector, accounting for roughly 60 percent of total goods-producing industry value added. On the international stage, the United States remains a leading manufacturing economy. According to the United Nations’ 2024 International Yearbook of Industrial Statistics, which reports data for 2023, the United States accounted for roughly 15 percent of global manufacturing value added, ranking second only to China (UNIDO, 2024).
However, the role of manufacturing in the US economy has declined substantially over the past several decades. While real manufacturing output has continued to expand, growing at an average annual rate of about 1.6 percent between 1998 and 2023, this pace has been slower than that of many service industries and the economy in the United States overall (National Institute of Standards and Technology, 2024).
Figure 1 presents historical trends in US manufacturing, focusing on output growth and productivity to provide broader context.
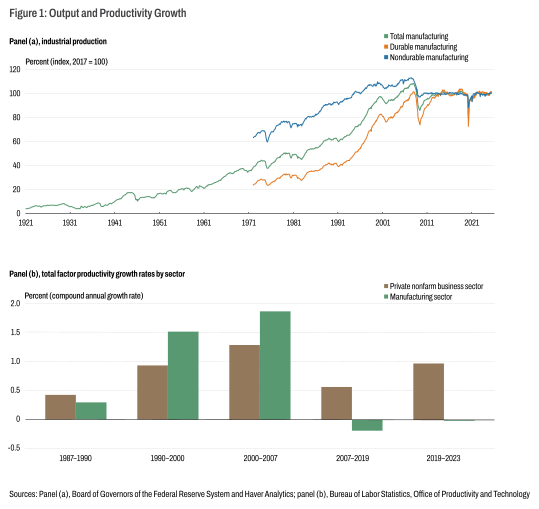
Figure 1, panel (a) displays the evolution of industrial production in manufacturing, and it shows that output growth has largely stalled over the past decade after several decades of steady expansion. This pattern is visible in both durable and nondurable goods, both of which categories exhibit a pronounced flattening beginning in the 2010s.
The slowdown in output growth is not simply the result of weaker input growth;1 it also reflects a decline in the sector’s underlying efficiency as captured by total factor productivity (TFP), which measures how effectively labor and capital are transformed into output. Figure 1, panel (b) compares TFP growth in manufacturing with that of the overall private nonfarm business sector.2 For roughly two decades, manufacturing TFP grew at a pace similar to or exceeding that of the broader private economy. However, beginning in the mid-2000s, manufacturing productivity diverged. Productivity in manufacturing began to contract, while productivity in the private economy overall continued to rise.
Trends in manufacturing employment
Shifts in employment patterns further illustrate how the manufacturing sector has evolved over recent decades. Figure 2 shows that manufacturing is the only major sector to experience a sustained decline in its employment share, from about 25 percent of the workforce in 1976 to roughly 10 percent in June 2025.
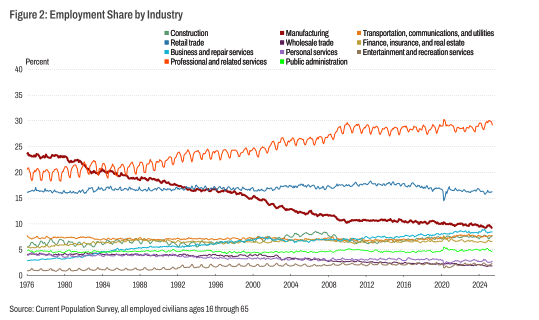
Alongside this persistent decline in employment share in the sector, manufacturers themselves report significant workforce challenges. The 2025:Q3 Quarterly Survey of Plant Capacity Utilization (US Census Bureau) reports that more than one-fifth of all manufacturers indicate that they were not able to work at full production capacity because of an insufficient supply of labor, while the National Association of Manufacturers survey in 2025:Q4 reports that more than half of manufacturers identify attracting and retaining qualified employees as a relevant challenge for their business.
Worker flows into and out of manufacturing have evolved over time but do not differ markedly from patterns observed in other sectors of the economy (results not shown, author’s analysis of US Census Bureau LED data). This suggests that worker mobility involving manufacturing largely reflects economy-wide labor market dynamics rather than sector-specific turnover. Instead, the key driver of manufacturing's employment decline has been the lack of younger workers entering the industry (results not shown, author’s analysis of CPS data). Specifically, between 1960 and 2009, each successive cohort of workers has entered manufacturing at progressively lower rates. At the same time, the composition of the manufacturing workforce has changed substantially.
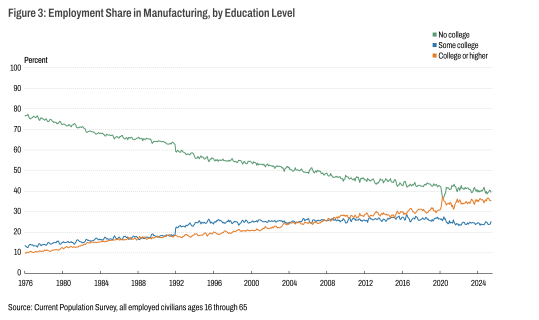
Workers in manufacturing today are more likely to have at least some college education. Figure 3 shows that in 1976, almost 80 percent of the manufacturing workforce were without a college degree. As of June 2025, this share among manufacturing workers had roughly halved to 39.4 percent, with workers with at least some college education accounting for the remaining 60.6 percent. Furthermore, while workers without a college degree vastly outnumbered those with at least a bachelor's degree in 1976 (by more than 60 percentage points), these two groups were nearly equal in size by June 2025 (4 percentage points apart).
Wage premia in manufacturing
Employment patterns over time show that the most recent generations of US workers are less likely to work in manufacturing. I examine whether the attractiveness of employment in this sector, measured through its hourly wage premium relative to that of other sectors, has also changed over time. Figure 4 illustrates the evolution of these wage premia,3 defined as the average wage difference between workers in a given industry and those with similar observable characteristics, such as age, education, and occupation, in the rest of the economy. In the figure, I present the premium for manufacturing. A positive premium in an industry indicates that workers in that industry earn more than comparable workers elsewhere, while a negative premium indicates the opposite.
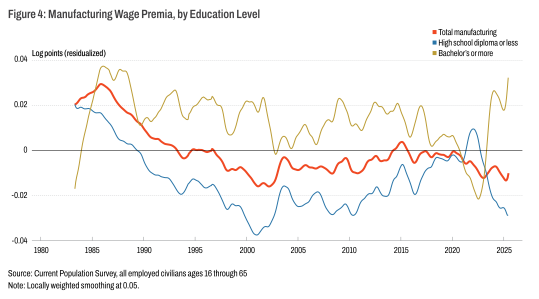
In the 1980s, manufacturing workers enjoyed a positive wage premium and earned more than workers with similar observable characteristics in other industries. In the early 1990s, the premium turned negative, meaning that manufacturing workers now earn less on average than comparable workers in the broader economy. When broken down by education level, a clear divergence in wage premium trends emerges. Excepting the pandemic period, workers with a high school diploma or less have faced negative wage premia beginning in the late 1980s. In contrast, again excepting the pandemic period, college-educated manufacturing workers have consistently received positive wage premia.
The rising role of automation in manufacturing
The manufacturing sector has been shaped, in part, by the growing role of automation in production. One way to track this shift is through the firms’ use of robots, since this use is often used as a proxy for the diffusion of automation (see, for example, Acemoglu and Restrepo, 2020; and Graetz and Michaels, 2018). The International Federation of Robotics reports a sharp increase in robot adoption beginning in the early 1990s. Measured as installations per thousand workers, robot density rose from fewer than 0.5 robots per thousand workers in the 1990s4 to nearly 30 per thousand by 2023.5
Research suggests that this rise in automation has affected both productivity and labor demand. Acemoglu and Restrepo (2020), for instance, show that robot adoption is associated with higher value-added output and labor productivity at the industry level, but lower labor demand in the local labor markets most exposed to robots. Their estimates on the effects of local exposure to robots suggest that each additional robot per thousand workers is associated with a decline of 0.45 percentage points in the employment-to-population ratio in more exposed commuting zones relative to less exposed ones, of which 0.16 percentage points are accounted for by the manufacturing sector. Their paper also documents a 0.77 percent reduction in local hourly and weekly wages.
Evidence from other advanced economies points to similar adjustments within the manufacturing sector. Studying the German labor market, Dauth et al. (2021) show that industrial robots reduce employment in manufacturing industries even though some of these losses are offset by employment gains in other sectors of the economy. Their findings suggest that manufacturing bears the most direct labor-market effects of automation. In Germany, manufacturing job losses are largely offset by gains in services, so that the aggregate employment effect is close to zero.
Taken together, this body of evidence suggests that automation has contributed to reshaping production processes and labor demand within manufacturing.
Conclusion
The evidence reviewed in this Economic Commentary shows that the US manufacturing sector remains large in absolute terms but has undergone a profound transformation in the past few decades. While manufacturing continues to contribute substantially to US output, its shares of GDP and employment have declined amid steady shifts toward services. Once a leading factor in productivity growth, manufacturing TFP growth has lagged behind the broader private economy since the mid-2000s.
The declines in manufacturing’s employment share have stemmed mainly from fewer workers starting out in the sector at the beginning of their careers rather than from workers leaving it later in their careers. At the same time, the manufacturing workforce has grown more educated. The wage premium once associated with manufacturing has been maintained for these more educated workers, but has eroded and is now negative for less-educated workers. Automation and technological adoption appear to have contributed to these shifts. Together, these developments highlight the structural transformation of US manufacturing over the past several decades.
References
- Acemoglu, Daron, and Pascual Restrepo. 2020. “Robots and Jobs: Evidence from US Labor Markets.” Journal of Political Economy 128(6): 2188–2244. doi.org/10.1086/705716.
- Autor, David H., David Dorn, and Gordon H. Hanson. 2013. “The China Syndrome: Local Labor Market Effects of Import Competition in the United States.” American Economic Review 103(6): 2121–2168. doi.org/10.1257/aer.103.6.2121.
- Autor, David H., David Dorn, Gordon H. Hanson, and Jae Song. 2014. “Trade Adjustment: Worker-Level Evidence.” Quarterly Journal of Economics 129(4): 1799–1860. doi.org/10.1093/qje/qju026.
- Dauth, Wolfgang, Sebastian Findeisen, Jens Suedekum, and Nicole Woessner. 2021. “The Adjustment of Labor Markets to Robots.” Journal of the European Economic Association 19(6): 3104–3153. doi.org/10.1093/jeea/jvab012.
- Flaaen, Aaron, and Justin Pierce. 2024. “Disentangling the Effects of the 2018-2019 Tariffs on a Globally Connected US Manufacturing Sector.” Review of Economics and Statistics, September 16, 1–45. doi.org/10.1162/rest_a_01498.
- Flood, Sarah, Miriam King, Renae Rodgers, Steven Ruggles, J. Robert Warren, Daniel Backman, Etienne Breton, Grace Cooper, Julia A. Rivera Drew, Stephanie Richards, David Van Riper, and Kari C.W. Williams. 2025. “IPUMS, Current Population Survey: Version 13.0.” Minneapolis, MN: IPUMS. doi.org/10.18128/D030.V13.0.
- Graetz, Georg, and Guy Michaels. 2018. “Robots at Work.” Review of Economics and Statistics, 100(5): 753–768. doi.org/10.1162/rest_a_00754.
- Hakobyan, Shushanik, and John McLaren. 2016. “Looking for Local Labor Market Effects of NAFTA.” Review of Economics and Statistics 98(4): 728–741. doi.org/10.1162/REST_a_00587.
- International Federation of Robotics. 2024. Global Robot Density in Factories Doubled in Seven Years. Press Release, November 20. ifr.org/ifr-press-releases/news/global-robot-density-in-factories-doubled-in-seven-years.
- National Association of Manufacturers. 2025. Manufacturers’ Outlook Survey: Fourth Quarter 2025. nam.org/2025-fourth-quarter-manufacturers-outlook-survey/.
- National Institute of Standards and Technology. 2026. “Total US Manufacturing Economy.” nist.gov/el/applied-economics-office/manufacturing/manufacturing-economy/total-us-manufacturing.
- UNIDO Statistics. 2024. “International Yearbook of Industrial Statistics 2024.” United Nations Industrial Development Organization, November 25. stat.unido.org/publications/international-yearbook-industrial-statistics-2024.
- US Bureau of Economic Analysis. 2026a. “GDP by Industry.” bea.gov/data/gdp/gdp-industry.
- US Bureau of Economic Analysis. 2026b. “Value Added by Industry: Manufacturing as a Percentage of GDP [VAPGDPMA].” Retrieved from FRED, Federal Reserve Bank of St. Louis. fred.stlouisfed.org/series/VAPGDPMA.
- US Bureau of Economic Analysis. 2026c. “Value Added by Industry: Private Goods-Producing Industries as a Percentage of GDP [VAPGDPGPI].” Retrieved from FRED, Federal Reserve Bank of St. Louis. fred.stlouisfed.org/series/VAPGDPGPI.
- US Bureau of Labor Statistics. 2026a. “Private Nonfarm Business Sector: Total Factor Productivity [MFPNFBS].” Retrieved from FRED, Federal Reserve Bank of St. Louis. fred.stlouisfed.org/series/MFPNFBS.
- US Bureau of Labor Statistics. 2026b. “Manufacturing Sector: Total Factor Productivity [MFGPROD].” Retrieved from FRED, Federal Reserve Bank of St. Louis. fred.stlouisfed.org/series/MFGPROD.
- US Census Bureau. 2025a. “Quarterly Survey of Plant Capacity Utilization (QPC).” census.gov/programs-surveys/qpc.html.
- US Census Bureau. 2025. "Longitudinal Employer-Household Dynamics: LEHD Employment Dynamics (LED)." Center for Economic Studies. lehd.ces.census.gov/.
- World Bank Group. “GDP (Current US$).” World Bank Open Data. Accessed April 27, 2026. data.worldbank.org.
Endnotes
- Input growth is the growth in the productive resources, usually capital and labor, used in the production process, weighted by their relative economic importance. Return to 1
- This comprises all private-sector businesses except farms, private households, and nonprofit institutions serving individuals. Return to 2
- I define wage premia using a residual approach. I regress log wages on age and age squared, education, industry, occupation, and month fixed effects, controlling for gender, race and ethnicity, Hispanic origin, metropolitan status, and marital status, and weighting observations by earnings. The residuals from this regression represent the portion of wages not explained by these observable characteristics. I compute average residuals by group and time to obtain wage premia. Return to 3
- Acemoglu and Restrepo (2020). Return to 4
- International Federation of Robotics. Return to 5
Suggested Citation
Dicandia, Vittoria. 2026. “Trends in Manufacturing in the United States.” Federal Reserve Bank of Cleveland, Economic Commentary 2026-21. https://doi.org/10.26509/frbc-ec-202621
This work by Federal Reserve Bank of Cleveland is licensed under Creative Commons Attribution-NonCommercial 4.0 International


Related resources

About Us
The Federal Reserve Bank of Cleveland (commonly known as the Cleveland Fed) is part of the Federal Reserve System, the central bank of the United States.

Economic Commentaries
Economic Commentaries provide analysis of relevant economic issues and are written for an informed but nonspecialist audience.