

- Share
A Fracturing Wage Floor? Below-Minimum Wages in the Twenty-First Century
Recent data suggest a growing prevalence and magnitude of below-minimum wages, including minimum-wage violations, in the United States in the twenty-first century. In the 10 most populous states, the incidence of likely minimum wage violations reached its highest level in 2025. Among workers experiencing violations, the average amount of underpayment reached its highest level in 2023. In the Fourth Federal Reserve District, however, we observe notable deviations from national trends, with declining incidence of minimum-wage violations since 2007.


The views authors express in Economic Commentary are theirs and not necessarily those of the Federal Reserve Bank of Cleveland or the Board of Governors of the Federal Reserve System. The series editor is Tasia Hane. This paper and its data are subject to revision; please visit clevelandfed.org for updates.
Introduction
In fiscal year 2025, the US Department of Labor recovered more than $259 million in back wages and damages owed to 176,957 workers (US Department of Labor, 2025). These recoveries were in response to various forms of what is termed “wage theft,” including unpaid overtime, unlawful wage deductions, and minimum-wage violations. However, this figure comprises only the amount recovered through government enforcement. Existing research estimates that from 2013 through 2015, workers in the 10 most populous states experienced minimum-wage-violation underpayments of $8 billion annually, affecting 2.4 million workers, with the average affected worker underpaid by about $3,300 per year (Cooper and Kroeger, 2017). Cooper and Kroeger find that if these workers were paid at the applicable minimum wage, then they would experience a roughly 30 percent reduction in poverty rates.1
In the decade since the end of the period analyzed by Cooper and Kroeger, many states have implemented minimum-wage rates above the federal minimum of $7.25 per hour, frequently setting them at or above $15 per hour. In some states, such as Ohio, the minimum wage was tied to inflation during this period; it thus increased gradually year over year. Given evolving minimum-wage laws, we draw on Cooper and Kroeger’s methodology and extend their analysis of the 10 most populous states to 1996 through 2025 and then look at Ohio, Pennsylvania, and Kentucky, three states within the Fourth Federal Reserve District, during the same period.
In this Economic Commentary, we find that
- Below-minimum-wage payments are mainly attributable to minimum-wage violations rather than legal exemptions for paying under the applicable minimum wage.
- Workers nationwide are experiencing a growing incidence of below-minimum wages and of minimum-wage violations.
- Among workers experiencing minimum-wage violations, the magnitude of their average underpayment has increased in the 10 most populous states in the twenty-first century, but with notable regional variations.
- Violation incidence rises following minimum-wage increases.
- The three Fourth District states under examination here deviate from overall national patterns, with decreasing minimum-wage-violation incidence since 2007.
Data
To identify workers experiencing below-minimum wages and minimum-wage violations, we use the US Census Bureau’s Current Population Survey.2 We use a conservative methodological approach to identify such workers, especially in regard to exempt and tip-earning workers, producing lower-bound estimates of incidence. This approach is generally consistent with those in Cooper and Kroeger (2017) and Galvin et al. (2024). Further information on the methodology we use to identify minimum-wage exemptions and address measurement error can be found in the appendix.
This analysis is limited to federal and state minimum wages and does not account for city- or county-level minimum wages, thus likely understating total minimum-wage-violation incidence. Galvin et al. (2024), for example, incorporate city-level minimum wages into their analysis, revealing significant increases in city-specific incidence rates compared to when only state-level minimums are used for the applicable city.3
First, we confine our attention to the 10 most populous states to gauge broader national trends.4 Then, we focus on three states within the Fourth District: Pennsylvania, Ohio, and Kentucky.
What Constitutes a Minimum-Wage Violation?
Paying below the minimum wage is often interpreted by the public as a minimum-wage violation, but not all below-minimum-wage cases are unlawful. The Fair Labor Standards Act (FLSA) permits the payment of subminimum wages to specific categories of workers, including certain individuals with disabilities,5 those in exempt occupations,6 and certified apprentices. A wide array of additional exemptions exists in select states for particular occupations.7 The FLSA sets a lower federal youth minimum wage of $4.25 per hour for workers under 20 years old during their first 90 consecutive calendar days of employment, but some states have a higher state youth minimum wage or apply their standard state minimum wage to young workers. Additionally, federal government employees can legally be paid below a state’s minimum wage if their earnings meet or exceed the federal minimum (US Office of Personnel Management, 2019).
In Figure 1, we compare three related measures:
- Below-minimum-wage incidence among all wage-and-salary workers: the share of all wage-and-salary workers who earn below the applicable standard minimum wage, among all wage-and-salary workers (green line). This measure includes those paid below the minimum wage under lawful exemptions. We include this measure because, while lawful, some critics view many of these exemptions as unjustified.8
- Minimum-wage-violation incidence among all wage-and-salary workers: the share of nonexempt wage-and-salary workers who earn below the applicable minimum wage, among all wage-and-salary workers (purple line).
- Minimum-wage-violation incidence among nonexempt wage-and-salary workers: the share of nonexempt wage-and-salary workers who earn below the applicable minimum wage, among all nonexempt wage-and-salary workers (orange line).
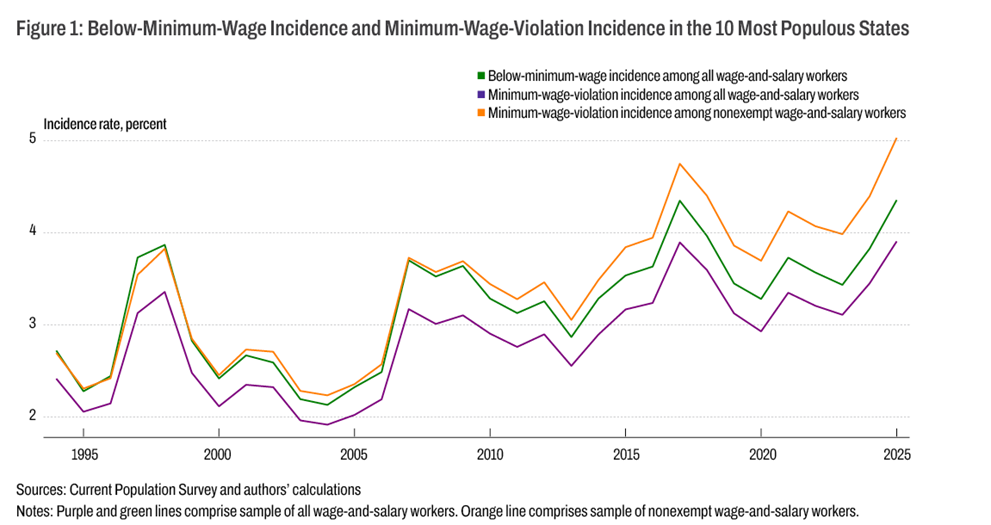
Across the 10 most populous states, both below-minimum-wage incidence and minimum-wage-violation incidence among all wage-and-salary workers have nearly doubled since 2004, with both reaching their highest recorded level in 2025. Violation incidence among nonexempt wage-and-salary workers reached 5 percent in 2025, its highest level on record. As shown by the difference between the green and purple lines, 9 percent to 15 percent of below-minimum-wage incidence can be explained by legally exempt below-minimum wages, while 85 percent to 91 percent of below-minimum-wage incidence can be explained by likely minimum-wage violations. If we suppose that the 10 most populous states are broadly representative of national patterns, we can estimate that approximately 6.5 million workers nationwide were paid a below-minimum wage in 2025, of whom about 5.8 million experienced a minimum-wage violation.9
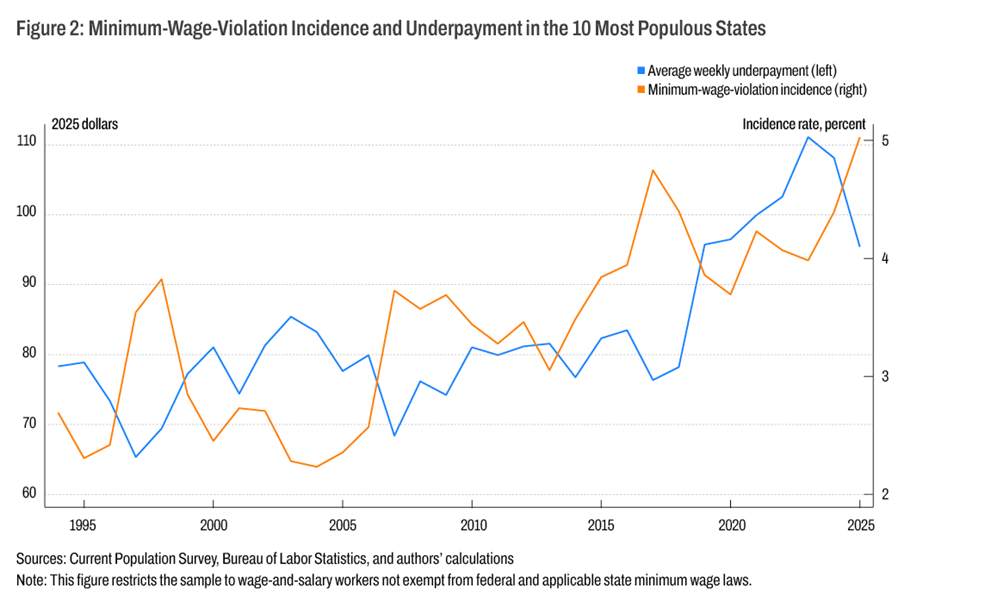
In Figure 2, the orange line repeats from Figure 1 the incidence of minimum-wage violations, defined as the percentage of nonexempt wage-and-salary workers earning below the applicable minimum wage, among all nonexempt wage-and-salary workers.10 The blue line shows the average weekly underpayment among workers experiencing violations, defined as the average difference between the applicable minimum wage and the individual’s reported hourly wage that is then multiplied by hours worked per week.11 Underpayment values were adjusted for inflation using the consumer price index for all urban consumers, expressed in 2025 dollars.12 In the 10 most populous states, both violation incidence and average underpayment show increasing trends since 1994. Average weekly underpayment rose particularly sharply starting in 2017, reaching more than $110 per week in 2023, or approximately $5,720 per year.
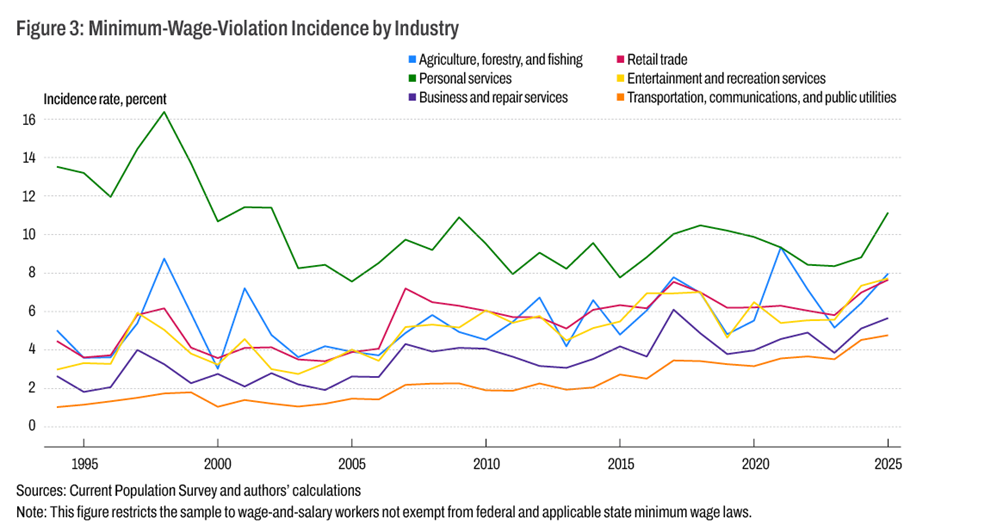
Figure 3 shows the violation incidence among nonexempt workers of the six industries with the highest incidence rates. We observe that personal services (green line) has the highest incidence rate and followed a largely downward trend until 2005, after which it has been relatively flat overall. The other five industries have experienced a gradual increase in violation incidence, with incidence rates in each roughly doubling since 1994, generally consistent with the overall trend shown in Figure 2. However, it is worth mentioning that while the personal services industry has the highest violation incidence rate, retail trade has the most minimum-wage-violations against workers in absolute terms, reflecting its large overall workforce and high incidence rate.
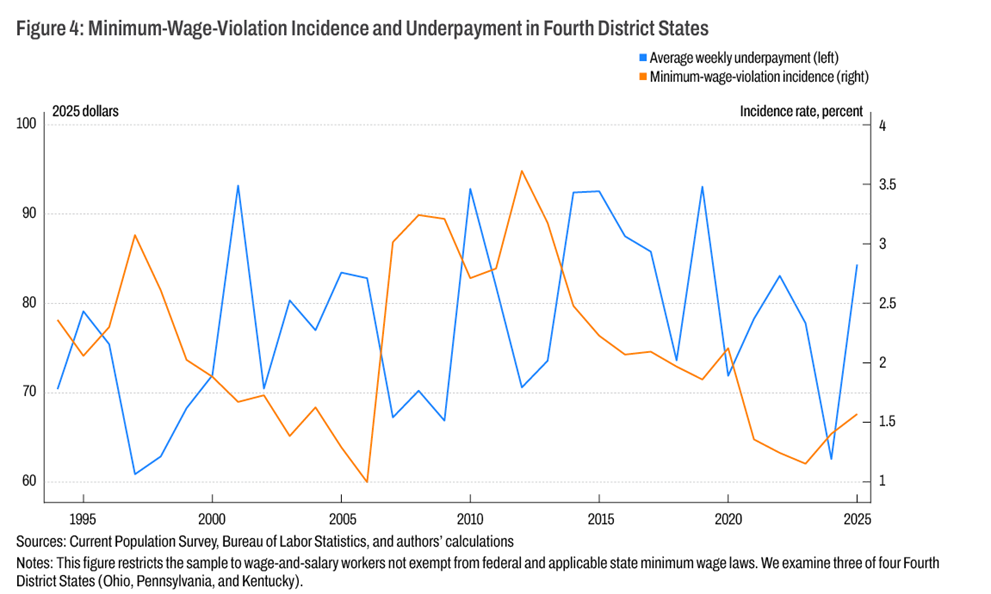
In Figure 4, the orange line illustrates violation incidence among nonexempt workers in Ohio, Pennsylvania, and Kentucky, three of the four Fourth District states, and the blue line illustrates the real average weekly underpayment of these workers. In these Fourth District states, we observe an initial increase in violation incidence during the series of federal minimum-wage increases from 1996 through 1998 that raised the rate from $4.25 to $5.15 per hour, followed by a steady decline in violation incidence until 2007.
In January 2007, Ohio increased its minimum wage above the federal level and also tied its future annual minimum-wage increases to inflation. Kentucky and Pennsylvania gradually increased their minimum wages from $5.15 to $7.25 per hour from 2007 through 2009, with both states following the federal minimum of $7.25 per hour since July 2009. During and after these minimum-wage hikes, violation incidence in these three states surged from 2007 through 2012. While we do not attempt to establish a causal relationship between Fourth District minimum-wage changes and violation incidence, existing literature finds evidence that minimum wage increases lead to increased incidence of minimum-wage violations and that these estimates are unlikely to be driven by measurement error in Current Population Survey (CPS) wage data (Clemens and Strain, 2022).
Violation incidence in these Fourth District states declined after 2012, reaching its lowest level in 2023, a trend which contrasts with the national patterns shown in Figure 1. Among these workers who are experiencing minimum-wage violations, their average weekly underpayment has mostly fluctuated between $60 and $95 per week (in 2025 dollars) since 2000.
How Do Fourth District States Compare to Other Regions across the Country?
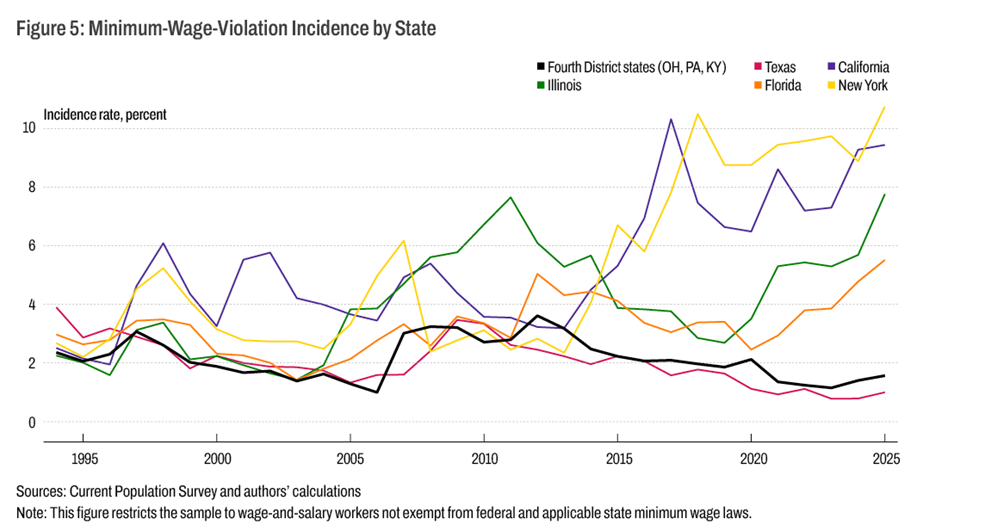
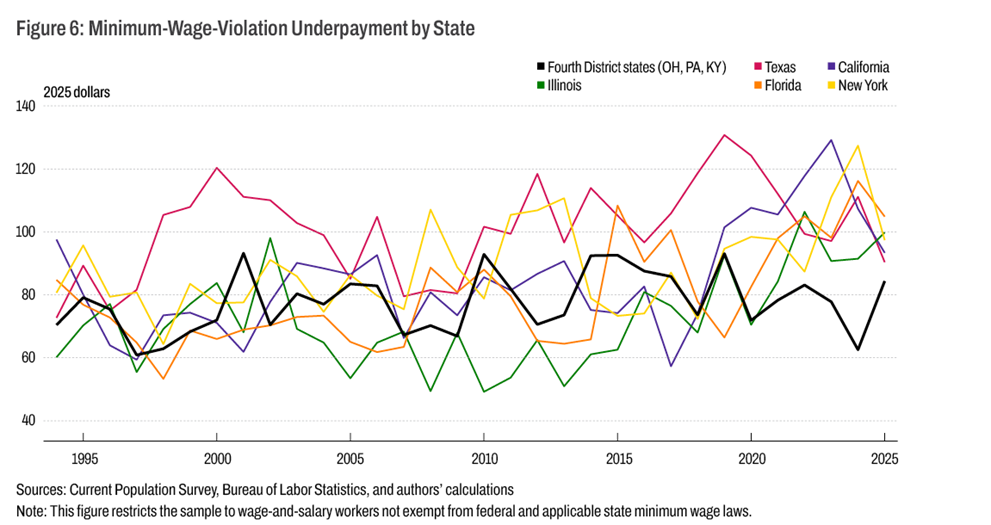
We compare these three Fourth District states to other regions of the country by selecting the five most populous states, California, New York, Florida, Texas, and Illinois, as representatives of their respective geographical regions (Figures 5 and 6). Coincidentally, the selected states span a range of minimum-wage laws. California, New York, Illinois, Florida, and Ohio currently have state minimum wages that exceed the federal minimum (California, $16.50; New York, $15.50; Illinois, $15.00; Florida, $14.00; Ohio, $10.70, as of December 2025). Conversely, Texas, Pennsylvania, and Kentucky follow the federal minimum of $7.25 per hour.
Since the last federal minimum-wage increase in 2009, states that set their minimum wage at or relatively near the federal minimum (Texas, Ohio, Pennsylvania, and Kentucky) have experienced declining violation incidence. By contrast, states that have raised their minimum wage considerably above the federal minimum (California, Florida, New York, and Illinois) have experienced growing violation incidence rates. Despite this contrast, real average weekly underpayment among workers who experienced minimum-wage violations has been on a gradual uptrend in nearly all selected states.
Conclusion
There is much policy interest in minimum-wage changes but limited focus on enforcement efficacy. By expanding on earlier research, we show that minimum-wage-violation incidence and underpayment have been increasing in the 10 most populous states, reaching their highest recorded levels in 2025 and 2023, respectively. Additionally, we demonstrate that a large majority of below-minimum-wage incidence is likely explained by violations.
Currently, the US Department of Labor enforces the federal minimum wage but not state minimums, and many states have limited proactive measures to ensure compliance with their own wage standards (Gerstein, 2021). In 2018, seven states had no investigators to handle minimum-wage violations, while 26 additional states had fewer than 10 investigators (Gerstein, 2021). As a result, workers experiencing violations often must navigate the time-intensive process of filing a lawsuit or an administrative wage claim. This situation is likely compounded by limited awareness among both workers and employers of up-to-date minimum-wage regulations, a circumstance which can contribute to unintentional noncompliance.
References
- Bloomberg Law. 2025. “Minimum Wage.” Bloomberg. Accessed January 15, 2025.
- Clemens, Jeffrey, and Michael R. Strain. 2022. “Understanding ‘Wage Theft’: Evasion and Avoidance Responses to Minimum Wage Increases.” Labour Economics 79(December): 102285. doi.org/10.1016/j.labeco.2022.102285.
- Cooper, David, and Teresa Kroeger. 2017. "Employers Steal Billions from Workers' Paychecks Each Year." Economic Policy Institute. epi.org/publication/employers-steal-billions-from-workers-paychecks-each-year/.
- Flood, Sarah, Miriam King, Renae Rodgers, Steven Ruggles, J. Robert Warren, Daniel Backman, Etienne Breton, Grace Cooper, Julia A. Rivera Drew, Stephanie Richards, and David Van Riper. 2025. “Integrated Public Use Microdata Series, Current Population Survey: Version 13.0 [dataset].” Minneapolis, MN: IPUMS. doi.org/10.18128/D030.V13.0.
- Galvin, Daniel J., Jake Barnes, Janice Fine, and Jenn Round. 2024. “Wage Theft in California: Minimum Wage Violations, 2014–2023.” Rutgers School of Management and Labor Relations. smlr.rutgers.edu/sites/default/files/Documents/Centers/WJL/California_MinimumWage_Study_May2024.pdf.
- Gerstein, Terri. 2021. “How District Attorneys and State Attorneys General Are Fighting Workplace Abuses.” Economic Policy Institute. epi.org/publication/fighting-workplace-abuses-criminal-prosecutions-of-wage-theft-and-other-employer-crimes-against-workers/.
- US Bureau of Labor Statistics. “Consumer Price Index for All Urban Consumers: All Items in US City Average (CPIAUCSL).” Retrieved from FRED, Federal Reserve Bank of St. Louis. Accessed January 13, 2026. fred.stlouisfed.org/series/CPIAUCSL.
- US Census Bureau. 2025. “Basic Monthly Current Population Survey (CPS).” census.gov/data/datasets/time-series/demo/cps/cps-basic.html.
- US Department of Labor. 2025. “Forging the Future: A Year of Progress Focused on the American Workforce.” dol.gov/agencies/whd/data.
- US Office of Personnel Management. 2019. “Inapplicability of a State or Local Minimum Wage to Federal Employees.” CPM 2019-23. opm.gov/chcoc/transmittals/2019/Inapplicability%20of%20a%20State%20or%20Local%20Minimum%20Wage%20to%20Federal%20Employees_508.pdf.
Endnotes
- Cooper and Kroeger (2017) find that 21.4 percent of workers experiencing minimum-wage violations are in poverty, and that this share in poverty would be 14.8 percent if they were instead paid the applicable minimum wage. We take the percent difference between these two shares. Return to 1
- “Below-minimum wage” is defined as a wage less than the applicable standard minimum-wage, regardless of legal exemptions or legal subminimum wages for certain exempt worker groups. “Minimum-wage violation” indicates the violation of labor laws by failing to pay the required applicable standard minimum-wage to nonexempt workers or the applicable subminimum wage to certain exempt workers. Dataset obtained from Integrated Public Use Microdata Series, Current Population Survey (Flood et al., 2023). Return to 2
- Galvin et al. (2024) show that the incidence rate in San Francisco triples when city-level rather than state-level minimum wage benchmarks are used. Similarly, the incidence rate in San Diego doubles, while the rate in Los Angeles rises by 60 percent. Return to 3
- California, Texas, Florida, New York, Pennsylvania, Illinois, Ohio, Georgia, North Carolina, and Michigan, from most to least populous as of December 2025. Return to 4
- Under FLSA section 14(c), with certification from the Department of Labor, workers with disabilities can legally be paid a subminimum wage. Return to 5
- FLSA exemptions include certain agriculture farmers, fishers, aquaculture farmers, computer professionals, newspaper deliverers, religious workers, outside salespersons, seasonal recreation camp workers, nonhourly managers, nonhourly professionals, and nonhourly administrative workers. For tipped workers, employers may pay a subminimum base wage, but total earnings (base wage plus tips) must meet or exceed the federal minimum wage. If state law requires a higher subminimum base wage or does not exempt the particular occupation from the state minimum wage, the higher state minimum applies for the particular occupation. For additional details, see the appendix. Return to 6
- Some states have state minimum-wage exemptions for occupations such as cab drivers, motor carriers, university students, hair stylists, barbers, musicians, singers, actors, and stage production workers (Bloomberg Law, 2025). Return to 7
- Certain critics often view exemptions as discriminatory because, for example, an exempt youth worker may hold the same position and perform the same job functions as a nonexempt older worker but be subject to a different minimum wage. However, advocates of these exemptions contend that they reduce employment barriers for workers who would comparatively struggle to find jobs at standard minimum wages. For instance, employers may prefer experienced older workers over youth workers, as the former could provide higher productivity and require less training. Thus, exemption advocates contend that such exemptions enable employers to hire workers who would comparatively struggle at wages reflecting their productivity level. Return to 8
- Found by multiplying the number of wage-and-salary workers in 2025 by the incidence rate among all wage-and-salary workers. Return to 9
- Youth workers and federal government workers are still included in the sample. We apply their respective applicable minimums. Tipped workers are included as well because their total earnings are subject to the applicable minimum wage. Our methodology incorporates tip-inclusive earnings. Return to 10
- For most workers, we use reported usual hours worked per week at their main job. For those reporting that usual hours vary or who fail to report usual hours, we use actual hours worked in the previous week at their main job. Return to 11
- CPI data are from the US Bureau of Labor Statistics (2026), pulled from FRED. Return to 12
Suggested Citation
Kim, Youha, and Bruce Fallick. 2026. “A Fracturing Wage Floor? Below-Minimum Wages in the Twenty-First Century.” Federal Reserve Bank of Cleveland, Economic Commentary 2026-19. https://doi.org/10.26509/frbc-ec-202619
This work by Federal Reserve Bank of Cleveland is licensed under Creative Commons Attribution-NonCommercial 4.0 International


Related resources
About Us
The Federal Reserve Bank of Cleveland (commonly known as the Cleveland Fed) is part of the Federal Reserve System, the central bank of the United States.

Economic Commentaries
Economic Commentaries provide analysis of relevant economic issues and are written for an informed but nonspecialist audience.