

- Share
The “Low-Hire, Low-Fire” Labor Market
Hires and quits have been low during the strong labor market over the past year or so, when layoffs have also been low. This combination is historically unusual. However, it is likely a continuation of long-term trends rather than something unique to the current period.

The views authors express in Economic Commentary are theirs and not necessarily those of the Federal Reserve Bank of Cleveland or the Board of Governors of the Federal Reserve System. The series editor is Tasia Hane. This paper and its data are subject to revision; please visit clevelandfed.org for updates.
Introduction
[The current labor market] doesn’t feel like a good labor market to some who don’t have jobs because quits are really low, hires are really low, . . . the labor market is in balance, but it’s an unusual and uncomfortable kind of a balance where people who don’t have jobs will have a hard time breaking in.
The situation alluded to by then-Chair Powell in the above quotation is often referred to as the “low-hire, low-fire” labor market. In this Economic Commentary, I briefly clarify what is meant by this term and what is unusual about the current situation referenced and then provide a longer-term context.
Half of the “low-hire, low-fire” labor market is a misnomer. “Low-hire” is straightforward: Hires indicate adding new workers to companies’ payrolls, in other words, accessions to an employer, including both movements from nonemployed to employed and movements of currently employed individuals directly from a given employer to another. But perhaps less straightforward is the “low-fire” part, which does not refer to employee dismissals for cause in particular. Rather, it refers either to separations of all kinds or to layoffs, depending on the speaker. The distinction can matter: The bulk of separations are employee quits or company layoffs, with quits greatly outnumbering layoffs most of the time.
Figure 1 shows the hire, quit, and layoff rates from the Bureau of Labor Statistics’ Job Openings and Labor Turnover Survey (JOLTS).1 The hiring rate has come down drastically from its elevated pandemic-recovery level and stands below its levels in the strong labor markets during the expansions in the 2000s and 2010s. Layoffs are also low compared to during the two previous strong labor markets. The quit rate has also fallen drastically from its high levels during the COVID-19 pandemic, and it stands at levels somewhat below those of the late 2010s, when the unemployment rate was at similar levels to that of recent months. Admittedly, whether one considers the quit rate to be low at the time of this writing may be rather subjective.
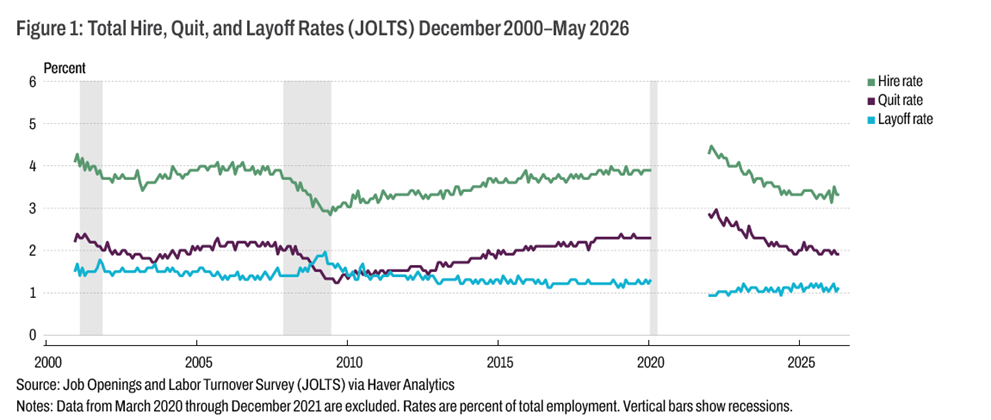
As can be seen even from this relatively brief time span, hires and quits tend to rise and fall together. Therefore, it is not unusual that they would both be low simultaneously. What is unusual is that they are both low at a time when the labor market is relatively healthy. In general, both are highly procyclical. Put another way, they are both low at a time when layoffs, which tend to rise in recessions, are also low.
Long-term trends
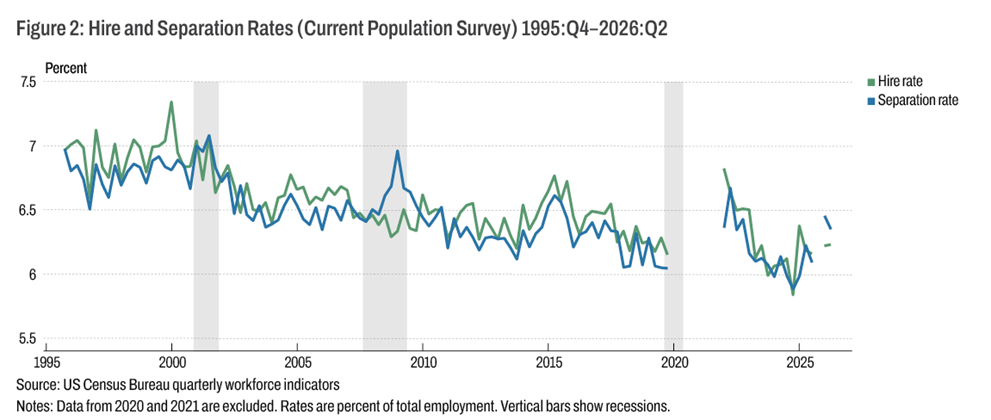
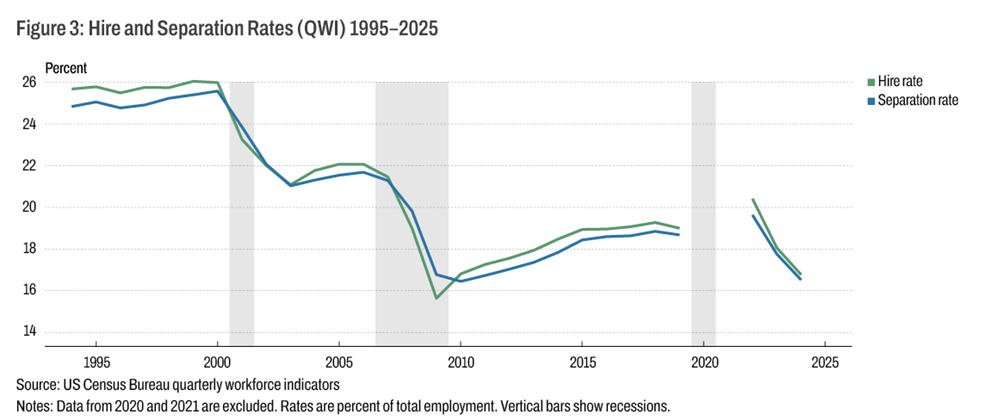
This unusual confluence appears to be a product of a long-term downtrend in what has been termed labor market “fluidity.” The JOLTS data begin at the end of 2000; looking further back in time requires a turn to other sources of data. Unfortunately, however, these sources do not allow one to make distinctions among types of separations, so one must look to the total separation rate. Figure 2 shows hire and total separation rates from 1995 onward, calculated from the Current Population Survey.2 These rates combine estimates from the Bureau of Labor Statistics on movements across labor market statuses,3 with estimates of employer-to-employer movements from Fujita, Moscarini, and Postel-Vinay (Federal Reserve Bank of Philadelphia). Figure 3 shows hire and separation rates from another source available during the same period, the Census Bureau’s Quarterly Workforce Indicators.4 Both sources suggest a secular downtrend in both hire and separation rates going back to at least the mid-1990s.
There is a sizable literature on declining fluidity in the US economy, with an emphasis on the labor market. This literature finds downtrends along a number of dimensions in addition to hires and separations: establishment-level job reallocation rates, occupational mobility, domestic migration, and the number of short-term jobs.5
By combining these various dimensions of fluidity, Molloy et al. (2016) date the beginning of the downtrend to the early 1980s, possibly before. They, along with other researchers, have found that the decline has been broad based across types of workers and sectors and that perhaps half of the general decline in fluidity can be attributed to demographic factors, notably the aging of the population and increases in levels of education.6 However, the reasons for the remaining half are not well understood. As the population is expected to continue to age, with older adults making up a larger percentage of the adult population,7 at least part of the downtrend can be expected to remain.
Conclusion
The recent confluence of low hire rates, low quit rates, and low layoff rates is likely a result of a long-term downtrend in labor market fluidity in general. While not all of the reasons for the downtrend are understood, as the population continues to age, it seems unlikely that fluidity will fully rebound in the near future.
References
- Coate, Patrick, and Kyle Mangum. 2026. “Fast Locations and Slowing Mobility.” Federal Reserve Bank of Philadelphia, Working Paper No. 26-26. doi.org/10.21799/frbp.wp.2026.26.
- Davis, Steven J., R. Jason Faberman, John Haltiwanger, Ron Jarmin, and Javier Miranda. 2010. “Business Volatility, Job Destruction, and Unemployment.” American Economic Journal: Macroeconomics 2(1): 259–287. doi.org/10.1257/mac.2.2.259.
- Decker, Ryan, John Haltiwanger, Ron Jarmin, and Javier Miranda. 2014. “The Role of Entrepreneurship in US Job Creation and Economic Dynamism.” Journal of Economic Perspectives 28(3): 3–24. dx.doi.org/10.1257/jep.28.3.3.
- Felix, Alison. 2026. “Is the US Labor Force Nearing Its Peak?” Federal Reserve Bank of Kansas City, Economic Bulletin. kansascityfed.org/research/economic-bulletin/is-the-us-labor-force-nearing-its-peak/.
- Federal Reserve Bank of Philadelphia. Fujita, Moscarini, and Postel-Vinay. Employer-to-Employer Transition Probability. Accessed July13, 2026. philadelphiafed.org/surveys-and-data/macroeconomic-data/employer-to-employer-transition-probability.
- Hyatt, Henry R., and James R. Spletzer. 2017. “The Recent Decline of Single Quarter Jobs.” Labour Economics 46: 166–176. dx.doi.org/10.1016/j.labeco.2016.10.001.
- Molloy, Raven, Riccardo Trezzi, Christopher L. Smith, and Abigail Wozniak. 2016. “Understanding Declining Fluidity in the US Labor Market.” Brookings Papers on Economic Activity 1: 183–259. doi.org/10.1353/eca.2016.0015.
- US Census Bureau. QWI Explorer. qwiexplorer.ces.census.gov/.
- US Bureau of Labor Statistics. “Current Population Survey: Home.” bls.gov/cps/.
- US Bureau of Labor Statistics. “Job Openings and Labor Turnover Survey.” bls.gov/jlt/.
- US Bureau of Labor Statistics. “Research Series on Labor Force Status Flows from the Current Population Survey.” bls.gov/cps/cps_flows.htm.
- Vom Lehn, Christian, Cache Ellsworth, and Zachary Kroff. 2022. “Reconciling Occupational Mobility in the Current Population Survey.” Journal of Labor Economics 40(4): 1005–1051. doi.org/10.1086/718563.
Endnotes
- See the Bureau of Labor Statistics Job Openings and Labor Turnover Survey, available at bls.gov/jlt/. For brevity, I use “layoffs” to indicate “layoffs and discharges” in the JOLTS. Total separations in the JOLTS also include retirements, transfers, and separations as a result of disability or death. These categories are small compared to quits and layoffs. Return to 1
- See US Bureau of Labor Statistics Current Population Survey: Home, available at bls.gov/cps/. Return to 2
- See US Bureau of Labor Statistics Research Series on Labor Force Status Flows from the Current Population Survey, available at bls.gov/cps/cps_flows.htm. Return to 3
- See US Census Bureau QWI Explorer, available at qwiexplorer.ces.census.gov/. Return to 4
- For reallocation rates, see, for example, Decker et al., 2014; occupational mobility, Vom Lehn, Ellsworth, and Kroff, 2022; domestic migration, Coate and Mangum, 2026; and short-term jobs, Hyatt and Spletzer, 2017. Return to 5
- For example, see Davis et al., 2010. Return to 6
- For example, see Felix, 2026. Return to 7
Suggested Citation
Fallick, Bruce. 2026. “The 'Low-Hire, Low-Fire' Labor Market.” Federal Reserve Bank of Cleveland, Economic Commentary 2026-17. https://doi.org/10.26509/frbc-ec-202617
This work by Federal Reserve Bank of Cleveland is licensed under Creative Commons Attribution-NonCommercial 4.0 International


Related resources

About Us
The Federal Reserve Bank of Cleveland (commonly known as the Cleveland Fed) is part of the Federal Reserve System, the central bank of the United States.

Economic Commentaries
Economic Commentaries provide analysis of relevant economic issues and are written for an informed but nonspecialist audience.