

- Share
How do Consumers View Future Government Debt? A Primer on Debt-Growth Expectations
We analyze consumers’ expectations for growth in government debt before and after the COVID-19 pandemic, its breakdown by different income groups, and its relation to inflation expectations. We find that debt-growth expectations rose immediately during the pandemic recession and started to return to their prepandemic levels at the end of 2024. We also observe that consumers in the bottom 40 percent of the household-income distribution have higher debt-growth expectations than their counterparts in the middle 40 percent and top 20 percent of this distribution. A regression analysis indicates that government debt-growth expectations are positively correlated with inflation expectations in the post-pandemic recession period.
Replication materials for this Economic Commentary may be found at https://github.com/avdluduvice/LuduviceWalker_DGE.


The views authors express in Economic Commentary are theirs and not necessarily those of the Federal Reserve Bank of Cleveland or the Board of Governors of the Federal Reserve System. The series editor is Tasia Hane. This paper and its data are subject to revision; please visit clevelandfed.org for updates.
Introduction
The government debt held by the public is often viewed as a key measure of the government’s fiscal picture, and policymakers, academics, and the informed public follow its growth closely. Research shows that individuals are sensitive to information about the level of public debt, the debt-to-GDP ratio, or the outlook for or increase in debt, influencing their inflation expectations and how they shape their attitudes and expectations toward government spending and taxation (Coibion et al., 2021; Roth et al., 2022; Grigoli and Sandri, 2024; Bianchi et al., 2025).1
In this Economic Commentary, we analyze the recent dynamics of debt-growth expectations and their relation to inflation expectations by providing a novel documentation of the year-ahead debt-growth expectations series from the Federal Reserve Bank of New York’s Survey of Consumer Expectations (SCE).2 We focus on the years before, during, and after the pandemic recession, from January 2015 through April 2025. We divide our investigation into three parts: (i) an analysis of the time series dynamics, the effect of the pandemic, and its comparison to observed debt growth; (ii) a breakdown of debt-growth expectations across the household income distribution; and (iii) a comparison with the 12-month-ahead inflation expectations measure from the SCE.
We find that mean year-ahead debt-growth expectations are, on average, higher than the realized trailing debt growth. Such expectations experienced a sharp rise immediately during the pandemic recession and remained high in comparison to the prepandemic average through 2021, when we observed high actual debt growth, returning to levels closer to the prepandemic standard by the end of 2024. We also find that consumers in the bottom 40 percent of the total household income distribution consistently expect higher debt growth than consumers in the middle 40 percent and top 20 percent.3 In fact, the expectations of the bottom 40 percent are, on average, 60 percent higher than those of the top 20 percent in the years before the pandemic. Mean debt-growth expectations have risen for all three groups during the pandemic recession, but they remained higher for longer for the bottom 40 percent.
We also study the association between year-ahead debt-growth expectations and 12-month-ahead inflation expectations in the SCE. Inflation expectations are widely used in economic analysis and are shown to be an important driver of consumers’ economic decisions (Weber et al., 2022; Hajdini et al., 2023, 2025). Using a simple regression analysis, we find that both measures are positively and significantly correlated, with distinct patterns for the pre- and post-pandemic-recession time periods. When we break down the sample by income groups, we observe a positive and mostly significant association for all groups and a stronger correlation and explanatory power for consumers in the bottom 40 percent of the household income distribution.
Actual and Expected Debt Growth
Our main data come from the New York Fed’s SCE, for which individuals are surveyed monthly, staying in the sample for a cycle of 12 months. The question about debt-growth expectations is given to respondents that have been interviewed once previously. We start, then, by looking at how the debt-growth expectations data elicited from the SCE compare to realized US debt growth. To do so, in Figure 1 we plot the monthly time series of the mean annual debt-growth expectations for the next 12 months together with the realized trailing 12-month growth rate of outstanding public debt to the penny as reported by the US Treasury.4
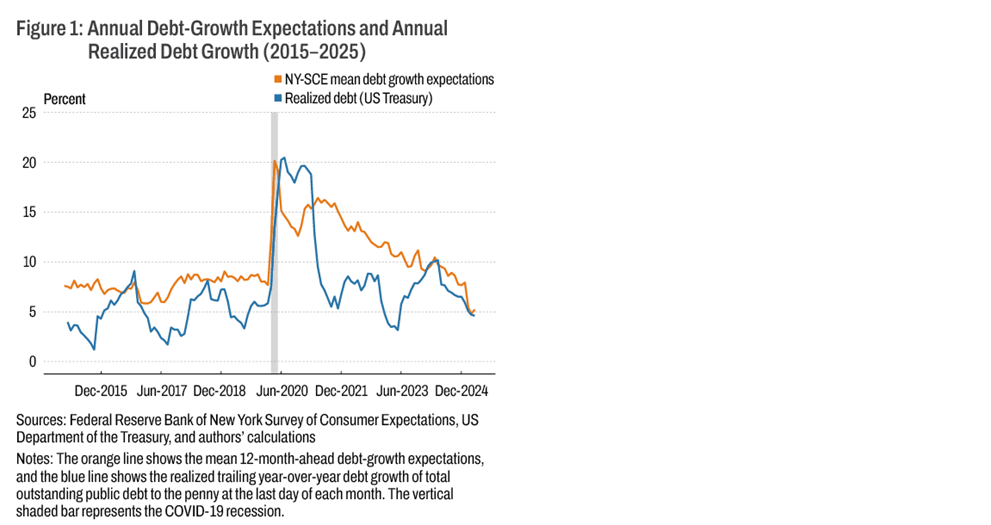
The first key observation from the data is that the US debt year-over-year growth rate hovered around 5 percent until the start of the pandemic recession in 2020, when it increased to close to 20 percent. It then fell off sharply and stayed around 20 percent until mid-2021. After that, year-over-year debt growth returned to a slower pace and moved more similarly to the prepandemic pattern, though with a moderate average level shift, fluctuating around 7 percent and reaching 5 percent at the end of our sample in April 2025.5
Another observation is that consumers’ mean annual debt-growth expectations have usually been higher than the realized trailing debt growth, with the mean about 3 percentage points higher on average than what is observed in the debt growth over the prior 12 months. We can also observe that year-ahead debt-growth expectations are relatively well-behaved, tracking the broad movements of realized debt growth such as the spike observed during the pandemic and the return to a level more consistent with the historical data in the years that followed. Notably, debt-growth expectations tend to exhibit a pattern that reads not too dissimilar to the classic “anchoring” behavior observed in the inflation expectations data: it shows short-term variations at the monthly level but floats around an “anchor” level over longer time horizons.
Debt-Growth Expectations across Income Groups
We take advantage of the microdata of the SCE and document differences in expectations across different demographic cuts and time. In Figure 2, we show the time series for the one-year-ahead mean debt-growth expectations for three different groups based on total household pretax income. We follow the standard of the New York Fed’s economic heterogeneity indicators (EHIs)6 and show expectations for consumers belonging to the bottom 40 percent, the middle 40 percent, and the top 20 percent. We show all data from January 2015 to April 2025.
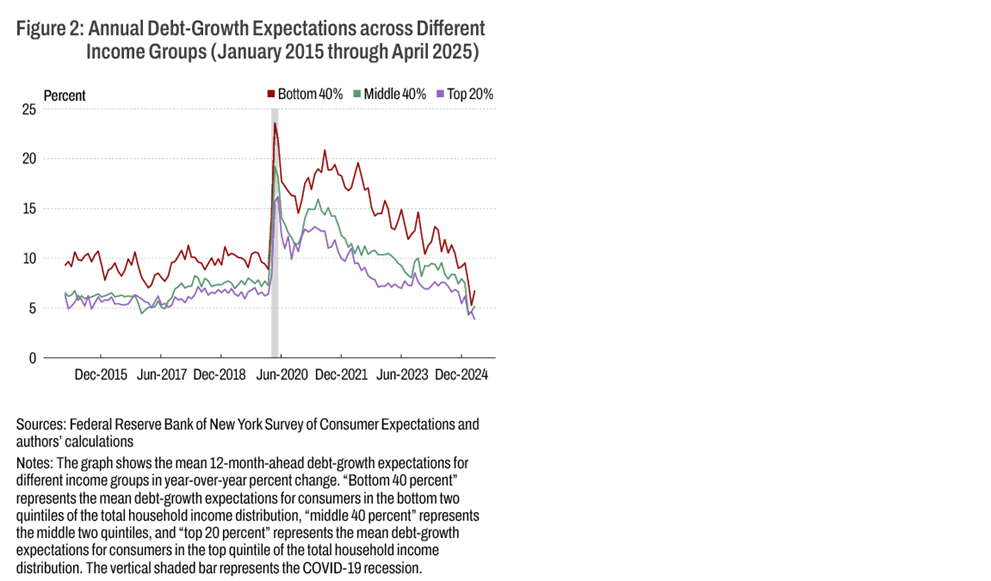
The first pattern that emerges from the data is that before the pandemic, the bottom 40 percent of the income distribution had consistently higher debt-growth expectations than the other two income groups. While the top two groups had mean expectations staying around 5 percent to 7 percent debt growth for a large part of the prepandemic period, the bottom 40 percent was expecting a higher amount of debt growth, with mean rates at around 9 to 10 percent expected by this latter group of consumers for the year ahead.
In April and May of 2020, consumers across all income groups expected higher debt growth, anticipating rates between 15 percent and close to 25 percent depending on the group. For the bottom 40 percent, the expectations remained higher than for the other groups, and they remained around 5 percentage points higher than the pre-pandemic-recession level until the middle of 2022. For the other two groups, the initial decrease was somewhat faster, but the expectations did not fully return to pre-pandemic-recession levels until closer to the end of 2024. A possible explanation for this lagged initial decrease is that individuals in the bottom 40 percent of the income distribution were more likely to have received fiscal stimulus funds and as a result could have perceived higher government spending for a longer period.
Debt-Growth Expectations and Inflation Expectations
We now explore the relationship between consumers’ debt-growth expectations and inflation expectations, as measured by the New York Fed’s SCE. In Figure 3, we show the same measures as shown for the debt-growth expectations in the previous figures, but now for inflation expectations. Figure 3, panel (a) shows the mean 12-month-ahead inflation expectations; Figure 3, panel (b) shows the breakdown across the different income groups, as in the previous figure.
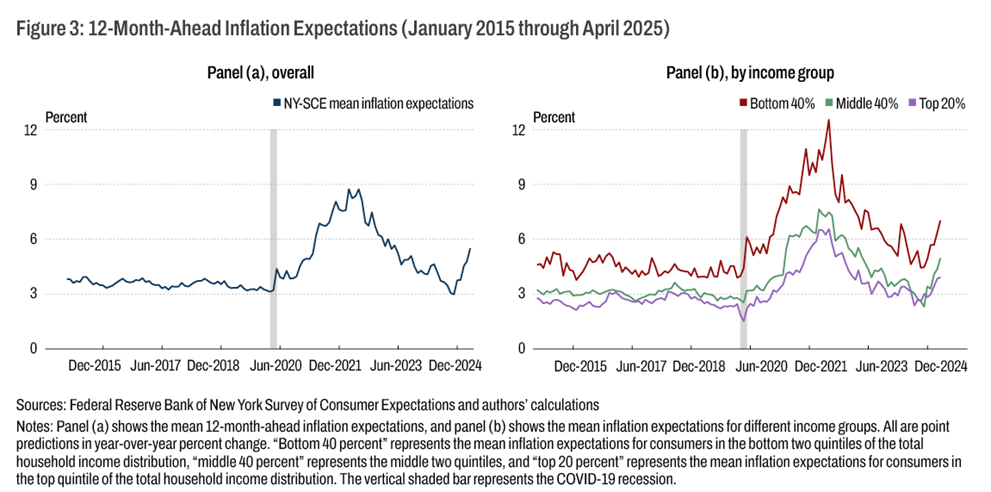
Observing the data, a few similarities are readily apparent: inflation expectations rose in the years during and after the COVID-19 recession and returned to close to their prepandemic levels in 2024. Similarly to what we have seen in the debt-growth series, there is also heterogeneity across income groups in consumers’ expectations for inflation, with lower-income households expecting higher inflation than those at the middle and top of the income distribution.
A key difference is timing: The increase in consumers’ inflation expectations took longer to materialize following the pandemic recession than did government debt-growth expectations. Inflation expectations peaked in March and June 2022, tracking the dynamics of actual inflation as measured by the CPI-U, which peaked in June of that year. Another difference can be found at the end of our sample, during the initial months of 2025, when debt-growth expectations showed a decrease while inflation expectations rose.
We run a linear regression to measure the extent to which the two types of expectations are correlated. Figure 4 shows a simple ordinary least squares (OLS) projection of the mean 12-month-ahead inflation expectation on the mean 12-month-ahead government debt-growth expectation at each month of our sample. The scatter plot of all observations for both variables and the regression line with the associated coefficient, R-squared, and p-value appear in panel (a). We color code it, dividing the observations into pre-, during, and post-pandemic-recession groups. We run separate regressions for the pre and post time blocks, depicting these in the other two panels, with panel (b) encompassing the pre-pandemic-recession period and panel (c) the post-pandemic-recession period.
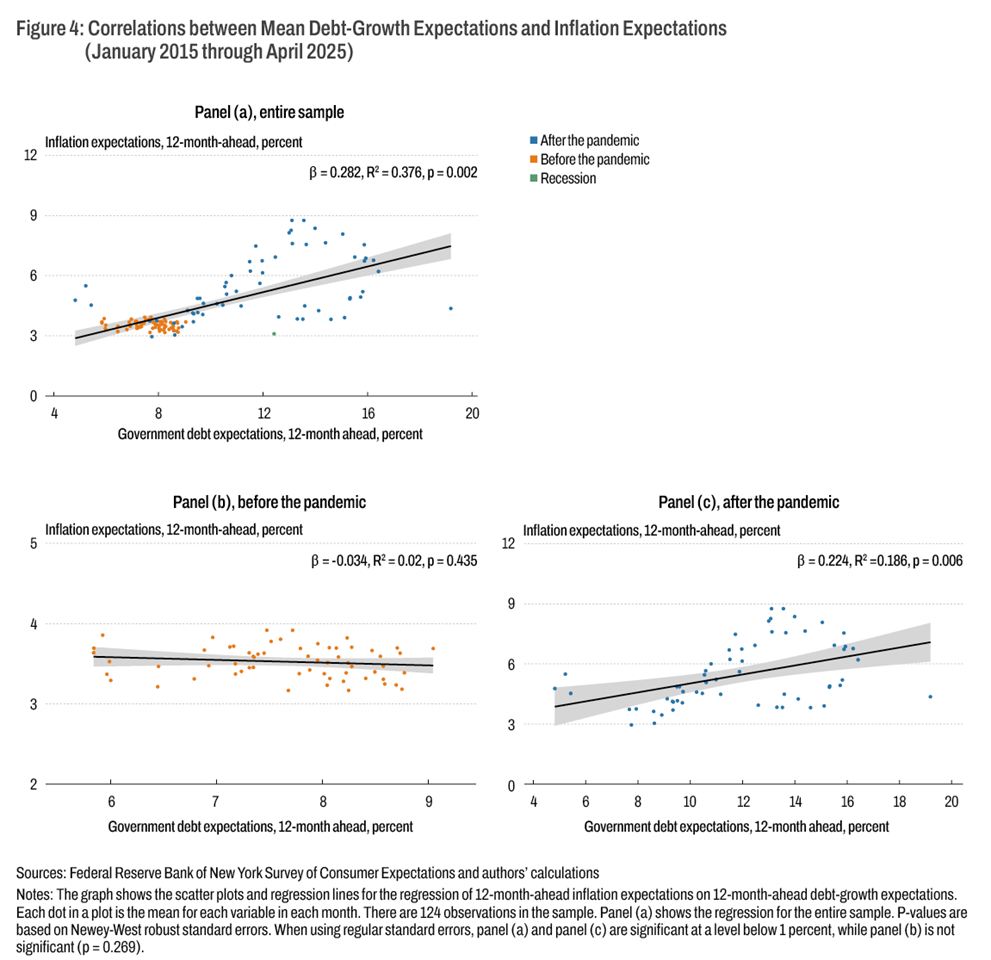
We observe in the regression analyses that government debt-growth expectations and inflation expectations are positively correlated at a statistically significant level and that, when we consider the entire sample, the variation in debt-growth expectations provides a solid amount of explanatory power for the variation in inflation expectations. When dividing the sample into pre- and post-pandemic-recession periods, the correlation remains positive and significant for the post-pandemic period, but the explanatory power is reduced. The regression for the pre-pandemic-recession period shows a small negative correlation with little explanatory power and significance, indicating that the pandemic played a key role in generating the time series association between these two variables. This pattern provides a cautionary note for the analysis as it shows that it is important to pay attention to the effects of cycles in this association.
Finally, we can further explore heterogeneity across the income distribution in the correlations between government debt-growth expectations and inflation expectations. In Figure 5, we repeat the same style of analysis of the previous chart but with a sample divided into the three income groups previously identified. Figure 5, panel (a) shows the regression analysis for the bottom 40 percent, panel (b) the middle 40 percent, and panel (c) the top 20 percent of the total household income distribution.
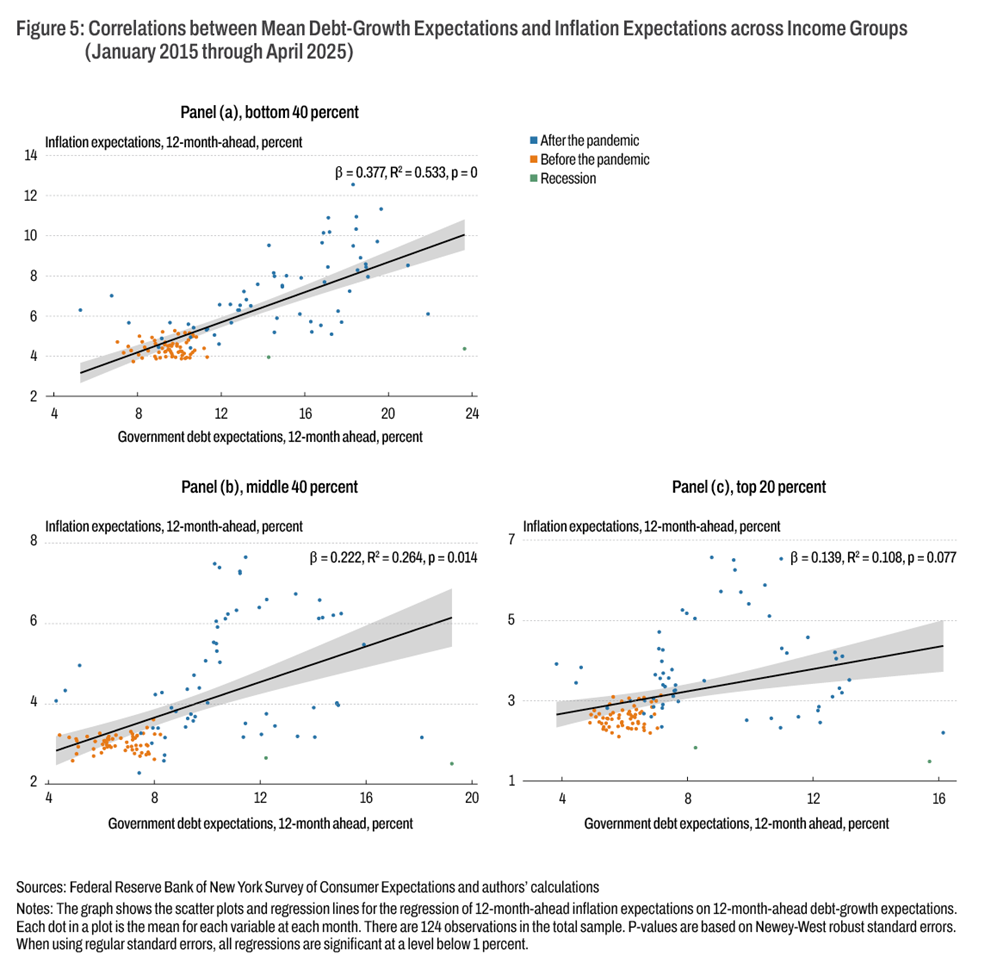
We observe that the two expectations continue to show a positive and mostly significant correlation, largely during the post-pandemic-recession period, with a solid explanatory power as measured by the R-squared of the regressions. We also find that the strength of the correlation decreases as we move up the income ladder, with both the magnitude of the coefficient and the R-squared decreasing between the bottom 40 percent and the top 20 percent. More clearly, the bottom 40 percent shows a stronger correlation and significance, yielding an explanatory power of more than 50 percent of the variation of inflation expectations. This echoes the analysis observed in the time series, in which we have observed that the bottom 40 percent had both higher debt-growth and higher inflation expectations, but also that debt-growth expectations remained higher than the expectations in the pre-pandemic-recession period for longer than was the case for the other groups.
Conclusion
In this Economic Commentary, we analyze the New York Fed’s SCE data on consumers’ debt-growth expectations over time and across the income distribution and their association with inflation expectations. We find that year-ahead debt-growth expectations are, on average, higher than the realized debt growth and that such expectations experienced an increase in the post-pandemic-recession years as actual debt growth increased, before returning to closer to prepandemic levels by the end of 2024. We also find that consumers in the bottom 40 percent of the total household income distribution expected higher debt growth than consumers in the middle 40 percent and the top 20 percent, with readings, on average, about 60 percent higher than those of the latter group during the prepandemic years. We compare debt-growth expectations with 12-month-ahead inflation expectations and find that they are positively and significantly correlated in the post-pandemic recession period, with a stronger association for consumers in the bottom 40 percent of the household income distribution.
References
- Armantier, Olivier, Giorgio Topa, Wilbert Van der Klaauw, and Basit Zafar. 2016. “An Overview of the Survey of Consumer Expectations.” Staff Report No. 800. Federal Reserve Bank of New York. newyorkfed.org/research/staff_reports/sr800.html.
- Bandeira, Miguel, Marco Bonomo, Carlos Carvalho, and Marcos Mendes. 2025. “Contractionary Fiscal Stimulus (and Expansionary Austerity).” 2025 BFI-Insper Conference, October 24. drive.google.com/file/d/111FG6W0ek9Er210-61YQUiDOJnhF-42M/view.
- Bianchi, Francesco, Era Dabla-Norris, and Salma Khalid. 2025. “Perceptions of Public Debt and Policy Expectations: Evidence from Cross Country Surveys.” Working Paper No. 34382. National Bureau of Economic Research. doi.org/10.3386/w34382.
- Chakrabarti, Rajashri, Dan Garcia, and Maxim Pinkovskiy. 2024. “Economic Heterogeneity Indicators.” Federal Reserve Bank of New York. newyorkfed.org/research/economic-heterogeneity-indicators.
- Coibion, Olivier, and Yuriy Gorodnichenko. 2025. “Inflation, Expectations and Monetary Policy: What Have We Learned and to What End?” Working Paper No. 33858. National Bureau of Economic Research. doi.org/10.3386/w33858.
- Coibion, Olivier, Yuriy Gorodnichenko, and Michael Weber. 2021. “Fiscal Policy and Households’ Inflation Expectations: Evidence from a Randomized Control Trial.” Working Paper No. 28485. National Bureau of Economic Research. doi.org/10.3386/w28485.
- Collin Eldridge and Miguel Faria-e-Castro. 2026. “Inflation and the Accuracy of Public Debt Forecasts,” St. Louis Fed on the Economy (February). stlouisfed.org/on-the-economy/2026/feb/inflation-accuracy-public-debt-forecasts.
- Congressional Budget Office (CBO). 2024. “An Evaluation of CBO’s Projections of Deficits and Debt From 1984 to 2023.” cbo.gov/publication/60664.
- Congressional Budget Office (CBO). 2026. “Evaluating CBO’s Projections of Components of the Federal Budget.” GitHub, January. github.com/US-CBO/eval-projections.
- Grigoli, Francesco, and Damiano Sandri. 2024. “Public Debt and Household Inflation Expectations.” Journal of International Economics 152 (November): 104003. doi.org/10.1016/j.jinteco.2024.104003.
- Hajdini, Ina, Edward S. Knotek II, John Leer, Mathieu Pedemonte, Damjan Pfajfar, Raphael S. Schoenle, and Taylor Shiroff. 2025. “Consumer Inflation Expectations Across Surveys and over Time.” Economic Commentary, no. 2025-07 (August). doi.org/10.26509/frbc-ec-202507.
- Hajdini, Ina, Edward S. Knotek II, John Leer, Mathieu Pedemonte, Robert W. Rich, and Raphael S. Schoenle. 2023. “Low Passthrough from Inflation Expectations to Income Growth Expectations: Why People Dislike Inflation.” Working Paper No. 22-21R. Federal Reserve Bank of Cleveland. doi.org/10.26509/frbc-wp-202221r.
- Kollar, Melissa, and Zach Scherer. Income in the United States: 2024. Current Population Reports P60-286. Washington DC: US Census Bureau, September 2025. https://www2.census.gov/library/publications/2025/demo/p60-286.pdf.
- Reis, Ricardo. 2026. “Why Did Inflation Rise and Fall in 2021-24? Channels and Evidence from Expectations.” CEPR Discussion Paper No. 21277. Paris and London: CEPR Press. cepr.org/publications/dp21277.
- Roth, Christopher, Sonja Settele, and Johannes Wohlfart. 2022. “Beliefs about Public Debt and the Demand for Government Spending.” Journal of Econometrics 231(1): 165–187. doi.org/10.1016/j.jeconom.2020.09.011.
- US Treasury Fiscal Data. 2025. “Debt to the Penny.” fiscaldata.treasury.gov/datasets/debt-to-the-penny/debt-to-the-penny.
- Weber, Michael, Francesco D’Acunto, Yuriy Gorodnichenko, and Olivier Coibion. 2022. “The Subjective Inflation Expectations of Households and Firms: Measurement, Determinants, and Implications.” Journal of Economic Perspectives 36(3): 157–184. doi.org/10.1257/jep.36.3.157.
Endnotes
- Bianchi et al. (2025) extend the analysis of Roth et al. (2022) for the United States to 13 developed economies, including that of the United States. For research on professional forecasters’ fiscal expectations at a daily frequency in the case of Brazil, see Bandeira et al. (2025). For recent research connecting different sources of expectations to inflation, see Reis (2026). Return to 1
- For details on the survey, see Armantier et al. (2016). Return to 2
- We use questions from the SCE to approximate consumers’ positions as being in the bottom 40 percent, the middle 40 percent, or the top 20 percent of the income distribution. The SCE questionnaire asks the respondent to choose among 11 ordered income bins for total pretax income of all members of the household who are 15 years of age or older. We approximate the bottom 40 percent of the income distribution as incomes at or below bin 6; the middle 40 percent as incomes in bins 7, 8, and 9; and the top 20 percent as incomes in bins 10 and 11. A consumer assigned in our sample to the bottom 40 percent reported income at or below US$59,999, and a consumer in the top 20 percent reported income above US$150,000. Our classification uses as reference the calculation of the US Census based on the Current Population Survey Annual Social and Economic Supplements (CPS ASEC), which reports that in 2015 the 40th percentile of income was US$56,040 and that the 80th percentile of income was US$150,700 in 2024 dollars (Kollar and Scherer, 2025). Return to 3
- Across the main text, we use the mean instead of the more common median for summarizing the value in each month of our sample for both debt-growth expectations and inflation expectations. We follow Coibion and Gorodnichenko (2025), who mention that the Huber-robust mean helps reconcile the SCE with the Michigan Survey of Consumers (MSC). Additionally, the mean exhibits more variation than the median for the inflation series that will be used later in our analysis. Before applying the Huber trimming, we remove outlier observations for both expectations that are above 1,000 percent or below -1,000 percent. This excludes 19 observations from the raw data. In the appendix, we show in Figure A.1 the time series for our calculated measure of inflation expectations in comparison with the regularly reported inflation expectations by the New York Fed. Return to 4
- In Figure A.2 in the appendix, we show the annual realized trailing debt year-over-year growth rate in comparison to the CBO’s projections (Congressional Budget Office, 2024, 2026). We observe that the projections closely track the observed data. In a recent analysis, Collin and Faria-e-Castro (2026) find a negative association between public debt-to-GDP forecast errors by the CBO and the annual inflation rate. Return to 5
- See Chakrabarti et al. (2024). In the appendix, we show in Figure A.3 similar plots to the ones in Figures 2 and 3 using the median as the summary statistic. Return to 6
Suggested Citation
Luduvice, André Victor D., and Christopher J. Walker. 2026. “How do Consumers View Future Government Debt? A Primer on Debt-Growth Expectations.” Federal Reserve Bank of Cleveland, Economic Commentary 2026-16. https://doi.org/10.26509/frbc-ec-202616
This work by Federal Reserve Bank of Cleveland is licensed under Creative Commons Attribution-NonCommercial 4.0 International


Related resources

About Us
The Federal Reserve Bank of Cleveland (commonly known as the Cleveland Fed) is part of the Federal Reserve System, the central bank of the United States.

Economic Commentaries
Economic Commentaries provide analysis of relevant economic issues and are written for an informed but nonspecialist audience.