

- Share
Did Inflation Affect Households Differently? A Look at the Postpandemic Inflation and Wage Growth Dynamics
We analyze the heterogeneous effects of postpandemic inflation and disinflation by inspecting inflation and wage growth experienced across quintiles of household income and wage distributions. We find that after inflation peaked in June 2022, households and workers in the bottom 40 percent of the income and wage distributions have consistently experienced both higher inflation and higher wage growth when compared to the middle 40 and top 20 percent of these distributions. Comparing the cumulated growth of both variables, we observe that the bottom and middle 40 percent reach the end of 2024 with 4.5 percentage points more of cumulated wage increase than inflation since January 2019, while the top 20 percent ended the same period with close to 3.5 percentage points of increase in their cumulated purchasing power.
Replication materials for this Economic Commentary may be found at github.com/avdluduvice/LuduviceTruss-WilliamsWalker_InfWageGrowth.

The views authors express in Economic Commentary are theirs and not necessarily those of the Federal Reserve Bank of Cleveland or the Board of Governors of the Federal Reserve System. The series editor is Tasia Hane. This paper and its data are subject to revision; please visit clevelandfed.org for updates.
Introduction
The postpandemic period saw a rise in inflation not seen in over 40 years, with the consumer price index (CPI) hitting a 12-month percent change of nearly 9 percent in June 2022. After inflation reached this peak, the US economy entered a period of disinflation, and CPI inflation declined to a 12-month percent change close to 3 percent in late 2023 and through the first half of 2024. At the same time, wage growth increased from a prepandemic annual rate of around 3.5 percent to a postpandemic high of more than 6 percent. It remained at similar rates past the inflation peak of June 2022 and the start of disinflation, resulting in a period during which wage growth outpaced price growth.
However, households belonging to different income groups have not experienced these inflation and wage growth dynamics in a similar manner. Regarding inflation, the typical household’s basket of goods and services—on which the CPI is measured—differs across the income distribution, with low-income households spending a larger share of their income on housing and food than middle- and high-income households (Jaravel, 2021, 2024; Chakrabarti et al., 2023, 2024). These two categories, housing and food, contributed significantly to the rise in inflation in the aftermath of the pandemic, with housing inflation rising at the end of 2022 as food prices cooled from their peak (De Soyres et al., 2024; Horwich, 2024). Regarding wages, low-wage workers have experienced higher-than-usual real wage growth, that is, wage growth adjusted for inflation, in the postpandemic recovery than in previous business cycles (Gould and DeCourcy, 2024; Venkatu, 2024), while workers at the median and top deciles of the wage distribution saw their real wages decrease (Autor et al., 2024).1
In this Economic Commentary, we investigate the varied effects of postpandemic inflation dynamics by analyzing the inflation and wage growth experienced across the income distributions from 2019 through December 2024. We divide our study into three parts: (i) assessment of the inflation heterogeneity as measured by the time series of the “research CPI by equivalized income quintiles” index (R-CPI-I) from the Bureau of Labor Statistics; (ii) an equivalent analysis for the wage growth across the quintiles of the wage distribution following the standard of the Atlanta Fed wage growth tracker; and (iii) bridging of the gap between wage and income distributions by calculating wage gains across labor earnings and computing an approximation of the gains and losses of purchasing power.
We observe that, starting at the outset of the pandemic and more clearly after the peak of inflation in June 2022, households at the bottom 40 percent of the income distribution experienced higher inflation than the average household represented in the headline inflation. The gap between headline inflation—that is, total inflation as measured by the CPI-U, which we also refer to as overall inflation—and the inflation rate for those in the bottom quintile has persisted through late 2022 and the first half of 2024, fluctuating between 0.25 percentage points (pp) and 0.50 pp. Households at the top 20 percent, on the other hand, show the converse pattern. The gap for the top 20 percent oscillated around −0.25 pp in the first couple of years after the pandemic, narrowing closer to zero as headline inflation cooled in late 2023 and 2024.
We also show that wage growth was robust across all wage-level quintiles during the postpandemic period. The bottom 40 percent of the wage distribution experienced high absolute and relative wage growth, showing annual rates of more than 7 percent at its peak during this period. In late 2022 and early 2023, growth for this group was around 1 pp above the median wage growth and close to 3 pp above growth for those in the top 20 percent of the wage growth distribution.
Equipped with the time series by income groups, we are then able to compare the rise in prices and wages across income distributions and construct an approximate measure of cumulated purchasing power that takes into account group-experienced inflation. Those in the bottom 40 percent of the wage distribution recovered their purchasing power during the disinflation period, reaching the end of 2024 with around 4.5 pp more of cumulated wage increases than inflation since 2019. The top 20 percent, despite living through almost a year of erosion of their purchasing power between late 2022 and mid-2023, ended the same period with close to 3.5 pp of increase in their cumulated purchasing power.
Inflation Heterogeneity
We start our analysis of inflation’s impact on households by looking at inflation heterogeneity and comparing it to headline inflation. To do so, we use the BLS version of the CPI designed to measure the inflation experienced by households across the income distribution, the R-CPI-I.2 This index calculates the CPI by equivalized income quintiles adjusted for household size.3,4
In Figure 1, we plot the time series of the R-CPI-I and the headline CPI from January 2019 to December 2024. We show the 12-month percentage change, capturing inflation at annual rates. To make it easier to visualize the differences across income groups, we follow the Federal Reserve Bank of New York’s economic heterogeneity indicators (EHIs) standard and bundle the bottom two quintiles into the bottom 40 percent, the two middle quintiles into the middle 40 percent, and the top quintile remains the top 20 percent.
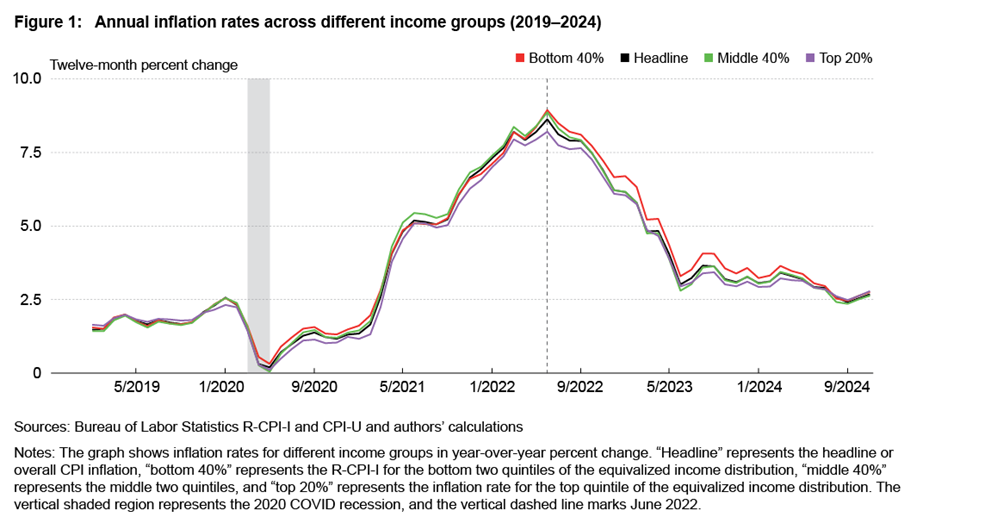
The graph shows the trajectory of inflation before and after the COVID-19 pandemic. In the aftermath of the recession, inflation immediately decreased, achieving levels close to zero around April of 2020, and started its steep increase at the end of 2020 until its peak, around 9 percent, in June 2022. After that, inflation started to steadily decrease throughout 2022 until mid-2023, reaching rates closer to 3 percent and gravitating around this level through the end of 2023 and the first half of 2024.
We can observe that prior to 2020, each income group experienced similar levels of inflation to that of the overall economy as captured by headline inflation, with the top 20 percent being a few tenths of a percentage point below headline at the end of 2019 and after inflation reaches its trough in 2020. After inflation climbs to its peak, a clearer ranking emerges: following the mid-2022 interest rate hikes and subsequent disinflation, the top 20 percent and the middle 40 percent narrowed toward one another during the disinflation cycle and got closer to headline inflation, while the bottom 40 percent experienced higher inflation than the overall economy for almost the entirety of this period, getting closer to that level after the first half of 2024.5
To better visualize the differences in inflation experienced by each of the three income groups, we compute the difference between each group’s inflation and the headline inflation. Doing so generates an inflation gap measured in percentage points, as shown in Figure 2.
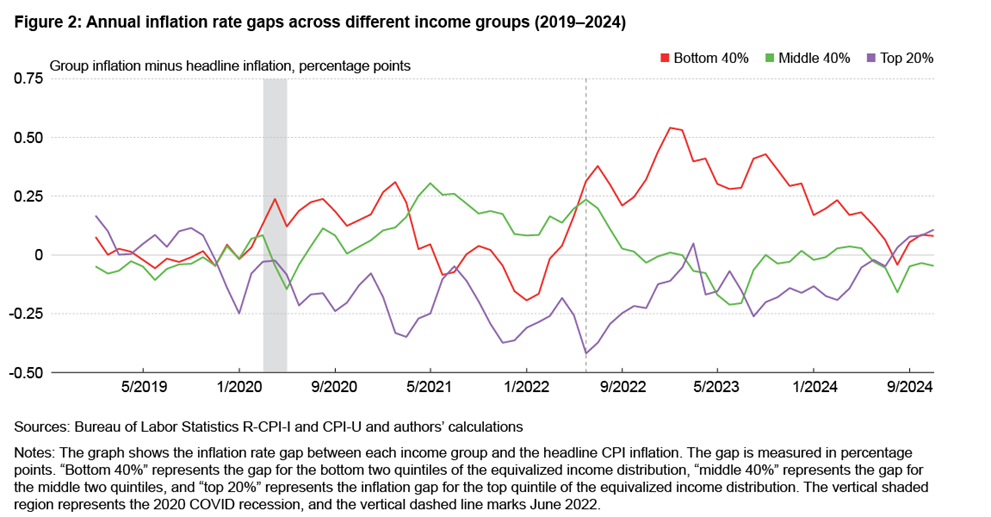
Before the pandemic, the gaps between individual income quintiles and headline inflation did not surpass 0.25 pp, fluctuating around zero. After the recession, they begin to diverge before eventually coming back together later in the disinflation period. The top 20 percent exhibits a descending trajectory starting in the second quarter of 2020 and stays on this trajectory until the inflation peak in June 2022, when the trend reverts. The bottom 40 percent income group displays a more volatile—and often positive—gap through 2020 and then it begins moving steadily higher in early 2022, reaching its peak one year later in 2023. This group experienced roughly 0.50 pp more inflation than other income groups from the end of 2022 until 2024. As disinflation proceeded, the gaps across groups narrowed, and by mid-2024 they were roughly similar to their prepandemic behavior.
Wage Growth Heterogeneity
During the recovery from the 2020 recession, there were not only high inflation rates, but there was also high nominal wage growth for many American workers. To understand the effects of inflation on standards of living across income groups during this period, it is critical to gauge how each group’s wages fared during the inflation and disinflation periods around and related to the pandemic. We organize the data following the standard of the Federal Reserve Bank of Atlanta’s wage growth tracker (WGT), documenting the median percent change in the hourly wage of individuals observed 12 months apart in the Current Population Survey (CPS), reconstructing the WGT measures divided into quintiles of the wage distribution, and bundling them into the groups used by the EHIs.6
In Figure 3, we plot the 12-month moving average of median wage growth for the different groups from January 2019 to December 2024.
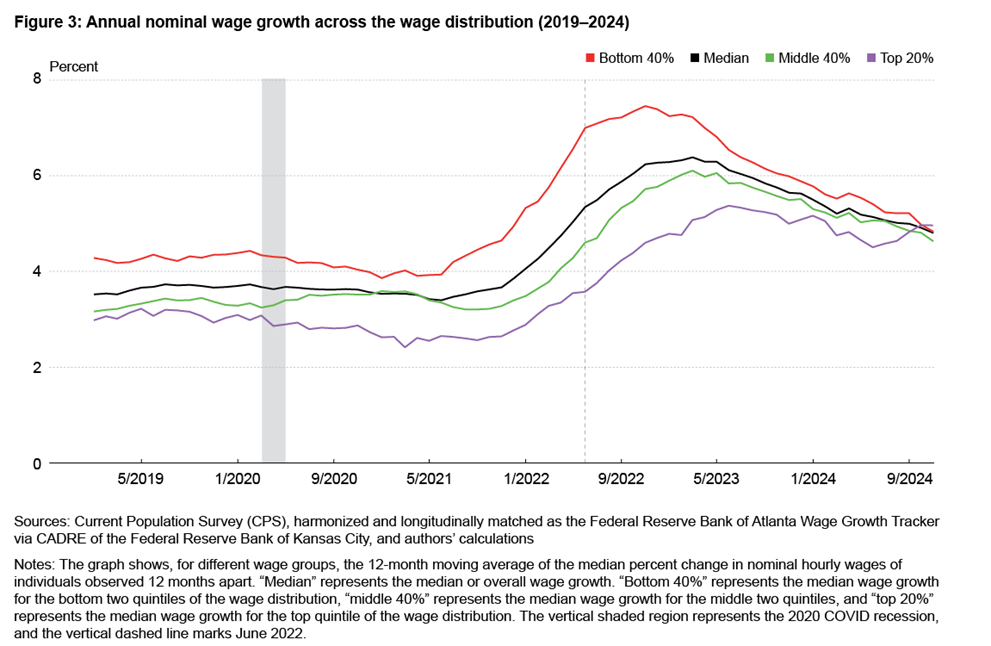
Prior to the pandemic, the bottom 40 percent experienced higher wage growth than the other groups, with the middle 40 and top 20 percent witnessing smaller growth than the median. Workers at the top quintile of the wage distribution exhibited the lowest growth across all quintiles. This relative ranking of individual wage growth remained the same through postpandemic inflation and disinflation, only changing in the last two months of our sample.
Despite experiencing disproportionately high inflation during the postpandemic disinflation period, the bottom 40 percent have also experienced high absolute and relative wage growth. Starting in late 2021, the distance between the growth rates for this group and the median wage growth starts to increase, achieving its highest value in the third quarter of 2022. After mid-2023, the distance starts narrowing, eventually becoming smaller than its prepandemic level, with a rank switch at the very end of 2024. The middle 40 percent of the wage distribution experienced a wage growth dynamic that hews more closely to the median wage growth, while the top 20 percent showed a smoother path of increase and decline after the inflation peak of 2022.7
Heterogeneity in Purchasing Power
Our analysis of both inflation and wage growth by quintiles of the income and wage distributions indicates that postpandemic inflation dynamics generated varied effects for individuals in different positions along both distributions. To understand what happened to households’ purchasing power during this period, we approximate the changes in purchasing power across groups by computing the net result of the wage growth and inflation trajectories in the period for each group.
The variables analyzed are divided in quintiles of different distributions, equivalized income and wages, respectively; and to construct an approximate notion of purchasing power that subtracts one from the other, we need to “harmonize” these concepts. To do so, we take three steps: (i) using the same sample of the WGT, we compute household-level earnings by multiplying hourly wages by weekly hours worked and summing this across all adults in a household; (ii) we then equivalize it by dividing it by the square root of the household size; and (iii) we order households across the equivalized household weekly earnings distribution. We then compute individual wage growth in the same way as before, following the WGT standard.8
In Figure 4 we show our approximate measure of purchasing power separated into the same groups previously mentioned, month by month, from January 2019 to December 2024.9
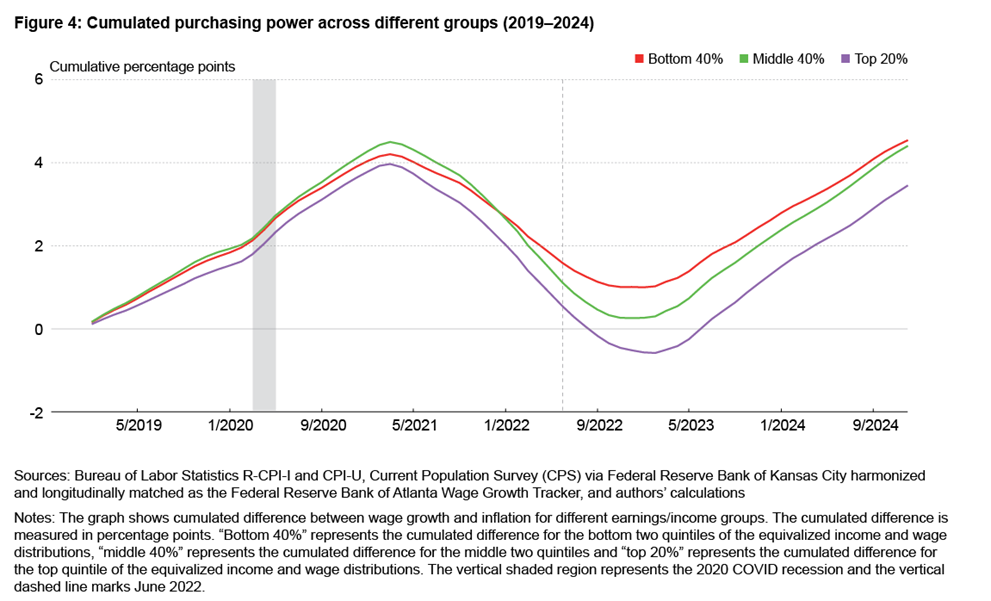
In doing so, we can observe that before the 2020 recession and until the first quarter of 2021, our approximate measure of purchasing power was increasing for all groups, with the bottom 40 and middle 40 percent tracking each other closely and the top 20 percent sitting below the other two groups. The cumulated purchasing power peaks for all groups around the end of the first quarter of 2021, starting to decrease as inflation climbs to its June 2022 high. The decline in cumulated purchasing power lasts for about two years, reaching its low at the beginning of 2023, when the lagged wage growth starts to counterbalance the erosion of purchasing power caused by inflation.
Once inflation starts reaching levels of around 3 percent at the end of 2023 while wages continue growing at nearly 6 percent on an annual basis, the cumulated purchasing power for all groups reaches another inflection point and starts increasing again, ending 2024 with around 4.5 pp more of cumulated wage increase than inflation for the bottom and middle groups and close to 3.5 pp for the top 20 percent group. Notably, starting in late 2022, the top 20 percent group shows an erosion of purchasing power when compared to its purchasing power in 2019, staying at negative values for around one year before starting to show cumulative positive values again.
Conclusion
In this Economic Commentary, we analyzed the postpandemic dynamics of inflation and wage growth across income and wage distributions. We find that households at the bottom 40 percent of the income and wage distributions have consistently experienced both higher inflation and higher wage growth when compared to those in the middle 40 and top 20 percent of the same distributions. We find that this pattern became more consistent after inflation began falling in June 2022, with the lagged behavior of wage growth yielding a period when wages outpaced inflation for households in the bottom 40 percent. We then construct an approximate measure of cumulated purchasing power and observe that the bottom 80 percent of the income distribution reach the end of 2024 with around 4.5 pp of cumulated increase in purchasing power, while the top 20 percent ended the same period with close to 3.5 pp of cumulated purchasing power.
References
- Autor, David H., Arindrajit Dube, and Annie McGrew. 2024. “The Unexpected Compression: Competition at Work in the Low Wage Labor Market.” Working Paper 31010. National Bureau of Economic Research. doi.org/10.3386/w31010.
- Carroll, Daniel R., and Christopher J. Walker. 2025. “Compression in the Wage Distribution during the Post-Covid-19 Labor Market.” Economic Commentary, no. 2025-06 (April). doi.org/10.26509/frbc-ec-202506.
- Chakrabarti, Rajashri, Dan Garcia, and Maxim Pinkovskiy. 2023. “Inflation Disparities by Race and Income Narrow.” Liberty Street Economics (blog). Federal Reserve Bank of New York. January 18, 2023. libertystreeteconomics.newyorkfed.org/2023/01/inflation-disparities-by-race-and-income-narrow/.
- Chakrabarti, Rajashri, Dan Garcia, and Maxim Pinkovskiy. 2024. “Economic Heterogeneity Indicators.” Federal Reserve Bank of New York. newyorkfed.org/research/economic-heterogeneity-indicators.
- Coibion, Olivier, Yuriy Gorodnichenko, and Dmitri Koustas. 2021. “Consumption Inequality and the Frequency of Purchases.” American Economic Journal: Macroeconomics 13(4): 449–482. doi.org/10.1257/mac.20190115.
- Congressional Budget Office. 2021. “The Distribution of Household Income, 2018.” Report. cbo.gov/publication/57061.
- Cowles, Ken, Jeff Horwich, and Abigail Wozniak. 2024. “Is Wage Growth Sustainable? Evidence from Real Wage Growth across Groups.” Federal Reserve Bank of Minneapolis. minneapolisfed.org/article/2024/is-wage-growth-sustainable-evidence-from-real-wage-growth-across-groups.
- Gould, Elise, and Katherine deCourcy. 2024. “Fastest Wage Growth over the Last Four Years among Historically Disadvantaged Groups.” Economic Policy Institute. epi.org/279904.
- Hobijn, Bart, and David Lagakos. 2005. “Inflation Inequality in the United States.” Review of Income and Wealth 51(4): 581–606. doi.org/10.1111/j.1475-4991.2005.00170.x.
- Horwich, Jeff. 2024. “Lower Income, Higher Inflation? New Data Bring Answers at Last.” Federal Reserve Bank of Minneapolis. minneapolisfed.org/article/2024/lower-income-higher-inflation-new-data-bring-answers-at-last.
- Jaravel, Xavier. 2019. “The Unequal Gains from Product Innovations: Evidence from the US Retail Sector.” The Quarterly Journal of Economics 134(2): 715–783. https://doi.org/10.1093/qje/qjy031.
- Jaravel, Xavier. 2021. “Inflation Inequality: Measurement, Causes, and Policy Implications.” Annual Review of Economics 13(1): 599–629. doi.org/10.1146/annurev-economics-091520-082042.
- Jaravel, Xavier. 2024. “Distributional Consumer Price Indices.” Working paper. xavierjaravel.com/_files/ugd/bacd2d_cad793ba0cde4e8984de41044d08346d.pdf.
- Jayashankar, Aparna, and Anthony Murphy. 2023. “High Inflation Disproportionately Hurts Low-Income Households.” Dallas Fed Economics (blog). Federal Reserve Bank of Dallas. January 10, 2023. dallasfed.org/research/economics/2023/0110.
- Kaplan, Greg, and Sam Schulhofer-Wohl. 2017. “Inflation at the Household Level.” Journal of Monetary Economics 91(November):19–38. doi.org/10.1016/j.jmoneco.2017.08.002.
- Klick, Joshua, and Anya Stockburger. 2024. “Examining US Inflation across Households Grouped by Equivalized Income.” Monthly Labor Review, July. US Bureau of Labor Statistics. doi.org/10.21916/mlr.2024.12.
- McGranahan, Leslie, and Anna Paulson. 2005. “Constructing the Chicago Fed Income Based Economic Index – Consumer Price Index: Inflation Experiences by Demographic Group: 1983–2005.” Working paper 2005-20. Federal Reserve Bank of Chicago. chicagofed.org/publications/working-papers/2005/2005-20.
- OECD. 2013. OECD Framework for Statistics on the Distribution of Household Income, Consumption and Wealth. doi.org/10.1787/9789264194830-en.
- Orchard, Jacob. 2024. “Cyclical Demand Shifts and Inflation Inequality.” Working paper. jakeorchard.github.io/papers/Orchard_JMP_cyclical_ds.pdf.
- de Soyres, François, Grace Lofstrom, Mitch Lott, Chris Machol, and Zina Saijid. 2024. “Disinflation Progress: A Comparison of Advanced Economies.” FEDS Notes, August. Board of Governors of the Federal Reserve System. doi.org/10.17016/2380-7172.3576.
- Venkatu, Guhan. 2024. “Lower-Wage Workers in Ohio Have Seen Strong Wage Gains since 2019.” District Data Brief. Federal Reserve Bank of Cleveland. doi.org/10.26509/frbc-ddb-20240903.
Endnotes
- Low-income households also experience higher levels of stress due to inflation than higher income households (Jayashankar and Murphy, 2023). More recently, real wage growth has returned to prepandemic levels, with low-wage workers trailing their pace in 2019 (Cowles et al., 2024). Return to 1
- The R-CPI-I is posted by the BLS in the R-CPI-I and R-C-CPI-I homepage: bls.gov/cpi/research-series/r-cpi-i.htm. The BLS notes that these indices are calculated outside the official production system of the official CPI indices and are at greater risk of calculation errors. In a Monthly Labor Review article of July 2024, the BLS describes some of the limitations as they are subject to several assumptions in their methodology; for example, they do not capture cohort-specific differences (Klick and Stockburger, 2024). Return to 2
- As defined by the BLS, “equivalized income is household income divided by the square root of household size, or the number of ‘equivalent adults’ in a household” (Klick and Stockburger, 2024). For a detailed discussion on equivalization, see chapter 8 of OECD (2013). Return to 3
- There is a large academic and policy literature on inflation heterogeneity. A few examples are Chakrabarti et al. (2023, 2024), Coibion et al. (2021), Hobijn and Lagakos (2005), Jaravel (2019, 2021, 2024), Kaplan and Sam Schulhofer-Wohl (2017), McGranahan and Paulson (2005), and Orchard (2024), among others. Return to 4
- Using the entire time series of the R-CPI-I provided by the BLS (from December of 2005 to December of 2024), we find that the total cumulated inflation decreases monotonically as we move from the bottom quintile (65.6 percent) to the top quintile (57.5 percent) of the equivalized income distribution (Horwich, 2024). The BLS also provides the “chained” version of the index, the R-C-CPI-I, which aims to account for product substitution starting at the same date but for which the last observation is December 2023. For the latter, the gradient between quintiles is steeper, going from 58.1 percent at the bottom quintile to 46 percent at the top quintile. Return to 5
- As the WGT only disaggregates wages by quartiles of wage levels, we need to calculate the quintiles of wage levels to be consistent with the division done in the R-CPI-I data. To do so, we use the Kansas City Fed harmonized variable and longitudinally matched sample of the CPS. The dataset is maintained by the Center for the Advancement of Data and Research in Economics (CADRE) at the Kansas City Fed. Link to their website: kansascityfed.org/. It is important to note that for the R-CPI-I the BLS uses a broader concept of income than wages, which includes all wages and salaries, investment income, transfers, and others. See bls.gov/cex/csxgloss.htm#inc. Return to 6
- For a breakdown of nominal wage growth across job movement status of workers and by different industries during the postpandemic labor market, see Carroll and Walker (2025). Return to 7
- The harmonization, though an improvement upon the original wage distribution, is only an approximation and hence not without caveats: the distribution of household earnings is not identical to the one of household income as the former accounts for only a part of the latter. Labor income, however, accounts for more than 60 percent of the total household income for households outside the top 1 percent (CBO, 2021; Venkatu, 2024). In the appendix, we describe in more detail the calculation of the purchasing power and show in Figures A.5 and A.6 the wage growth across the equivalized household weekly earnings distribution by, respectively, the earnings groups and the disaggregated earnings quintiles. Return to 8
- It is important to note that the calculation and results are dependent on the choice of the starting point of the purchasing power approximation. Return to 9
Suggested Citation
Luduvice, André Victor D., Anaya Truss-Williams, and Christopher J. Walker. 2025. “Did Inflation Affect Households Differently? A Look at the Postpandemic Inflation and Wage Growth Dynamics.” Federal Reserve Bank of Cleveland, Economic Commentary 2025-11. https://doi.org/10.26509/frbc-ec-202511
This work by Federal Reserve Bank of Cleveland is licensed under Creative Commons Attribution-NonCommercial 4.0 International


About Us
The Federal Reserve Bank of Cleveland (commonly known as the Cleveland Fed) is part of the Federal Reserve System, the central bank of the United States.

Center for Inflation Research
The Center for Inflation Research helps policymakers, researchers, industry professionals, and the informed public better understand inflation. Explore commentary, research, and analysis on inflationary trends, and find out about upcoming inflation-related events.