- Share
Lower-Wage Workers in Ohio Have Seen Strong Wage Gains Since 2019
In Ohio, the trend of relatively weak wage growth for lower-wage workers has reversed recently. This has resulted in the lowest wage inequality in more than two decades, with lower-wage workers seeing notably stronger real wage gains during 2019 to 2023 than for others throughout the wage distribution.
The views authors express in District Data Briefs are theirs and not necessarily those of the Federal Reserve Bank of Cleveland or the Board of Governors of the Federal Reserve System. The series editor is Harrison Markel.
Introduction1
Labor income accounts for most of the income of households outside the top 1 percent of income earners.2 As such, changes in labor income are likely to have important implications for living standards. In recent years, there has been growing concern about wage stagnation, notably for lower-wage workers, and the associated implications for income inequality. Indeed, a 2017 report by the Brookings Institution notes that “[w]age inequality has been on the rise over the past several decades.”3 A 2020 Congressional Research Service report further notes that the stagnation of real hourly wages at the lower end of the income distribution has “contributed to an increase in overall income inequality.” The report goes on to say that “Over the 1979-2018 period, real wages at the 10th percentile of the wage distribution grew by only 1.6%, whereas wages at the 50th percentile grew by 6.1% and wages at the 90th percentile grew by 37.6%.”4
Interestingly, relatively weak wage growth for lower-wage workers seems to have reversed recently, a development documented by researchers primarily focused on trends at the national level.5 In Ohio, these trends are also evident, with real wages growing more rapidly at the 10th percentile of the wage distribution than at other parts of the distribution in recent years.6,7 Moreover, real wage gains between 2019 and 2023 at the 10th percentile were more than twice as rapid as they were during the final four years of the previous economic expansion (2015–2019). These developments have reduced wage inequality in Ohio to its lowest levels in more than two decades based on a comparison of wages at the 10th and 90th percentiles.
Analysis
In contrast to the patterns that have generally prevailed through the past several decades, recent real wage growth in Ohio has been strongest for those at the bottom of the wage distribution. Figure 1 presents Ohio’s inflation-adjusted wages at the 10th, 30th, 50th, 70th, and 90th percentiles of the wage distribution for 2000, 2019, and 2023. (For comparison, the same information is also shown for the United States.)
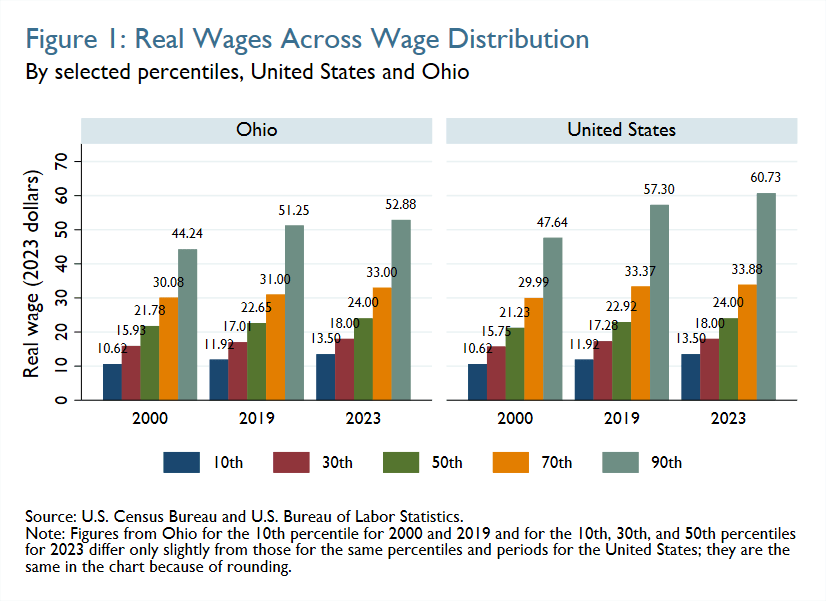
Ohioans at the 10th percentile of the wage distribution earned about $12 per hour in 2019 and $13.50 per hour in 2023. This represents an annual wage increase of 3.2 percent, as shown in Figure 2a. Notably, these increases are after adjusting for inflation.8 By contrast, real wage growth for Ohioans with wages at the 90th percentile during this period was less than 1 percent (0.8 percent) on an average annual basis. Ohioans with wages at other points in the distribution also saw weaker real wage growth between 2019 and 2023 than those at the 10th percentile but stronger growth than those at the 90th percentile. Ohioans at the 30th, 50th, and 70th percentiles of the wage distribution saw average annual real wage gains of around 1.5 percent9 during this period (Figure 2a).
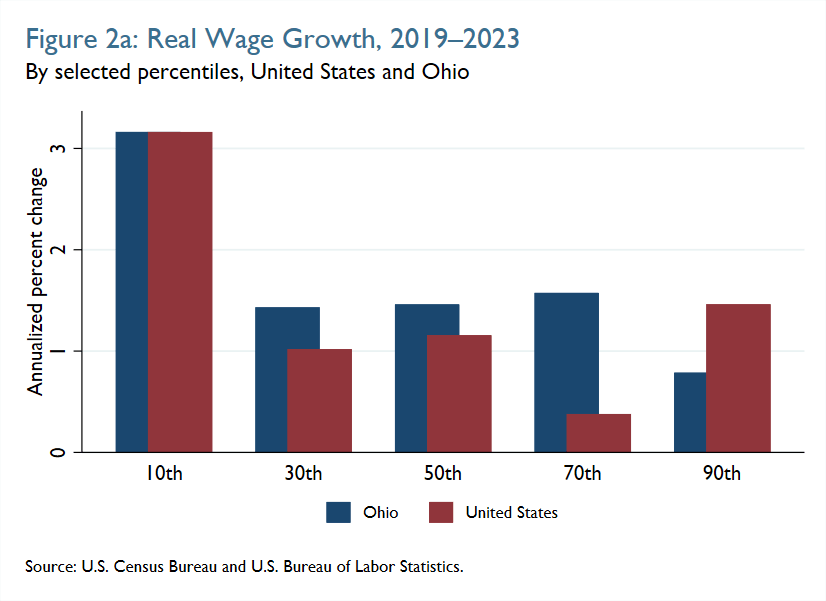
These developments run counter to the pattern that prevailed prior to the pandemic, both in Ohio and nationally. Between 2015 and 2019, real wage gains in Ohio at the 10th percentile of the wage distribution were slightly weaker than at the 90th percentile, although average annual increases in both cases were around 1.5 percent (Figure 2b).
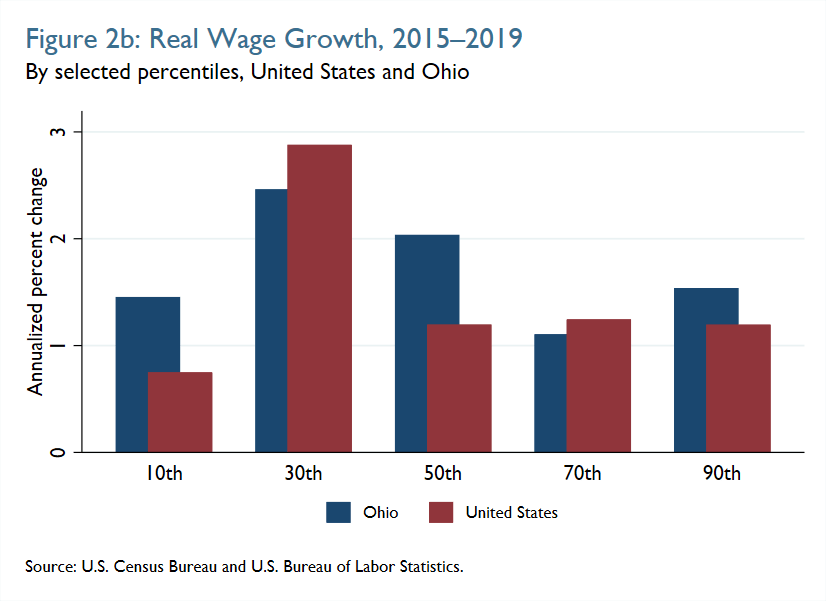
Real wage gains in Ohio at the 10th percentile of the wage distribution were also noticeably weaker than at the 30th and 50th percentiles. Finally, real wage gains in Ohio at the 10th percentile of the wage distribution were substantially weaker between 2015 and 2019—the final four years of the longest economic expansion in US history—than during 2019 to 2023, which included the pandemic and an associated economic contraction.10 The patterns during these two periods for the United States broadly mirror those for Ohio.
What might account for the changing fortunes of lower-wage workers? One possible factor is the increase in minimum wages across states in recent years. Indeed, Ohio’s statutory minimum wage rose from $8.55 in 2019 to $10.10 by 2023, an increase in nominal terms of more than 18 percent. That compares to a far more modest increase of about 5.5 percent between 2015 and 2019 (from $8.10 to $8.55).11 But an analysis of changes in wages across states suggests that wage growth for those at the 10th percentile of the distribution was about as strong in states that did not change their minimum wage during this period as it was in states that did. This suggests that something other than minimum-wage changes explained why lower-wage workers received a boost.12 One study concludes that an abrupt tightening in labor market conditions during the pandemic shifted more market power to workers, particularly lower-wage workers, who consequently became more willing to switch employers, leading to an increase in these workers’ wages.13
Whatever the explanation, recent wage growth differences between the top and bottom quantiles have noticeably reduced wage inequality in Ohio and nationwide. One common way researchers attempt to quantify this inequality is through the 90/10 ratio, the ratio of wages at the 90th percentile to those at the 10th percentile. In Ohio, this wage inequality measure is the lowest it has been in more than 20 years (Figure 3).
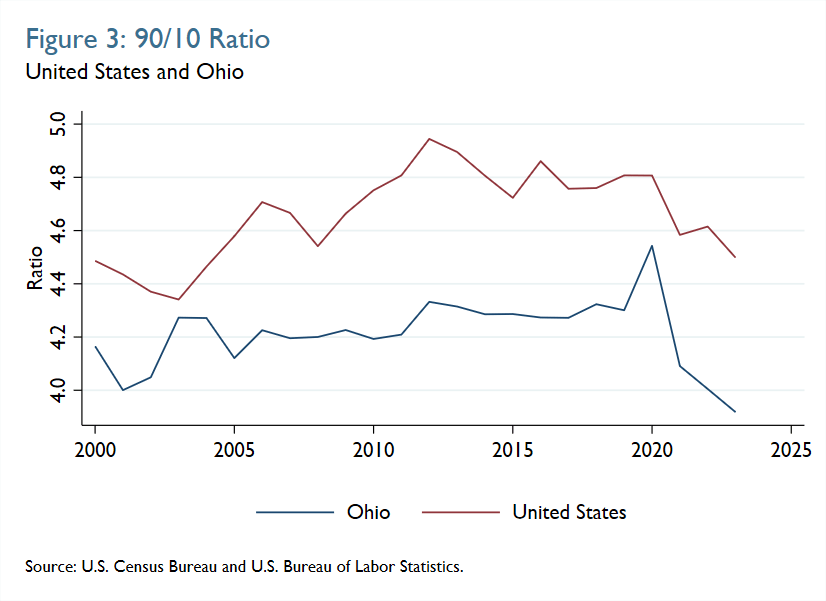
As of 2023, this ratio was 3.9 for Ohio, meaning that wages at the 90th percentile were almost four times higher than those at the 10th percentile. By contrast, this ratio was roughly 4.5 for Ohio in 2020, its peak during 2000 to 2023 (Figure 3). Nationally, the 90/10 ratio has tended to be higher than it has been in Ohio, though the measure for the United States has also drifted down since 2020.
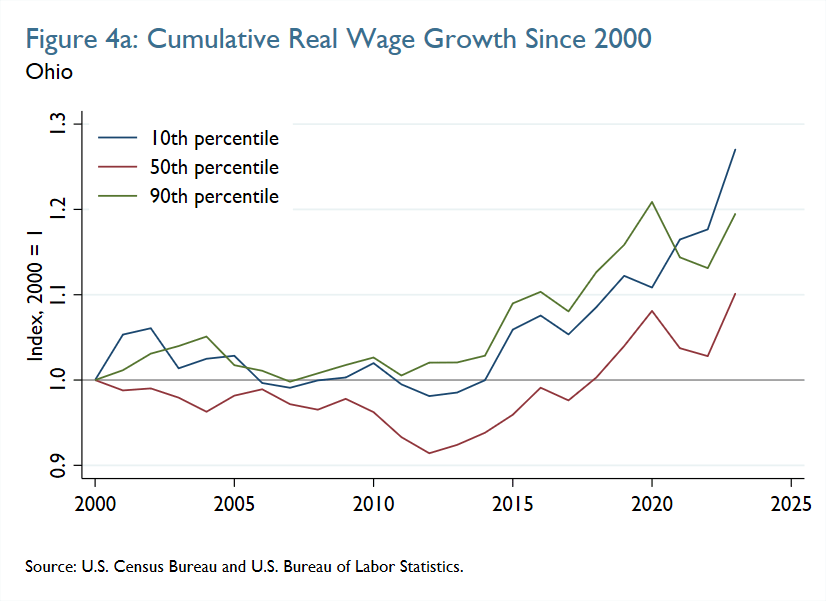
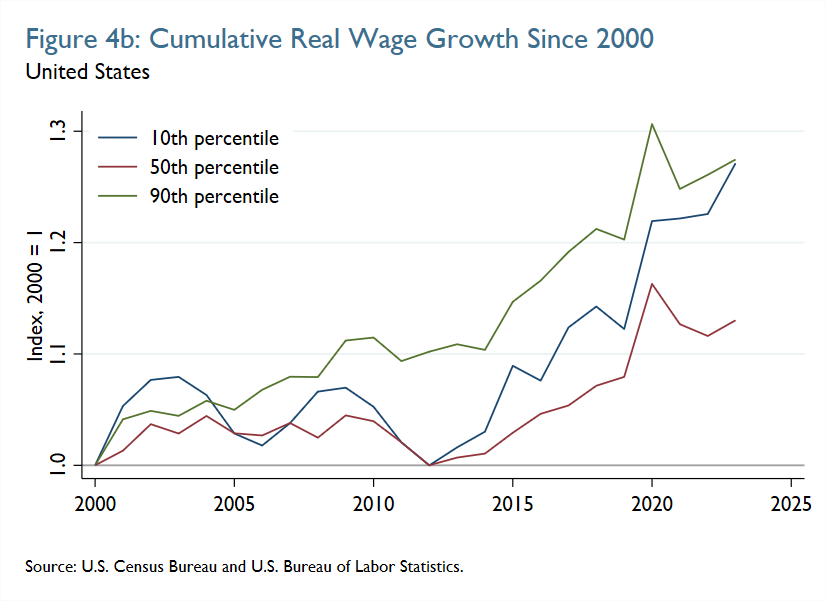
In Ohio, the stronger increases in real wages since 2020 for those at the bottom of the wage distribution have meant that these workers have actually seen stronger cumulative real wage gains than those in the middle (50th percentile) or at the top (90th percentile) since 2000. As of 2020, cumulative real wage gains through the preceding two decades for those at the 10th, 50th, and 90th percentiles were 11, 8, and 21 percent, respectively, consistent, as noted above, with stronger increases in real wages for workers at the top of the distribution (Figure 4a). However, by 2023, cumulative real wage gains since 2000 had amounted to about 27, 8, and 20 percent, respectively, for those at the 10th, 50th, and 90th percentiles, a surprising and largely unanticipated development. While the pattern nationally is a little less dramatic (Figure 4b), cumulative wage gains since 2000 for those at the 10th and 90th percentiles have nearly converged at around 27 percent after being almost 10 percentage points higher for higher-wage workers in 2020.14
Conclusion
Whether these recent developments are durable or whether we will see a reversion to the patterns that predated the pandemic remains to be seen. The pandemic caused both temporary disruptions to the economy and changes that are likely to be longer-lasting, for example, a greater share of workers who work from home at least some of the time. But whatever lies ahead, the last few years have clearly brought consequential changes to the US labor market, which have at least temporarily disrupted what had been growing wage inequality through the preceding decades. In Ohio, that has resulted in the lowest wage inequality in more than two decades, with lower-wage workers seeing real wage gains in recent years that were about twice as fast as those that preceded the pandemic and notably stronger gains than for others throughout the wage distribution.
Footnotes
- This analysis uses data from the Current Population Survey, a joint product of the US Census Bureau and US Bureau of Labor Statistics, which have been cleaned and made available by the Economic Policy Institute. 2024. Current Population Survey Extracts, Version 1.0.55, https://microdata.epi.org. The wage data that underlie this analysis include imputations for missing or top-coded values. Some researchers have raised concerns about using imputed earnings data. See, for example, Bollinger and Hirsch (2006). Return to 1
- “The Distribution of Household Income, 2018.” 2021. Report. Congressional Budget Office. https://www.cbo.gov/publication/57061. Return to 2
- Liu, Patrick, Greg Nantz, Ryan Nunn, and Jay Shambaugh. 2017. “Thirteen Facts about Wage Growth.” Brookings. https://www.brookings.edu/articles/thirteen-facts-about-wage-growth/. Return to 3
- Gravelle, Jane G. 2020. “Wage Inequality and the Stagnation of Earnings of Low-Wage Workers: Contributing Factors and Policy Options.” Report R46212. Congressional Research Service. https://crsreports.congress.gov/product/pdf/R/R46212. Return to 4
- See Autor, Dube, and McGrew (2023); DeCourcy and Gould (2024). Return to 5
- The results reported herein are for individuals 16 or older, with employment earnings other than from self-employment. For salaried workers, hourly wages are estimated by dividing an individual’s weekly earnings by their weekly hours worked. Return to 6
- The patterns presented herein are not associated with individual workers, but rather characterize aspects of the overall wage distribution. Return to 7
- The inflation adjustments used in this analysis are based on the national CPI for All Urban Consumers (CPI-U) and are not state specific. Return to 8
- 30th percentile: 1.4 percent, 50th percentile: 1.5 percent, 70th percentile: 1.6 percent. Return to 9
- NBER. 2023. “US Business Cycle Expansions and Contractions.” Dataset. National Bureau of Economic Research. https://www.nber.org/research/data/us-business-cycle-expansions-and-contractions. Return to 10
- US Department of Labor, State Minimum Wage Rate for Ohio [STTMINWGOH], retrieved from FRED, Federal Reserve Bank of St. Louis; https://fred.stlouisfed.org/series/STTMINWGOH. Return to 11
- See, for example, page 2 and Figure 1 in Autor, Dube, and McGrew (2023). DeCourcy and Gould (2024) show stronger real wage growth at the 10th percentile for workers in states with minimum-wage changes during this period but note that real wage changes were also strong in states where minimum wages were not adjusted. Return to 12
- See Autor, Dube, and McGrew (2023). Return to 13
- Specifically, as of 2020, cumulative real wage gains were 21.9 and 30.6 percent for the 10th and 90th percentiles, respectively. By 2023, they were 27.1 and 27.5 percent for the 10th and 90th percentiles, respectively. Return to 14
References
- Autor, David, Arindrajit Dube, and Annie McGrew. 2023. “The Unexpected Compression: Competition at Work in the Low Wage Labor Market.” Working Paper 31010. National Bureau of Economic Research. https://doi.org/10.3386/w31010.
- Bollinger, Christopher R., and Barry T. Hirsch. 2006. “Match Bias from Earnings Imputation in the Current Population Survey: The Case of Imperfect Matching.” Journal of Labor Economics 24 (3): 483–519. https://doi.org/10.1086/504276.
- deCourcy, Katherine, and Elise Gould. 2024. “Fastest Wage Growth over the Last Four Years among Historically Disadvantaged Groups.” Economic Policy Institute. https://www.epi.org/publication/swa-wages-2023/.
- Gravelle, Jane G. 2020. “Wage Inequality and the Stagnation of Earnings of Low-Wage Workers: Contributing Factors and Policy Options.” Report R46212. Congressional Research Service. https://crsreports.congress.gov/product/pdf/R/R46212.
- Liu, Patrick, Greg Nantz, Ryan Nunn, and Jay Shambaugh. 2017. “Thirteen Facts about Wage Growth.” Brookings. https://www.brookings.edu/articles/thirteen-facts-about-wage-growth/.
- NBER. 2023. “US Business Cycle Expansions and Contractions.” Dataset. National Bureau of Economic Research. https://www.nber.org/research/data/us-business-cycle-expansions-and-contractions.
- US Department of Labor, State Minimum Wage Rate for Ohio [STTMINWGOH], retrieved from FRED, Federal Reserve Bank of St. Louis; https://fred.stlouisfed.org/series/STTMINWGOH.
- “The Distribution of Household Income, 2018.” 2021. Report. Congressional Budget Office. https://www.cbo.gov/publication/57061.
Suggested Citation
Venkatu, Guhan. 2024. “Lower-Wage Workers in Ohio Have Seen Strong Wage Gains Since 2019.” Federal Reserve Bank of Cleveland, Cleveland Fed District Data Brief. https://doi.org/10.26509/frbc-ddb-20240903
This work by Federal Reserve Bank of Cleveland is licensed under Creative Commons Attribution-NonCommercial 4.0 International


