

- Share
Safety in Schools and Neighborhoods
Exposure to violent crime in childhood has potential long-run effects on students’ future earnings and hours worked. However, in the neighborhoods of students’ homes and schools where crime occurs, there are other factors at play working against students. This Economic Commentary discusses how violent crime and additional factors related to education potentially affect educational progress and, by extension, future labor force attachment. In school neighborhoods and residential neighborhoods where a lot of violent crime takes place, school administrators and students report a need for greater support from caregivers and from adults at school.

The views authors express in Economic Commentary are theirs and not necessarily those of the Federal Reserve Bank of Cleveland or the Board of Governors of the Federal Reserve System. The series editor is Tasia Hane. This paper and its data are subject to revision; please visit clevelandfed.org for updates.
Introduction
Research shows that exposure to violent crime has longer-run effects on individuals’ future earnings and hours worked (Aliprantis et al., 2023).1 Some measures of violent crime in the United States, such as those for homicide, remain elevated from their levels a decade ago (Federal Bureau of Investigation, 2024), potentially putting additional pressure on students’ future attainment and economic wellbeing (Sharkey et al., 2017; Schwartz et al., 2022; Casey et al., 2018). However, in the neighborhoods and school districts where violent crime is pervasive, other barriers are present that likely further limit student success. Because of these attendant barriers, it is often difficult to isolate the primary cause of negative outcomes that may be of interest to policymakers and others in pursuit of methods to reduce harm.
This Economic Commentary focuses on exploring the relationship between violent crime in neighborhoods of residence and in and around schools and other circumstances that potentially affect educational progress and, by extension, future workforce attachment. I do this by discussing perceptions of school administrators such as principals and of school-aged children ages 12 through 18 using data from the 2018 School Survey on Crime and Safety (SSOCS) (National Center for Education Statistics, 2020) and the 2022 School Crime Supplement from the National Crime Victimization Survey (SCS) (Bureau of Justice Statistics, 2024).2,3 Across surveys, both administrators and students in high-crime areas report lower levels of support from caregivers and adults within the school, in contrast to reports from administrators and students in low-crime areas.
Principals with Students in Higher-Crime Areas Cite Lower Levels of Parental Input and Support
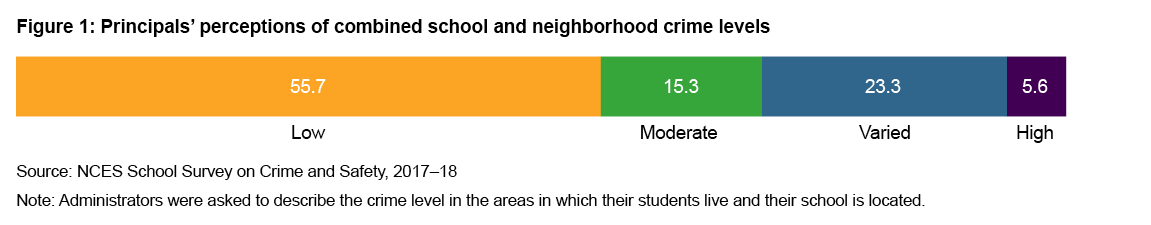
Elementary- and secondary-school principals surveyed in the SSOCS answered questions on a range of issues related to their schools and students. In two separate questions, each principal is asked to describe the level of crime in the neighborhood in which their school is located and the level of crime in the neighborhoods where their students live. The details in this paper come from answers to these two questions.4 The allowed responses are “high,” “moderate,” and “low” for each question. In addition, principals can denote that their students come from “mixed” areas of crime, meaning students come from various neighborhoods with differing levels of crime.
Figure 1 illustrates the joint responses to the questions. “Low” indicates that the school is in a low-crime area and the students live in low-crime areas. “Moderate” and “high” are similarly defined. Conversely, the “varied” category shows when crime levels differ across school neighborhood and their students’ neighborhoods and indicates that students are in proximity to crime either at home, at school, or in both locations but at different levels. The first takeaway is that across the United States, more than half of principals perceive their students to live and go to school in areas of low crime. The second takeaway, however, is that more than 40 percent of principals report that their students are potentially exposed to moderate or high levels of crime either where they live or go to school and that approximately one of every 20 principals reports their students both live in and go to school in a high-crime environment.
In addition to being surveyed on perceived levels of crime, principals are also asked to describe the ways in which they are limited in their efforts to reduce or prevent crime. It is unclear how each principal understood the scope of the question—that is, either within the school, an environment under their purview, suggesting the students are perpetrating at least some of the crime, or in the neighborhood, an environment largely beyond their purview—but the question appears intentionally broad.5
Figure 2 displays estimates of the percentage of principals who feel their school’s efforts to reduce crime are limited either by an external factor or a limitation within the school. The estimates derive from the relative difference in responses between principals by crime environment. I use these differences to extrapolate the share of the population of principals who would agree with the question in each panel by the crime environments in which their schools are located.6 Figure 2 demonstrates that principals in high-crime areas report lower levels of parent participation at open houses or regularly scheduled parent–teacher conferences.
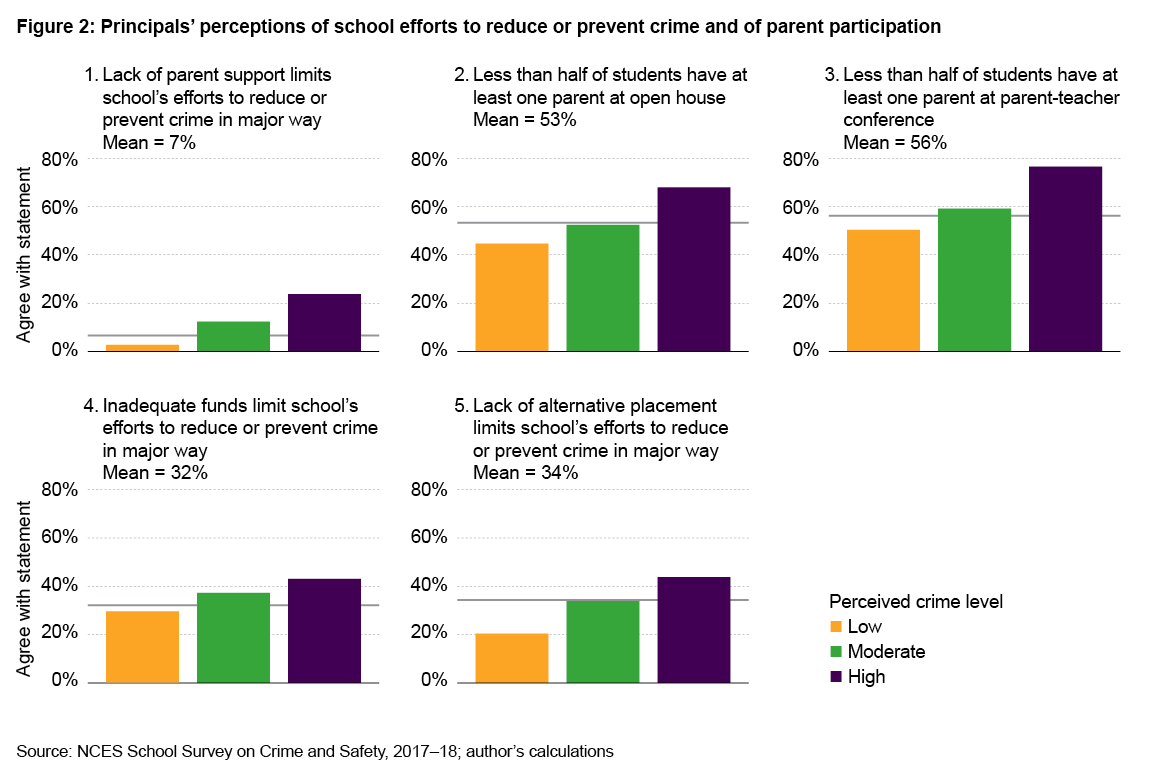
Figure 2, panel 1 shows the share of principals who agree that they are significantly limited in reducing or preventing crime by the lack of support they receive from parents. Each bar within the panel reflects a perceived level of crime in accordance with the responses shown in Figure 1.7 The horizontal grey line shows the average of principals, regardless of crime environment, who agree that lack of parent support prevents them from reducing crime. Overall, relatively few principals believe parent support is a limiting factor, but there are stark differences by crime exposure. Almost no principals in perceived low-crime areas report a lack of parent support, whereas nearly one-quarter of principals in perceived high-crime areas do.
Figure 2, panels 2 and 3 describe the share of principals who report that fewer than half of students had at least one parent attend an open house (panel 2) or a parent-teacher conference (panel 3). The averages in both columns indicate that principals believe that the lack of parent participation is somewhat high regardless of neighborhood, but, once again, the differences between areas are revealing in terms of principal perception. Nearly 70 percent of principals in high-crime areas report a lack of participation for open houses, but only 45 percent of principals in low-crime areas do. For parent–teacher conferences, slightly more than 75 percent of principals in high-crime areas report a lack of participation, whereas only 50 percent of principals in low-crime areas do.
These findings might suggest that many parents, especially in high-crime areas, potentially do not know what is being taught in their children’s schools or, according to their children’s teachers, if their children are, in fact, learning and retaining what is being taught. Bergman (2021) finds some evidence for this view. In an experiment conducted in Los Angeles, California, he found that parents had “upwardly biased” beliefs about their child’s effort, meaning they underestimated the number of assignments their child missed. And this bias was negatively correlated with student performance. However, when parents received additional information about their child’s progress, such as detailed messages about missed coursework periodically throughout the grading period, parents were 53 percent more likely to attend a parent–teacher conference in the future.
Figure 2, panel 4 reports lack of funds as a limiting factor. Money is an important channel to mitigate crime and improve labor force prospects because funding has been shown to increase education and human capital, and increased education and human capital raises earnings and the opportunity costs of committing crime, especially violent crime (Atems and Blankenau, 2021; Rothstein and Schanzenbach, 2022). In the short term, improved funding for safety measures within the neighborhood of the school may also improve students’ sense of security in getting to school and while at school.
While principals in higher-crime areas do report lack of funds as a limitation more often than principals in lower-crime areas, the differences between areas are smaller than all high- versus low-crime differences for parent support and parent participation in Figure 2, panels 1 through 3. However, school district funding is set according to state-level formulas that do not include crime reduction as a factor, so it is reasonable to suggest that certain administrators may continue to see this as a limiting factor.
Figure 2, panel 5 reports as a limiting factor lack of alternative placement, that is, taking a student out of a traditional classroom environment, generally because of behavioral difficulty, and placing that student into a different classroom, program, or school that is better able to accommodate the student’s needs. Lack of alternative placement is less of a problem for principals in lower-crime areas, where principals were half as likely to report this as a problem relative to principals in higher-crime areas. The reporting differences by crime level may be related to problems placing special education students in appropriate programs, an occurrence which was frequently cited as a limitation, or that high-crime environments increase the likelihood of behavioral difficulties, though other challenges of high-crime environments may dominate.
Students in Higher-Crime Areas Report Lower Levels of Support from Adults at School
Similar to principals, adolescents (12 to 18 years old) surveyed in the SCS are asked their opinions on neighborhood and school-area safety and how safety in these places relates to their schooling experience. Students were asked to agree or disagree with questions asking if the neighborhood around their school or the neighborhood where they live had a lot of crime. About one in 25 children reported living in areas with a lot of crime and going to school in areas with a lot of crime, reports which align with what principals reported in the “high” category in Figure 1.8 In addition to being asked the two questions about crime, children were also surveyed on their perceptions of treatment at school, their feelings about school, and their academic progress and plans. Responses available were “strongly agree,” “agree,” “disagree,” and “strongly disagree.” For the analysis illustrated in Figure 3, “strongly agree” and “agree” are recorded as one, and “disagree” and “strongly disagree” are recorded as zero.
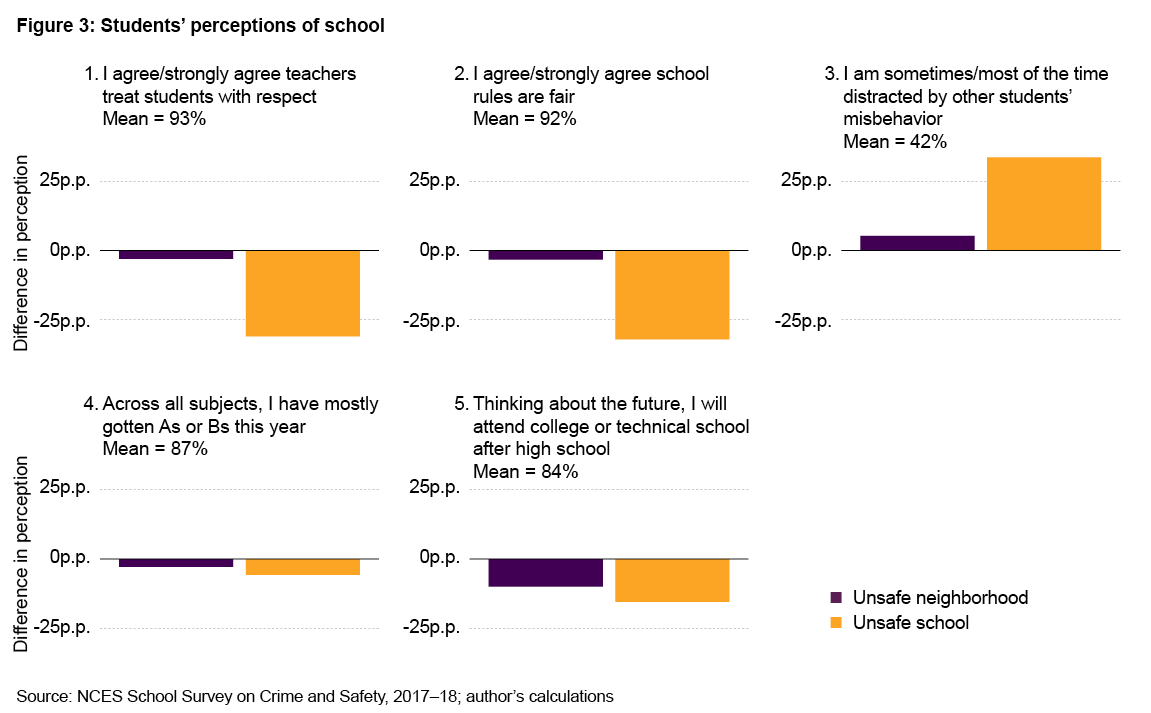
Figure 3 reports results from a regression of students’ schooling experiences on students’ perceptions of crime in their neighborhoods and around the schools they attend, controlling for sex, region, household income, race, and Hispanic ethnicity.9
The purple bar in each panel of Figure 3 captures the difference in perception for students that live in “unsafe neighborhoods,” that is, the students who agreed there is a “lot of crime” in their neighborhoods, relative to the students who live in safer neighborhoods. Similarly, the yellow bar captures the difference in perception for students who attend schools in unsafe areas, that is, the set of students who agreed there is a “lot of crime” near their schools, relative to the students who did not believe there was a lot of crime near their schools. The sum of the bars represents the penalty for students who both live in unsafe neighborhoods and go to schools in unsafe areas. At the top of each panel, I report the percent of students in safer neighborhoods and safer schools that agreed to each prompt, so the bars can be read as reductions from this percentage, except in the case of panel 3, which shows increases.
Figure 3, panel 1 reports differences in students’ perception as to whether teachers treat students with respect. The short purple bar indicates that students living in safe and unsafe neighborhoods had similar responses to this question. By contrast, students attending schools in high-crime neighborhoods were 31 percentage points less likely to agree that teachers treated students respectfully than students attending schools in low-crime neighborhoods.
Differences in treatment are further evidenced by the fact that students attending unsafe schools were 32 percentage points less likely to report feeling the rules they were subject to were fair, as displayed in Figure 3, panel 2. This could be related to students’ beliefs that punishments are not meted equally, that rules are or are not being strictly enforced, or uncertainty related to the punishment that follows rule breaking. While not shown in the figure, students attending unsafe schools were consistently more likely to believe these statements were true. The differences in opinions by crime-level may create a drag on achievement in high-crime areas—and as a consequence, affect the future opportunities afforded to some students when in the labor market—a situation which has been demonstrated by Pearman II et al. (2019) in the case of discipline gaps.
Figure 3, panel 3 reports that students in unsafe schools were 33 percentage points more likely to report being distracted by other students’ misbehavior. Overall, 42 percent of students report being distracted by misbehavior, a figure suggesting this problem extends beyond high-crime areas.
Figure 3, panel 4 reports students’ responses to whether they mostly earned As or Bs during the school year in which they were surveyed, and Figure 3, panel 5 reports whether students agreed they had plans for school beyond high school, such as going to college, technical school, or vocational school. In comparison to students in safer schools and safer residential neighborhoods, more students living in high-crime neighborhoods and going to schools in high-crime neighborhoods reported receiving Cs or lower in the survey year and did not intend to go to school beyond high school. Bureau of Labor Statistics (2024) data show labor force attachment and the likelihood of being employed increase with education, so a potential implication is that student beliefs, related to their plans in particular, may be working to lower their labor force prospects.
Conclusion
This Economic Commentary highlights that high-crime residential and school neighborhoods present challenging environments for students. Principals in high-crime areas report lower parental involvement. Students in high-crime areas were less likely than students in safer areas to report that teachers treated students with respect or that the rules were fair, and they also reported a lower probability of attending additional schooling after high school.
References
- Aliprantis, Dionissi, and Kristen N. Tauber. 2023. “Childhood Exposure to Violence and Nurturing Relationships: The Long-Run Effects on Black Men.” Working Paper No. 23-16. Federal Reserve Bank of Cleveland. doi.org/10.26509/frbc-wp-202316.
- Atems, Bebonchu, and William Blankenau. 2021. “The ‘Time-Release’, Crime-Reducing Effects of Education Spending.” Economics Letters 209(December): 110143. doi.org/10.1016/j.econlet.2021.110143.
- Bergman, Peter. 2021. “Parent-Child Information Frictions and Human Capital Investment: Evidence from a Field Experiment.” Journal of Political Economy 129(1): 286–322. doi.org/10.1086/711410.
- Casey, Marcus, Jeffrey C. Schiman, and Maciej Wachala. 2018. “Local Violence, Academic Performance, and School Accountability.” AEA Papers and Proceedings 108(May): 213–216. doi.org/10.1257/pandp.20181109.
- Federal Bureau of Investigation. 2024. “Expanded Homicides Reported in the United States.” FBI Crime Data Explorer. cde.ucr.cjis.gov/LATEST/webapp/#/pages/explorer/crime/shr.
- Hipp, John R. 2013. “Assessing Crime as a Problem: The Relationship Between Residents’ Perception of Crime and Official Crime Rates Over 25 Years.” Crime & Delinquency 59(4): 616–648. doi.org/10.1177/0011128710382264.
- National Center for Education Statistics. 2020. “2017–18 School Survey on Crime and Safety (SSOCS) Public-Use Data File.” Institute of Education Sciences. nces.ed.gov/use-work/resource-library/report/users-manualdata-file-documentation/2017-18-school-survey-crime-and-safety-ssocs-public-use-data-file-users-manual?pubid=2020054.
- Pearman, Francis A., II, F. Chris Curran, Benjamin Fisher, and Joseph Gardella. 2019. “Are Achievement Gaps Related to Discipline Gaps? Evidence From National Data.” AERA Open 5(4). doi.org/10.1177/2332858419875440.
- Rothstein, Jesse, and Diane Whitmore Schanzenbach. 2022. “Does Money Still Matter? Attainment and Earnings Effects of Post-1990 School Finance Reforms.” Journal of Labor Economics 40(S1): S141– S178. doi.org/10.1086/717934.
- Schwartz, Amy Ellen, Agustina Laurito, Johanna Lacoe, Patrick Sharkey, and Ingrid Gould Ellen. 2022. “The Academic Effects of Chronic Exposure to Neighbourhood Violence.” Urban Studies 59(14): 3005–3021. doi.org/10.1177/00420980211052149.
- Sharkey, Patrick, and Gerard Torrats-Espinosa. 2017. “The Effect of Violent Crime on Economic Mobility.” Journal of Urban Economics 102(November): 22–33. doi.org/10.1016/j.jue.2017.07.001.
- US Bureau of Justice Statistics. 2024. “National Crime Victimization Survey: School Crime Supplement, [United States], 2022: Version 1.” Inter-university Consortium for Political and Social Research, February 28. doi.org/10.3886/ICPSR38666.V1.
- US Bureau of Labor Statistics. 2024. “Labor Force Participation Increased by Education Level for Americans Born from 1980 to 1984.” The Economics Daily, April 25. bls.gov/opub/ted/2024/labor-force-participation-increased-by-education-level-for-americans-born-from-1980-to-1984.htm.
Endnotes
- It remains a challenge to identify the impact from all or nonviolent crime because not all crime is reported to law enforcement agencies, and in cases where nonviolent crime occurs concurrently with violent crime, only the violent crime is reported. Return to 1
- While the public tends to perceive the level of crime is higher than it actually is, Hipp (2013) has shown the actual violent crime rate is the strongest predictor of perceived crime. Return to 2
- The public-use data for the 2019–2020 SSOCS was released in November 2024. The survey removes two questions related to parent participation important to the discussion. Conclusions drawn from questions that remain between survey waves are unchanged. Results can be shared by the author by request. Return to 3
- All questions, responses, and variable construction used in the analysis are listed in the appendix for convenience. Return to 4
- For other questions, principals were explicitly asked to only consider activities “at their school,” but this was not part of the language for the question considered here. Return to 5
- The differences are relative because in the regression from which Figure 2 is derived, I control for school level, enrollment size, and type of locale. The prediction is then recovered by setting the control variables at “city” for locale, “high school” for school level, and “500–999” for enrollment size. I chose these to reflect where crime occurrence is most likely to happen, the age and student group for whom it is most salient, and the school size most prevalent in the data. Return to 6
- Given that estimation reflects only responses from a subset of principals, there is uncertainty induced from the sampling procedure. I omit the estimates that reflect this uncertainty; they do not change the qualitative conclusions. Return to 7
- The exact number was 4.2 percent, per author’s calculations. Return to 8
- Students who refused to answer a question, comprising 9 percent of the initial sample, were excluded from the exercise to achieve comparability across panels. In cases in which students in high-crime environments are negatively impacted—that is, the sign of the true impact of high-crime environments is less than zero—the results will be biased toward zero if students in high-crime areas are more likely to refuse to answer a question and report negative sentiment. While we cannot know how non-respondents would have answered, students in high-crime areas were overrepresented in the share of non-respondents. Return to 9
Suggested Citation
Sylvera, Craig. 2025. “Safety in Schools and Neighborhoods.” Federal Reserve Bank of Cleveland, Economic Commentary 2025-10. https://doi.org/10.26509/frbc-ec-202510
This work by Federal Reserve Bank of Cleveland is licensed under Creative Commons Attribution-NonCommercial 4.0 International

