

- Share
Neutral Interest Rates and the Monetary Policy Stance
The neutral interest rate (r-star) is an important input in monetary policy discussions and is commonly used to assess the stance of monetary policy. This Economic Commentary presents estimates of the neutral interest rate from a recently developed model and provides a high-level description of this new model. With data through 2025:Q2, the model estimates the implied (medium-run) nominal neutral interest rate to be 3.7 percent, with a 68 percent coverage band ranging from 2.9 percent to 4.5 percent. Given that the effective nominal federal funds rate is currently in the range of 4.25 percent to 4.5 percent, this model estimates with a high level of certainty (77 percent probability) that the policy stance is in restrictive territory.
The updates to the estimates of neutral interest rate (r-star) from the Zaman model reported in this Economic Commentary are available at openICPSR, doi.org/10.3886/E227362.


The views authors express in Economic Commentary are theirs and not necessarily those of the Federal Reserve Bank of Cleveland or the Board of Governors of the Federal Reserve System. The series editor is Tasia Hane. This paper and its data are subject to revision; please visit clevelandfed.org for updates.
Introduction
Federal Reserve monetary policy aims to achieve stable prices and maximum employment. To achieve these goals, the Federal Open Market Committee (FOMC) mainly uses three monetary policy tools: the federal funds rate, the Federal Reserve’s balance sheet size, and forward guidance about future policy actions. Of these three tools, the federal funds rate, the rate of interest at which banks lend reserve balances to each other overnight on an unsecured basis, is considered the primary tool through which the FOMC influences a broader set of interest rates in the economy. In setting the target range for the federal funds rate, the committee monitors developments in a range of macroeconomic and financial indicators and consults prescriptions from various monetary policy rules (Knotek et al., 2016).
One common way to assess the monetary policy stance, to gauge how restrictive policy is, is to determine how far the actual nominal federal funds rate is from estimates of the nominal “neutral” rate of interest (Pescatori and Turunen, 2016). The monetary policy stance is deemed restrictive when the actual federal funds rate is above the neutral interest rate (a positive gap). When it is below (a negative gap), it is considered accommodative. This commonly used assessment is a simple approach to measuring the stance of monetary policy, one which we adopt in this Economic Commentary. However, there are alternative measures of the monetary policy stance that look at broader financial conditions and by doing so attempt to also incorporate developments in the other two primary tools of monetary policy, forward guidance and changes in the balance sheet size (Choi et al., 2022).
The neutral interest rate is an unobserved object; therefore, determining its value is a challenging task. Further complicating the task is that many of the drivers of the neutral interest rate are themselves not directly observable. Accordingly, a range of econometric methods, from simple to complex economic models, have been applied to observable data, such as GDP, unemployment, price inflation, productivity, and market interest rates, to infer estimates of the neutral interest rate. Different methods and modeling assumptions can and do yield diverging estimates of the neutral interest rate, requiring a high degree of subjective input by the users of the neutral interest rate (for example, policymakers). During periods when various methods give similar estimates, policymakers may be more confident in their inference about the neutral rate. So, reflecting the difficulty of precisely estimating the neutral rate, many central banks maintain a suite of models to infer the neutral interest rate for their respective economies.
In this Economic Commentary, we present estimates of the medium-run neutral interest rate inferred from a newly developed model called the “Zaman model” (2024) and compare them to estimates from widely used alternative models, including the seminal model of Laubach and Williams (2003). We provide a high-level overview of the Zaman model’s key elements for estimating the neutral interest rate. Compared to existing models, this model uses a larger information set consisting of macroeconomic and financial indicators, relies on a greater number of economic relationships among model variables, brings in judgmental information from the survey expectations of professional forecasters, incorporates empirical features such as time-varying relationships that past research has shown to be important when working with macroeconomic data, and jointly determines r-star (the neutral interest rate) with other unobserved stars such as pi-star (the medium to long-run level of price inflation) and g-star (the growth rate of potential output). This latter feature is quite advantageous in the present context, as the joint determination of pi-star and r-star, which economic theory says is influenced by g-star, permits model-based inference about the nominal neutral interest rate (i-star), which we compare to the actual federal funds rate to infer the policy stance. All these features combined in a single model permit better identification and more precise inference about the neutral interest rate.
As of 2025:Q2, the new model’s estimate of the nominal neutral interest rate is 3.7 percent, with a 68 percent coverage interval spanning 2.9 percent through 4.5 percent, suggesting a fair amount of uncertainty around the central estimate. Given that the actual federal funds rate is in the range of 4.25 percent to 4.5 percent, the new model attributes a high probability that the policy stance as captured by the federal funds rate is as currently in restrictive territory.
What is the neutral interest rate?
The neutral interest rate is the level of the short-term interest rate that neither stimulates nor restricts economic activity. This implies that when the actual policy interest rate is at the neutral interest rate, the policy stance is believed to be neither expansionary (accommodative) nor contractionary (restrictive). In the medium to long run, when the short-term rate is held at this neutral level, the economy is growing at its potential, prices are increasing at its trend rate, and the unemployment rate is at its trend rate and determined by structural rather than cyclical factors. As discussed below, with this neutral interest rate determined by a variety of structural and persistent factors, there is no reason for it to be constant over time.1
Assumed drivers of the neutral interest rate
The academic literature has posited several determinants of the neutral interest rate. Economic theory posits that the neutral interest rate is an equilibrium rate that equates aggregate savings and investment demand in the economy. So, as a rule of thumb, any factor that permanently shifts the demand for or supply of aggregate savings or aggregate investment will shift the neutral interest rate. Over the past three decades, there has been general agreement that the neutral interest rate has gradually declined, informed by theoretical reasoning and empirical estimates from models.2 This gradual decline is because most of the factors assumed to influence the neutral interest rate have generally moved in the same direction, pushing the neutral rate lower. Ademmer and Rush (2024) provide a detailed summary of the main determinants; here, we provide a high-level overview.
Trend output growth: The economy’s growth rate of potential output is mainly determined by trend productivity growth and trend labor force growth. Lower productivity growth is associated with a lower return on capital, a circumstance which in turn decreases demand for aggregate investment, thereby reducing the neutral interest rate. Similarly, a smaller labor force requires less capital than a bigger labor force, reducing investment needs and, in turn, the neutral interest rate.
Population age structure: Workers tend to save during their prime working years, and as they near retirement and beyond, they draw upon their savings. An increasing ratio of prime-age workers to retirees increases the supply of aggregate savings in the economy, something which increases the demand for safe assets needed to fund retirements and in-turn lowers the neutral interest rate.
Income inequality: All else being equal, higher income inequality is associated with higher savings, as higher-income individuals save a larger share of their income than lower-income individuals. Hence, higher inequality (associated with higher aggregative savings) pushes down the neutral interest rate.
Convenience yield: Given the perceived safety and liquidity features of US government bonds, investors are willing to pay a premium in the form of accepting lower returns in order to hold these safe assets. Higher premiums for these safe assets depress the neutral interest rate.
Net safe asset supply: A net decline in the global supply of safe assets (when global demand for safe assets outstrips the supply of safe assets) pushes down the neutral interest rate.
Quantifying the role of these various determinants is challenging, partly because many of these factors are correlated and not directly observable. A common approach, adopted by semi-structural models, is to relate movements in the neutral interest rate to movements in just two determinants: trend output growth and a nongrowth component, the latter of which is assumed to capture the combined effect of all factors other than trend output growth. We summarize a leading semi-structural model that is commonly used to measure and explain the neutral interest rate before presenting the Zaman model, which builds on the prior model by bringing in more information, more economic relationships, and a richer structure to more precisely estimate the neutral interest rate.
The seminal model of Laubach and Williams
In 2003, Laubach and Williams developed a small-scale empirical model to estimate the real neutral interest rate (r-star). Specifically, they formulated an equation for the neutral rate as a function of two determinants: the trend growth rate of potential output (g-star) and a catch-all component, which is assumed to capture the combined effects of all potential determinants other than g-star on the neutral rate. Two additional equations are defined to capture the economic relationships between real output (specifically, the output gap, defined as the deviation of actual output from the estimated level of potential output) and the real interest rate (specifically, the interest rate gap, defined as the difference between the actual short-term real interest rate and r-star) and also between inflation and the output gap. The former relationship is characterized as a reduced-form aggregate demand curve—an investment demand-aggregate savings relationship, or IS—and the latter is the price Phillips curve. Because these equations directly relate aggregate macroeconomic variables and do not use microfoundations, their modeling approach is considered by economists to be “semi-structural” as opposed to fully “structural.”
The model is estimated using data on three economic variables: short-term interest rates, inflation, and real GDP. One of their main findings was that the neutral interest rate estimates exhibit notable time variation. Prior to their work, the common practice was to use a constant value of 2 percent for r-star, following the work of John Taylor on monetary policy rules (Taylor, 1993). The 2 percent value was determined from the average GDP growth rate over the period 1984:Q1 to 1992:Q3 and the average real interest rate over this same period, both of which were very close to 2 percent (as highlighted in Wieland, 2018).
The publication of Laubach and Williams’s model sparked an increase in research on estimating (real) neutral interest rates. Most contributions have extended the Laubach and Willams model by enriching it through additional structure to better reflect the various possible drivers of the neutral interest rate discussed above, imposing restrictions on equations to make the model more structural, introducing more information via additional observables, and incorporating empirical features such as time-varying relationships.
High-level overview of the Zaman model for R-star
Similar to the model developed by Laubach and Williams, Zaman’s model is also semi-structural. The model combines many features, including economic relationships from existing models, and introduces new ones, resulting in a much richer structure. The model features an equation defining the aggregate demand (IS) curve via long-term real interest rates, an equation describing the central bank’s monetary policy reaction function (a Taylor-type rule) based on the short-term interest rate, an equation linking the model’s r-star to the professional forecasters’ survey expectations of r-star (which can be viewed as a subjective estimate of r-star and have been shown to be a useful guide during periods of elevated uncertainty), and an equation linking r-star to its determinants, trend GDP growth (g-star) and its nongrowth component. The model allows for time variation in various economic relationships and in the processes defining economic shocks. The latter feature effectively accommodates shocks of varying sizes including the extreme COVID-19 shock, helping minimize distortions to the model’s estimated relationships from extreme outliers in the data.
The combination of more economic relationships, more information, and allowing for empirical features such as time-variation in relationships and shock processes better distinguishes cyclical, idiosyncratic, and low-frequency variations in the variables considered. This yields more credible estimates of stars (for example, the neutral interest rate) and other model objects, as shown in Zaman (2024). Another defining feature of the model is that it estimates r-star jointly with other stars, such as trend growth (g-star), trend productivity (p-star), trend inflation (pi-star), the natural rate of unemployment (u-star), and trend nominal wages (w-star). The joint determination of r-star with other stars provides internally consistent estimates of the stars and allows for an inference about the nominal neutral interest rate (i-star), defined as the sum of r-star and pi-star. Lastly, to account for unconventional monetary policy during periods of the zero lower bound (ZLB), the model uses an estimate of the shadow federal funds rate, which equals the actual federal funds rate when the fed funds rate is not at the ZLB and can be negative when the ZLB binds.
R-star estimates from the Zaman model
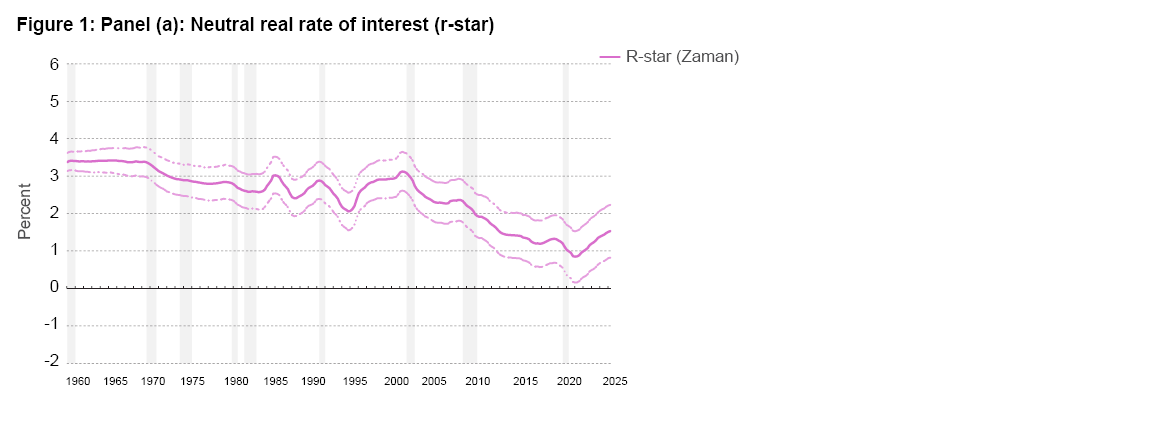
Panel (a) of Figure 1 presents the time-varying estimates of r-star from the Zaman model. The mean estimate from the model shows r-star’s staying relatively flat at 3.4 percent in the 1960s and then slowly declining through the 1970s, reaching 2.6 percent by early 1980. Thereafter, it fluctuates between 2.0 percent and 3.0 percent until the beginning of 2000. From there on, it steadily declines, reaching 0.8 percent by early-2021. Since then, it has gradually increased to 1.5 percent in 2025:Q2. To understand the evolution of r-star, it is helpful to examine the dynamics of its determinants, g-star (Figure 1, panel b), and the nongrowth component, D (Figure 1, panel c). It is worth noting that because the model estimates a tight quantitative link between r-star and g-star, the movements in g-star significantly influence the dynamics of r-star.3
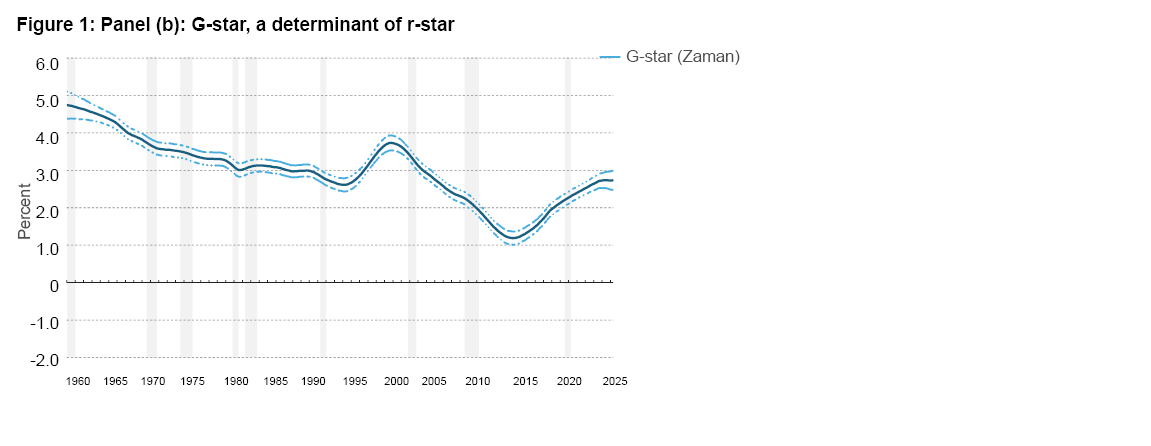
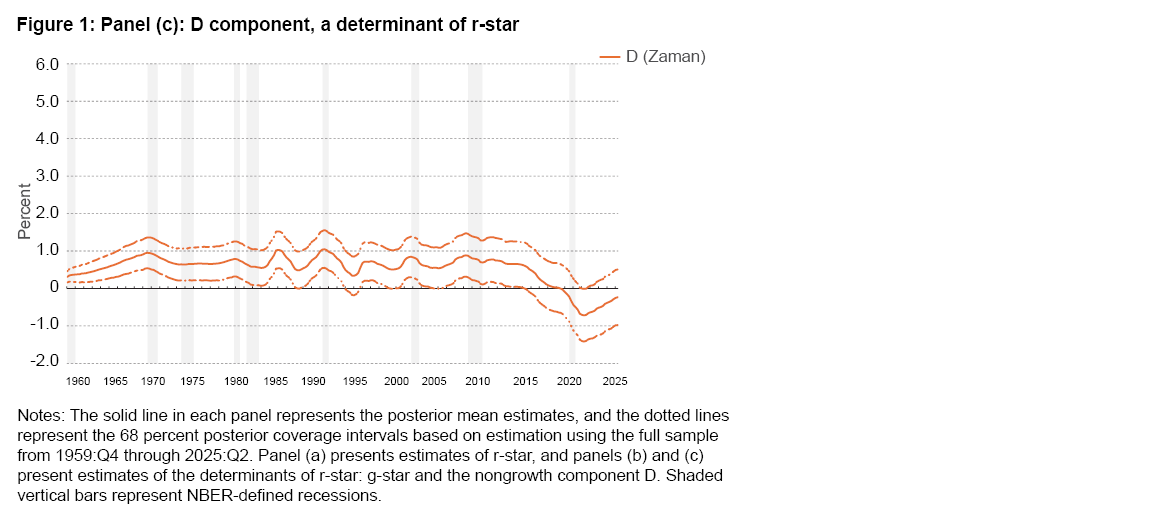
The model’s estimate of g-star indicates that the growth rate of potential output has steadily declined from an annualized rate of nearly 4.5 percent in the early 1960s to a rate of 1.2 percent in 2012, except for a temporary rise in the late 1990s, reflecting the internet technology boom. The decline in g-star from 2000 through 2012 was sharper, as g-star is estimated to have declined from 3.6 percent to 1.2 percent, a reduction of 2.4 percentage points. During this period, the nongrowth component D is estimated to have declined by a small amount of 0.10 percentage points. These developments pushed r-star lower by 170 basis points (bps).
However, from 2015 onward, an increasingly positive economic climate emerged, driving g-star steadily higher, reaching 2.2 percent just before the COVID-19 pandemic. In contrast, the nongrowth component D moved steadily lower during this period. Accordingly, the growth component exerted an upward pressure of 60 bps on r-star, but that pressure was more than offset by the nongrowth component, resulting in a 24 bps decline in r-star. As a result, between 2000 and 2020, the model has r-star declining by 200 bps.
Following the pandemic, from early 2021 through the present, both the components D and g-star have moved up, with g-star accelerating to 2.7 percent by mid-2023, where it currently remains, and D increasing by 0.5 percentage points. Accordingly, r-star has risen by 70 bps from 0.8 percent to 1.5 percent, of which 20 bps is contributed by the growth component and the remaining 50 bps by the nongrowth component, D. As of 2025:Q2, r-star is estimated to be 1.5 percent, with the 68 percent coverage interval spanning 0.8 percent to 2.2 percent, a relatively narrow interval compared to those reported elsewhere in the literature, for instance, in Laubach and Williams (2003).
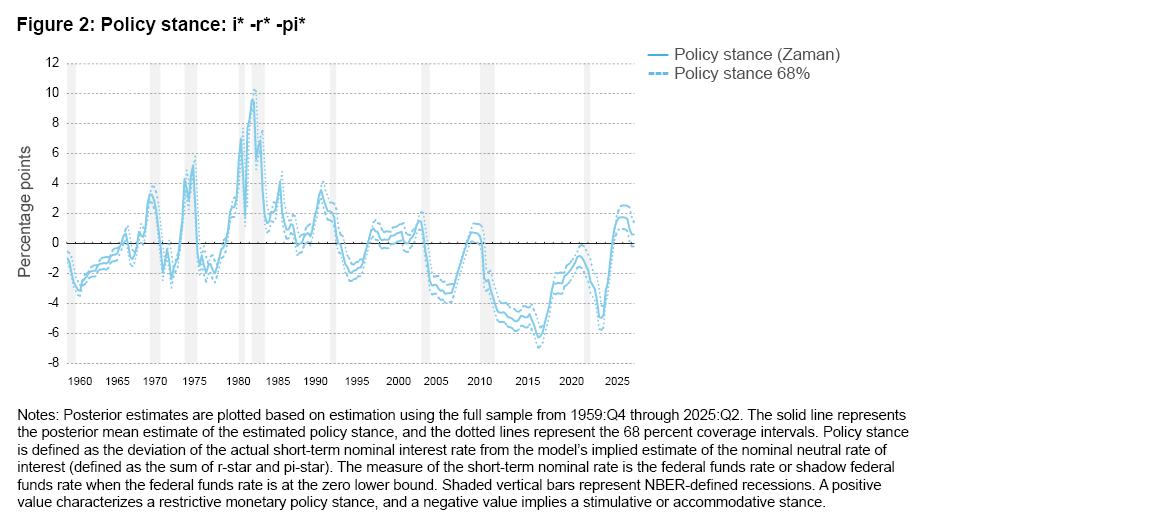
Figure 2 provides an assessment of the monetary policy stance from Zaman’s model, based on the deviation of the actual short-term nominal interest rate from the model’s implied estimate of the nominal neutral rate of interest (the sum of r-star and pi-star). According to the model estimates, after remaining quite accommodative following the COVID-19 pandemic shock, the policy stance turned restrictive at the end of 2022, and by 2023:Q3 it was more restrictive than at any time after 1990. But even then, the stance remained significantly less restrictive compared to the early 1980s, when inflation was in double digits. Over the past year, the stance has gradually loosened, but as of 2025:Q2, according to the model’s central estimate, the stance remained restrictive, with the model attributing a 77 percent probability to this assessment.4
R-star comparison: Zaman model versus Laubach and Williams model
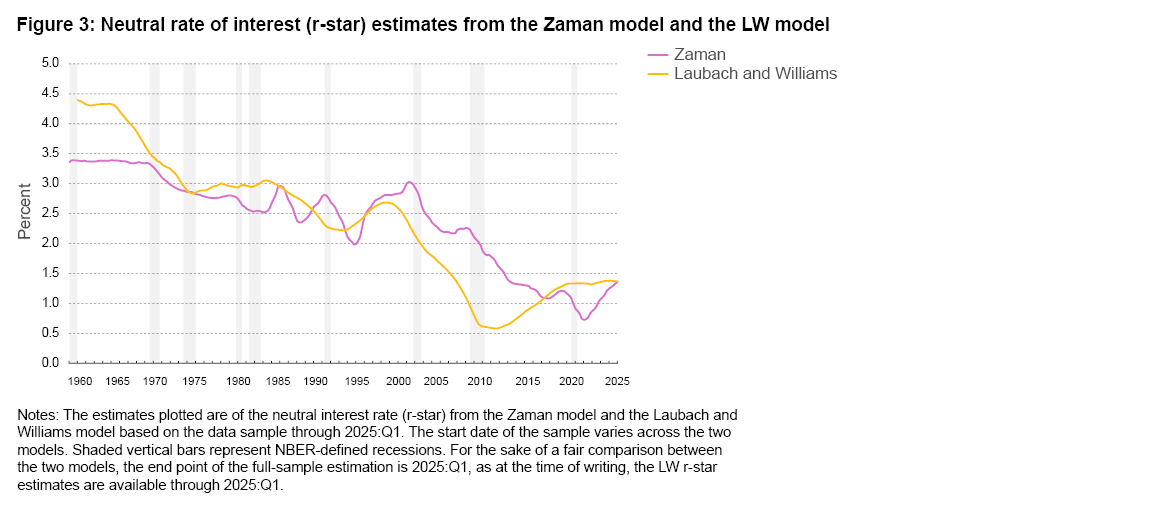
Figure 3 plots the estimates of r-star from the Zaman model and the model of Laubach and Williams (2003) [LW].5 Although both LW and Zaman show some similarities in the contours of r-star in that both have r-star declining over the sample shown, there remain sizable differences between the estimates. At times, such as in 2007, the difference between the estimates exceeds 150 basis points. LW has the r-star decline starting in early 2000, whereas in the Zaman model the descent begins a year later and starts from a higher level. The two models provide contrasting inferences from 2009 to 2017, with the LW model estimating r-star as gradually increasing and the Zaman model estimating r-star as gradually decreasing. From 2020 to the present, while the LW model infers r-star as remaining flat near 1.3 percent, the Zaman model has r-star increasing gradually from 0.9 percent to 1.4 percent.
It is worth noting that the similarity in the contours of r-star between the two models mainly stems from the fact that, in both models, their respective estimates of g-star influence the r-star trajectory, with the influence being stronger in the LW model than in the Zaman model. The estimate of the parameter capturing the strength of the relationship between g-star and r-star is 0.65 in the Zaman model versus 1.13 in the LW model.
Conclusion
The neutral interest rate is an important input in monetary policy decision making because it provides one way of assessing the stance of monetary policy. However, the neutral interest rate is an unobserved object, so various models and data sources are used to infer its value. This Economic Commentary presents estimates of the neutral interest rate from the Zaman model (2024) and provides a high-level model description. To infer the neutral interest rate, the Zaman model assumes a richer structure and conditions on more information, including survey data, than do existing models. As of 2025:Q2, this newly developed model infers an implied nominal neutral interest rate of 3.7 percent, with a 68 percent coverage interval spanning 2.9 percent to 4.5 percent. With the nominal federal funds rate currently in the range of 4.25 percent to 4.5 percent, the Zaman model estimates the policy stance to be in restrictive territory with a high level of certainty, at a 77 percent probability.
References
- Ademmer, Martin, and Jamie Rush. 2024. “Drivers of the Natural Long-Term Rate of Interest (and Why the Economy Hasn’t Tanked).” Oxford Open Economics 3(January). doi.org/10.1093/ooec/odae012.
- Choi, Jason, Taeyoung Doh, Andrew Foerster, and Zinnia Martinez. 2022. “Monetary Policy Stance Is Tighter than Federal Funds Rate.” FRBSF Economic Letter, no. 2022-30 (November). frbsf.org/research-and-insights/publications/economic-letter/2022/11/monetary-policy-stance-is-tighter-than-federal-funds-rate/.
- Hamilton, James D., Ethan S. Harris, Jan Hatzius, and Kenneth D. West. 2016. “The Equilibrium Real Funds Rate: Past, Present, and Future.” IMF Economic Review 64(4): 660–707. doi.org/10.1057/s41308-016-0015-z.
- Knotek, II, Edward S., Randal J. Verbrugge, Christian Garciga, Caitlin Treanor, and Saeed Zaman. 2016. “Federal Funds Rates Based on Seven Simple Monetary Policy Rules.” Economic Commentary, no. 2016-07(July). doi.org/10.26509/frbc-ec-201607.
- Laubach, Thomas, and John C. Williams. 2003. “Measuring the Natural Rate of Interest.” Review of Economics and Statistics 85(4): 1063–1070. doi.org/10.1162/003465303772815934.
- Pescatori, Andrea, and Jarkko Turunen. 2016. “Lower for Longer: Neutral Rate in the US.” IMF Economic Review 64(4): 708–731. doi.org/10.1057/s41308-016-0017-x.
- Taylor, John B. 1993. “Discretion versus Policy Rules in Practice.” Carnegie-Rochester Conference Series on Public Policy 39(December):195–214. doi.org/10.1016/0167-2231(93)90009-L.
- Wieland, Volker. 2018. “R-Star: The Natural Rate and Its Role in Monetary Policy.” In The Structural Foundations of Monetary Policy, edited by Michael D. Bordo, John H. Cochrane, and Amit Seru, 45–61. Hoover Press Book Stanford.
- Zaman, Saeed. Forthcoming. “A Unified Framework to Estimate Macroeconomic Stars.” The Review of Economics and Statistics. doi.org/10.1162/rest_a_01570.
Endnotes
- There is a related concept of short-run neutral interest rate, one which refers to the hypothetical real interest rate that prevails if prices in the economy are fully flexible. Furthermore, unlike the medium- to long-run neutral interest rate, this short-run neutral rate is thought to be influenced by temporary macroeconomic shocks; therefore, the estimates have been shown to be quite volatile and cyclical. That is, they fall in recessions and rise during expansions. Some consider the gap between the actual short-term real interest rate and the hypothetical short-run neutral interest rate an appropriate measure of the policy stance. A complementary approach to measuring the policy stance is to compute the gap between the actual short-term interest rate and the medium-run to long-run neutral interest rate. Most of the academic literature, including the seminal work of Laubach and Williams (2003) and the Zaman model, focuses on the latter, so this Economic Commentary focuses on the medium-run neutral interest rate. Return to 1
- For example, see Hamilton et al. (2016). Return to 2
- The parameter governing the relationship between r-star and g-star is estimated to be 0.65. That is, a 1 percentage point move in g-star explains a 0.65 percentage point move in r-star; in the model, the estimated equation governing r-star is defined as, r(t)*=0.65*g(t)*+D(t). Return to 3
- The probability is computed as the percentage of draws or simulations that satisfy the condition that “stance > 0.” The total number of draws is 5,000. Return to 4
- These are full-sample estimates rather than estimates computed in real time. For the sake of a fair comparison between the two models, the end point of the full-sample estimation is 2025:Q1 since at the time of writing the LW r-star estimates are available through 2025:Q1. Zaman (2024) provides a detailed assessment of the associated real-time estimates, showing them to closely track the full-sample estimates. A key reason for the improved real-time reliability of r-star estimates from Zaman’s model, relative to alternative models, is the use of long-run survey expectations data. Return to 5
Suggested Citation
Horn, Taylor N., and Saeed Zaman. 2025. “Neutral Interest Rates and the Monetary Policy Stance.” Federal Reserve Bank of Cleveland, Economic Commentary 2025-08. https://doi.org/10.26509/frbc-ec-202508
This work by Federal Reserve Bank of Cleveland is licensed under Creative Commons Attribution-NonCommercial 4.0 International

