

- Share
Consumer Inflation Expectations Across Surveys and over Time
Different survey-based measures of consumer inflation expectations have diverged in recent months. This Economic Commentary compares these measures and the survey questions underlying them. Our analysis suggests that the divergences across survey-based measures of inflation expectations can be attributed to various features and sample characteristics specific to each survey.


The views authors express in Economic Commentary are theirs and not necessarily those of the Federal Reserve Bank of Cleveland or the Board of Governors of the Federal Reserve System. The series editor is Tasia Hane. This paper and its data are subject to revision; please visit clevelandfed.org for updates.
Introduction
Inflation expectations play a crucial role in consumers’ economic decisions. For example, if consumers anticipate higher inflation in the future, they might make some purchases sooner to avoid paying higher prices later.1 Given the importance of inflation expectations for consumers’ decisions, researchers have developed multiple survey-based methods to capture those expectations. These measures differ in several ways including in the wording of questions, method of data collection, timing of survey fielding, sample composition and size, and aggregation methods.
In this Economic Commentary, we compare and contrast four measures of consumer inflation expectations over the next 12 months: the University of Michigan’s Surveys of Consumers (MSC), the New York Fed’s Survey of Consumer Expectations (SCE), the Indirect Consumer Inflation Expectations measure (ICIE) developed by researchers at the Federal Reserve Bank of Cleveland and Morning Consult, and a daily consumer survey (DCS) run by researchers at the Federal Reserve Bank of Cleveland. We reevaluate established explanations for why these measures may diverge and suggest an additional explanation: differences in the survey samples in terms of respondents’ political leanings.2
We find that the shares of self-reported political affiliations vary substantially across these surveys and over time. These shares matter for the overall inflation expectations measure calculated from each survey for two reasons. First, inflation expectations at the individual level tend to be strongly correlated with political affiliation. Second, survey samples are rarely designed to be representative of the population by political affiliation considering the highly fluid nature of the variable. Combining these factors, we show that accounting for differences in the composition of political affiliation between the survey sample and the overall population lowers the average inflation expectation in the MSC by about 2 percentage points for April 2025, slightly increases the average inflation expectation in the DCS, but has no effect on the average inflation expectation in the ICIE. Our results suggest that aligning the composition of the samples by political affiliation with that of the overall population reduces the differences across the survey measures.
Established Explanations for Divergences Across Measures
Survey-based measures of consumers’ inflation expectations differ across many dimensions that can affect their results. We examine four common explanations for why measures of inflation expectations might diverge, namely differences in question wording, in ways of asking questions, in how individual responses are aggregated, and in the sample composition.3
The four surveys we consider elicit their respondents’ inflation expectations in different ways. Both the DCS and the SCE ask specifically about expected inflation over the next 12 months, while the MSC asks about expected price changes during the next 12 months. The ICIE elicits inflation expectations “indirectly” by asking consumers to consider their expectations about developments in the prices of goods and services during the next 12 months and then to report how much their income would need to change to enable them to purchase the same amount of goods and services as they do today.
Differences in wording matter. For example, we randomly asked respondents in the DCS about their expectations in one of two ways, one focused on inflation and the other focused on price changes, from February through August 2024. We found that price-change-based expectations were about three-quarters of a percentage point higher on average than the inflation-based expectations, consistent with the findings of earlier work (Bruine de Bruin et al., 2012; Armantier et al., 2013). The SCE collects information on each individual’s point inflation forecast, which is the specific value a respondent expects the future inflation rate to be, and their density inflation forecast, which is based on the probability that they assign to different inflation outcomes. These two forecasts do not always align.
In addition to using different language in their questions, these surveys also use different methods to collect the data. The DCS, the SCE, and the ICIE are internet-based surveys. The MSC was conducted over the phone until gradually transitioning to an internet-based survey between April and July 2024. In parallel testing between 2020 and 2024, the MSC found that although inflation expectations collected online were closely aligned with those collected by phone in the first half of the testing period, those collected online were on average a few percentage points higher in the second half of the testing period (Surveys of Consumers, 2024). The MSC asks respondents who expect prices to change by 5 percent or more to confirm their response, at which point they have the opportunity to revise their response. Bruine de Bruin et al. (2017) found that when all respondents have this opportunity to change their response, those who do so tend to use it to revise down their expectations.4
Each survey aggregates individual inflation expectations in different ways to provide “the” measure of inflation expectations for reporting purposes. The ICIE takes the mean after trimming responses below and above the 10th and 90th percentiles, respectively.5 The MSC reports the median across respondents. Using the individual density forecasts rather than the point estimates, the SCE reports the median of the means of the probability distributions that the SCE fits to each respondent’s probabilistic inflation expectations. The DCS calculates Huber-weighted means for each month after first winsorizing at the 5th and 95th percentiles.
Figure 1 plots the primary measures of inflation expectations over the next 12 months from each of these four surveys. To increase comparability across series, we add to the standard MSC measure the corresponding measure calculated using the mean of the individual responses—in the “MSC (mean)” line—instead of the median. Because the other series are based on point forecasts instead of density forecasts, the “SCE (point)” line reports the median across the individual point forecasts.6
Although these surveys experienced a relatively similar rise and fall pattern in the years preceding 2024, they have shown a greater divergence since then.7 In particular, inflation expectations measured by the MSC and the DCS have increased substantially compared to at the end of 2024, whereas those measured by the ICIE and the SCE have remained relatively flat.
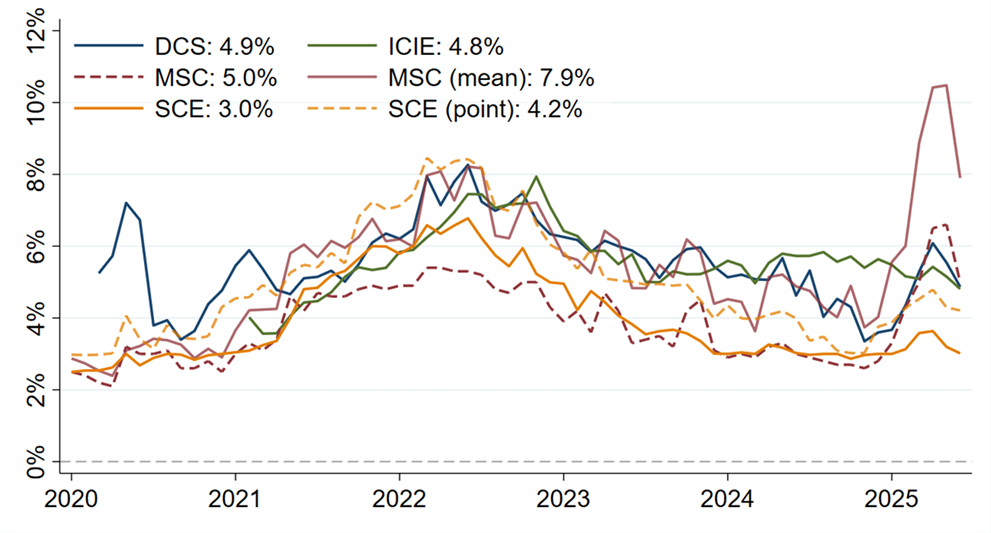
Sources: Federal Reserve Bank of Cleveland, Morning Consult, SCE, MSC, authors’ calculations
Notes: MSC (mean) is the average across individual responses. SCE (point) is the median across individual point expectations.
Another difference between the SCE and the other measures is that the SCE is a panel for which consumers are typically interviewed in 12 consecutive months.8 Therefore, as outlined in Coibion and Gorodnichenko (2025), the learning effects documented in Kim and Binder (2023) may lead to lower reported values for inflation expectations in the SCE compared with in other surveys for which new consumers are recruited for each wave.
A Novel Explanation for Diverging Estimates
We now turn to another potential source of the differences across measures of inflation expectations: the composition of the underlying survey sample by political affiliation. While the factors reviewed above remain important, we find that the differences among the surveys in the self-reported political composition of their samples have been an important factor in the recent divergence in measures of inflation expectations.
Although survey samples attempt to be representative of the general population, they usually do so by focusing on directly observable and stable characteristics like age, gender, income, and education. However, some characteristics—like political views—may be difficult to observe in the population, even if they are easy to ask about in a survey. Other research has shown that political leanings play an important role in the formation of individuals’ inflation expectations (Binder, Kamdar, and Ryngaert, 2024; DiGiuseppe, Garriga, and Kern, 2025). Thus, differences in the political composition of each survey’s sample may help explain the differences between their measures of inflation expectations.
To test this possibility, we first plot each survey’s share of self-reported political views over time. As Figure 2 shows, the shares of self-reported political leanings differ meaningfully across surveys, with the main differences occurring in 2024 and 2025. The share of the DCS sample identifying as a Democrat, for example, decreased from 40 percent at the end of 2023 to 30 percent by mid-2025, while the share identifying as a Republican increased by a similar amount during this period; the shares of respondents by self-reported political affiliation follow similar trends in the ICIE. By contrast, in the MSC, the share identifying as a Democrat increased from 30 to 35 percent over the same period, while the share identifying as a Republican decreased by a similar amount. Looking across surveys, the shares of self-reported political leanings can differ in a meaningful way from each other.
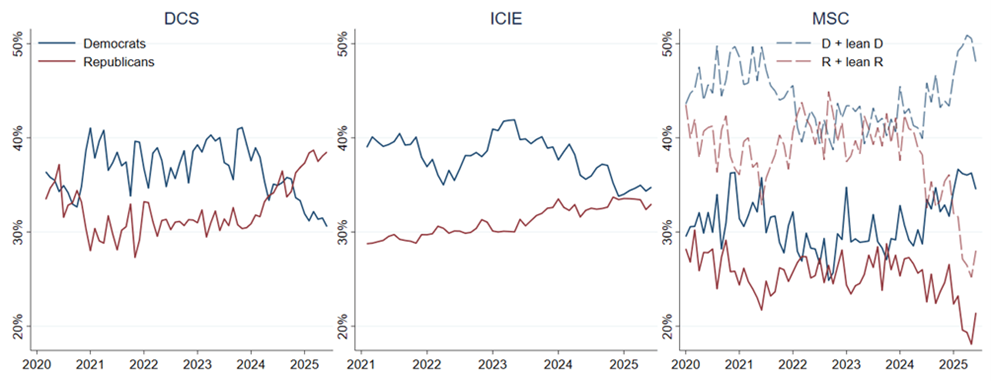
Sources: Federal Reserve Bank of Cleveland, Morning Consult, MSC, authors’ calculations
Note: The “D + lean D” and “R + lean R” dashed lines in the MSC panel include respondents who initially identified as independents but later reported leaning toward Democrats or Republicans, respectively.
Given the clear variation in self-reported political affiliations both over time and across surveys, we next test whether this variation can help explain the recent divergence in measures of inflation expectations. To do this, we first calculate monthly inflation expectations by political affiliation for each survey. The resulting time series are shown in Figure 3. Although within-survey disagreement by political affiliation is small in the ICIE sample, the average inflation expectations of respondents who identified as Democrats in the MSC sample exceeded those of respondents who identified as Republicans by more than 10 percentage points in April 2025.9 The DCS sample also found that Democrats reported higher average inflation expectations than Republicans in recent months, although the margin was half as large as that in the MSC.
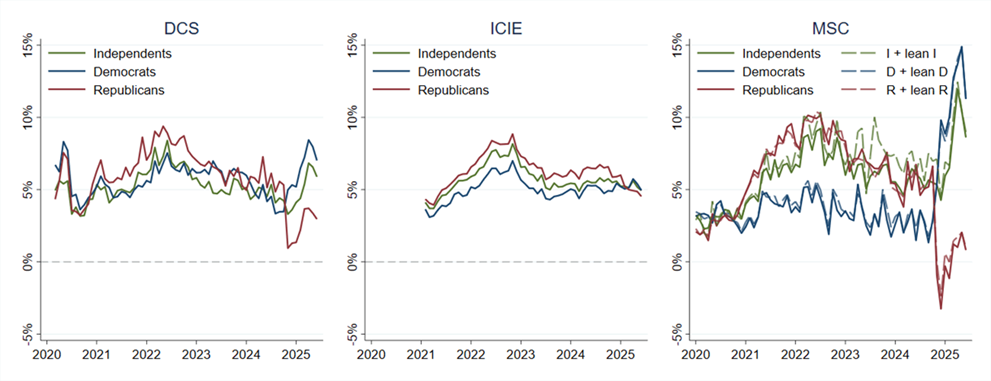
Sources: Federal Reserve Bank of Cleveland, Morning Consult, MSC, authors’ calculations
Note: Independents include all individuals who did not self-identify as a Democrat or a Republican.
Finally, we recalculate monthly inflation expectations by taking a weighted average of the inflation expectations by self-reported political affiliation within each month, using as the weights the shares of the population identifying as a Democrat, a Republican, or an independent as measured by Gallup.10 The resulting reweighted time series, shown alongside the originals in Figure 4, effectively controls for the differences in political affiliation among survey samples by bringing the political affiliation shares of each survey into alignment with the political affiliation of the overall population as measured by Gallup.
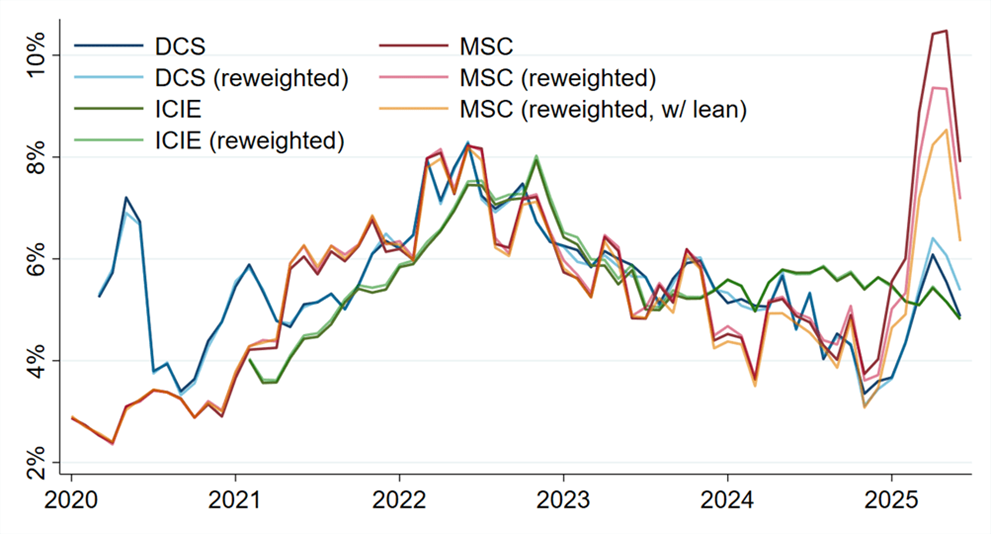
Sources: Federal Reserve Bank of Cleveland, Morning Consult, MSC, authors’ calculations
Although reweighting generally makes only a small difference for each survey most of the time, it makes a more significant difference for the MSC beginning around the US presidential election in November 2024. Since then, reweighting along observed political affiliation shares lowers the mean point expectation from the MSC by roughly a whole percentage point; including those who “lean” toward one party or the other lowers the mean point expectation by yet another percentage point.11 This may not be surprising given that the MSC sample was the only one in which the share of Democrats rose and that of Republicans fell (as shown in Figure 2) and that the average inflation expectations of Democrats in the MSC have recently exceeded those of Republicans by a greater margin than in the ICIE and DCS (as shown in Figure 3). Reweighting with Gallup’s measure of the overall population’s political affiliation shares effectively puts more weight on the lower inflation expectations of the Republicans in the MSC. That we observe such a difference after reweighting confirms that political affiliation is an important driver of recent divergences across measures of consumer inflation expectations.
Conclusion
This Economic Commentary shows that substantial divergences—including those observed in recent months—can occur across survey-based measures of consumer inflation expectations. Some of these divergences can be attributed to differences in question wording and in methods of aggregating individual inflation expectations in these surveys. In a new finding, we show that the sample composition by political affiliation varies substantially across surveys and over time and that these shares matter for aggregate inflation expectations. For example, accounting for differences in the composition of political affiliation between the survey sample and the overall population lowers the average inflation expectations in the MSC by roughly 2 percentage points for April 2025. As a result, our findings suggest that accounting for political affiliation differences between the sample and the population diminishes the current divergences across surveys.
References
- Armantier, Olivier, Wändi Bruine de Bruin, Simon Potter, Giorgio Topa, Wilbert van der Klaauw, and Basit Zafar. 2013. “Measuring Inflation Expectations.” Annual Review of Economics 5 (August): 273–301. https://doi.org/10.1146/annurev-economics-081512-141510.
- Binder, Carola Conces, Rupal Kamdar, and Jane M. Ryngaert. 2024. “Partisan Expectations and COVID-Era Inflation.” Journal of Monetary Economics 148 (Supplement): 103649. https://doi.org/10.1016/j.jmoneco.2024.103649.
- Bruine de Bruin, Wändi, Wilbert van der Klaauw, Maarten van Rooij, Federica Teppa, and Klaas de Vos. 2017. “Measuring Expectations of Inflation: Effects of Survey Mode, Wording, and Opportunities to Revise.” Journal of Economic Psychology 59 (April): 45–58. https://doi.org/10.1016/j.joep.2017.01.011.
- Bruine de Bruin, Wändi, Wilbert van der Klaauw, Giorgio Topa, Julie S. Downs, Baruch Fischhoff, and Olivier Armantier. 2012. “The Effect of Question Wording on Consumers’ Reported Inflation Expectations.” Journal of Economic Psychology 33 (4): 749–57. https://doi.org/10.1016/j.joep.2012.02.001.
- Coibion, Olivier, and Yuriy Gorodnichenko. 2025. “Inflation, Expectations, and Monetary Policy: What Have We Learnt and at What End?” Mimeo.
- Coibion, Olivier, Yuriy Gorodnichenko, Edward S. Knotek II, and Raphael S. Schoenle. 2023. “Average Inflation Targeting and Household Expectations.” Journal of Political Economy Macroeconomics 1 (2): 403-446. https://doi.org/10.1086/722962.
- Coibion, Olivier, Yuriy Gorodnichenko, and Michael Weber. 2022. “Monetary Policy Communications and Their Effects on Household Inflation Expectations.” Journal of Political Economy 130 (6): 1537–84. https://doi.org/10.1086/718982.
- DiGiuseppe, Matthew, Ana Carolina Garriga, and Andreas Kern. 2025. “Partisan Bias in Inflation Expectations.” MPRA Paper No. 124391. University Library, Ludwig-Maximilians-Universität München. https://mpra.ub.uni-muenchen.de/id/eprint/124391.
- Gennaioli, Nicola, Marta Leva, Raphael S. Schoenle, and Andrei Shleifer. 2024. “How Inflation Expectations De-Anchor: The Role of Selective Memory Cues.” Working Paper No. 32633. National Bureau of Economic Research. https://doi.org/10.3386/w32633.
- Hajdini, Ina, Edward S. Knotek II, John Leer, Mathieu Pedemonte, Robert W. Rich, and Raphael S. Schoenle. 2023. “Low Passthrough from Inflation Expectations to Income Growth Expectations: Why People Dislike Inflation.” Working Paper No. 22-21R. Federal Reserve Bank of Cleveland. https://doi.org/10.26509/frbc-wp-202221r.
- Hajdini, Ina, Edward S. Knotek II, John Leer, Mathieu Pedemonte, Robert W. Rich, and Raphael S. Schoenle. 2024. “Indirect Consumer Inflation Expectations: Theory and Evidence.” Journal of Monetary Economics 145 (July): 103568. https://doi.org/10.1016/j.jmoneco.2024.103568.
- Hajdini, Ina, Edward S. Knotek II, Mathieu Pedemonte, Robert W. Rich, John Leer, and Raphael S. Schoenle. 2022. “Indirect Consumer Inflation Expectations.” Economic Commentary, no. 2022-03 (March). https://doi.org/10.26509/frbc-ec-202203.
- Kim, Gwangmin, and Carola Binder. 2023. “Learning-through-Survey in Inflation Expectations.” American Economic Journal: Macroeconomics 15 (2): 254–78. https://doi.org/10.1257/mac.20200387.
- Knotek, Edward S., II, Raphael S. Schoenle, Alexander M. Dietrich, Keith Kuester, Gernot J. Müller, Kristian Ove R. Myrseth, and Michael Weber. 2020. “Consumers and COVID-19: A Real-Time Survey.” Economic Commentary, no. 2020-08 (April). https://doi.org/10.26509/frbc-ec-202008.
- Surveys of Consumers. 2024. “Technical Report: Comparisons of Variables Collected by Phone and Web, January 2017 - May 2024.” University of Michigan. https://data.sca.isr.umich.edu/fetchdoc.php?docid=75438.
Endnotes
- Coibion, Gorodnichenko, and Weber (2022) show that households increase spending in response to higher inflation expectations. Other papers have documented the importance of inflation expectations for consumer decisions in the labor market. For instance, a rise in consumers’ inflation expectations increases the likelihood that they will search for a job that pays more, as shown in Hajdini et al. (2023). Return to 1
- See Knotek et al. (2020) and Coibion et al. (2023) for further details on the DCS, and see Hajdini et al. (2022, 2024) for further details on the ICIE. Return to 2
- By focusing our analysis on expected inflation over the next year, we avoid differences in time horizons across surveys in this analysis. Return to 3
- We observe a similar tendency to revise downward in an experiment using the DCS conducted between May and July 2025, but we find that only a small fraction of respondents (about 5 percent) choose to revise their expectations when prompted. However, only respondents who initially reported that they expected inflation greater than or equal to 20 percent were given the opportunity to revise compared to the 5 percent threshold in the MSC and the universal opportunity in the Bruine de Bruin et al. (2017) experiment. Return to 4
- The ICIE is a weekly series based on weekly data, while the other series are monthly. For this Economic Commentary, we trim and calculate the mean using the observations within a given month to compare with the other series. Return to 5
- We do not include the SCE in most of our subsequent analysis because of the publication lag of its microdata, which prevents the calculation of recent means across individuals’ point forecasts. Return to 6
- While Figure 1 focuses on a short time series history, the volatility of inflation expectations has generally increased since the recent inflation surge, as suggested, for example, by models of memory and recall in Gennaioli et al. (2024). Return to 7
- Most participants in the MSC are also reinterviewed after six months. Because of larger gaps between interviews, the learning effects are less of a concern in the MSC than in the SCE (Kim and Binder, 2023). Return to 8
- We note that sample sizes may also be playing a role in the recent differences across surveys. The ICIE results are based on responses from 30,000 to 40,000 consumers per month on average, while the DCS collects responses from roughly 1,500 to 6,000 consumers per month. While the MSC in the past comprised approximately 600 consumers per month, it increased its response count to 900 to 1,000 with the transition to internet-based sampling. Return to 9
- Data are from https://news.gallup.com/poll/15370/party-affiliation.aspx. The data are annual and run through 2024; we use the 2024 values for 2025. We use the table “Americans’ Party ID” to reweight by political affiliation without reclassifying independents who “lean” toward one party or the other. When reclassifying these independents as the party they “lean” toward, we use the shares reported in the table “Americans’ Leaned Party ID” as weights. Return to 10
- We find a similar, albeit smaller, effect when reweighting at the micro level to calculate the median point expectation. The median falls by approximately 0.1 percentage point in June 2025 after reweighting, regardless of whether we reassign independents who “lean” toward either party. In April 2025, by comparison, the median fell by approximately 0.4 percentage points after reweighting and by 0.5 percentage points when reassigning independents who lean toward either party. Return to 11
Suggested Citation
Hajdini, Ina, Edward S. Knotek II, John Leer, Mathieu Pedemonte, Damjan Pfajfar, Raphael S. Schoenle, and Taylor Shiroff. 2025. “Consumer Inflation Expectations Across Surveys and over Time.” Federal Reserve Bank of Cleveland, Economic Commentary 2025-07. https://doi.org/10.26509/frbc-ec-202507
This work by Federal Reserve Bank of Cleveland is licensed under Creative Commons Attribution-NonCommercial 4.0 International


Center for Inflation Research
The Center for Inflation Research helps policymakers, researchers, industry professionals, and the informed public better understand inflation. Explore commentary, research, and analysis on inflationary trends, and find out about upcoming inflation-related events.

About Us
The Federal Reserve Bank of Cleveland (commonly known as the Cleveland Fed) is part of the Federal Reserve System, the central bank of the United States.
Research
The Cleveland Fed’s Research Department develops a broad range of data, indicators, and analysis to keep audiences informed about inflation and other economic trends.