

- Share
Underemployment Following the Great Recession and the COVID-19 Recession

The views authors express in Economic Commentary are theirs and not necessarily those of the Federal Reserve Bank of Cleveland or the Board of Governors of the Federal Reserve System. The series editor is Tasia Hane. This paper and its data are subject to revision; please visit clevelandfed.org for updates.
People working part-time who would prefer to be working full-time comprise a large group in the United States. These people may be referred to as working “part time for economic reasons,” “involuntarily part-time,” or “underemployed.”1 Since 1994, there has been an average of 5.4 million underemployed workers in the United States, rising to more than 9 million during the 2008–2009 Great Recession and to more than 10 million in the 2020 recession caused by the SARS-CoV-2 (COVID-19) pandemic.
In this Commentary, we study the behavior of US underemployment during recent business cycles. In particular, we focus on the underemployment rate, the percent of employed people who are working part-time but prefer to be working full-time.2 The underemployment rate moves closely with the unemployment rate, rising in recessions and falling in expansions. Consistent with earlier research, we show that the underemployment rate shifted up when compared to the unemployment rate during and following the Great Recession.3 However, we also document a more recent phenomenon, that the underemployment rate has shifted back down after the COVID-19 recession. That is, the unemployment and underemployment rates are now at levels consistent with their pre-2008 behavior.
Earlier research suggested that changes in industry composition, or the number of employees in each industry compared to the total economy, could explain the persistently elevated underemployment following the Great Recession.4 Because changes in industry composition reflect changes to the structure of the economy, an implication of this prior research is that elevated underemployment may be a near-permanent feature of the economy. We build on this earlier research by studying the effects of industry composition following both the Great Recession and the COVID-19 recession. We decompose changes in the total underemployment rate into changes in industry-specific underemployment rates (holding employment shares constant) and changes in industry-specific employment shares (holding underemployment rates constant). In contrast to earlier research, we find that changes in industry composition do not account for the increase in the underemployment rate following the Great Recession. We also find that changes in industry composition do not account for the decrease in the underemployment rate following the COVID-19 recession. Because of this finding, we would not expect the underemployment rate to revert back to its pre-COVID-19 levels if the industry composition reverts back to its pre-COVID-19 structure.
The shifts in underemployment that we document have potentially important monetary policy implications for the Federal Open Market Committee’s (FOMC) assessments of labor market conditions. In 2014, then-Chair of the Federal Reserve Janet Yellen noted that elevated underemployment following the Great Recession meant that the unemployment rate alone may understate the amount of labor market slack in the economy.5 Following the COVID-19 recession, the underemployment rate has dropped across most industries, a situation suggesting that the underemployment rate may not currently be a source of additional labor market slack. These changes in the underemployment rate suggest that it could be useful in assessing the labor market and the FOMC’s maximum employment objective.
The underemployment rate and its behavior over recent business cycles
Every month, the Bureau of Labor Statistics (BLS) surveys about 60,000 households in the United States, asking many questions about employment and labor force status.6 Using responses to this survey, the BLS estimates both the number of people who are employed and who are underemployed. In this Commentary, we use BLS data and survey responses to study the underemployment rate: the percent of employed workers who are underemployed.
Figure 1 shows the underemployment rate from January 1994 to November 2021.7 For comparison purposes, Figure 1 also shows the unemployment rate, the percent of people in the labor force who are unemployed, a number which is a popular measure of labor market health. The two rates move closely together, rising in recessions and typically falling in expansions. They both rose to high levels during the Great Recession, and they both spiked in April 2020 because of lockdowns associated with the COVID-19 pandemic. Both the underemployment and unemployment rates began dropping after the Great Recession and the COVID-19 recession, with the drops after the COVID-19 recession being more rapid than after the Great Recession.
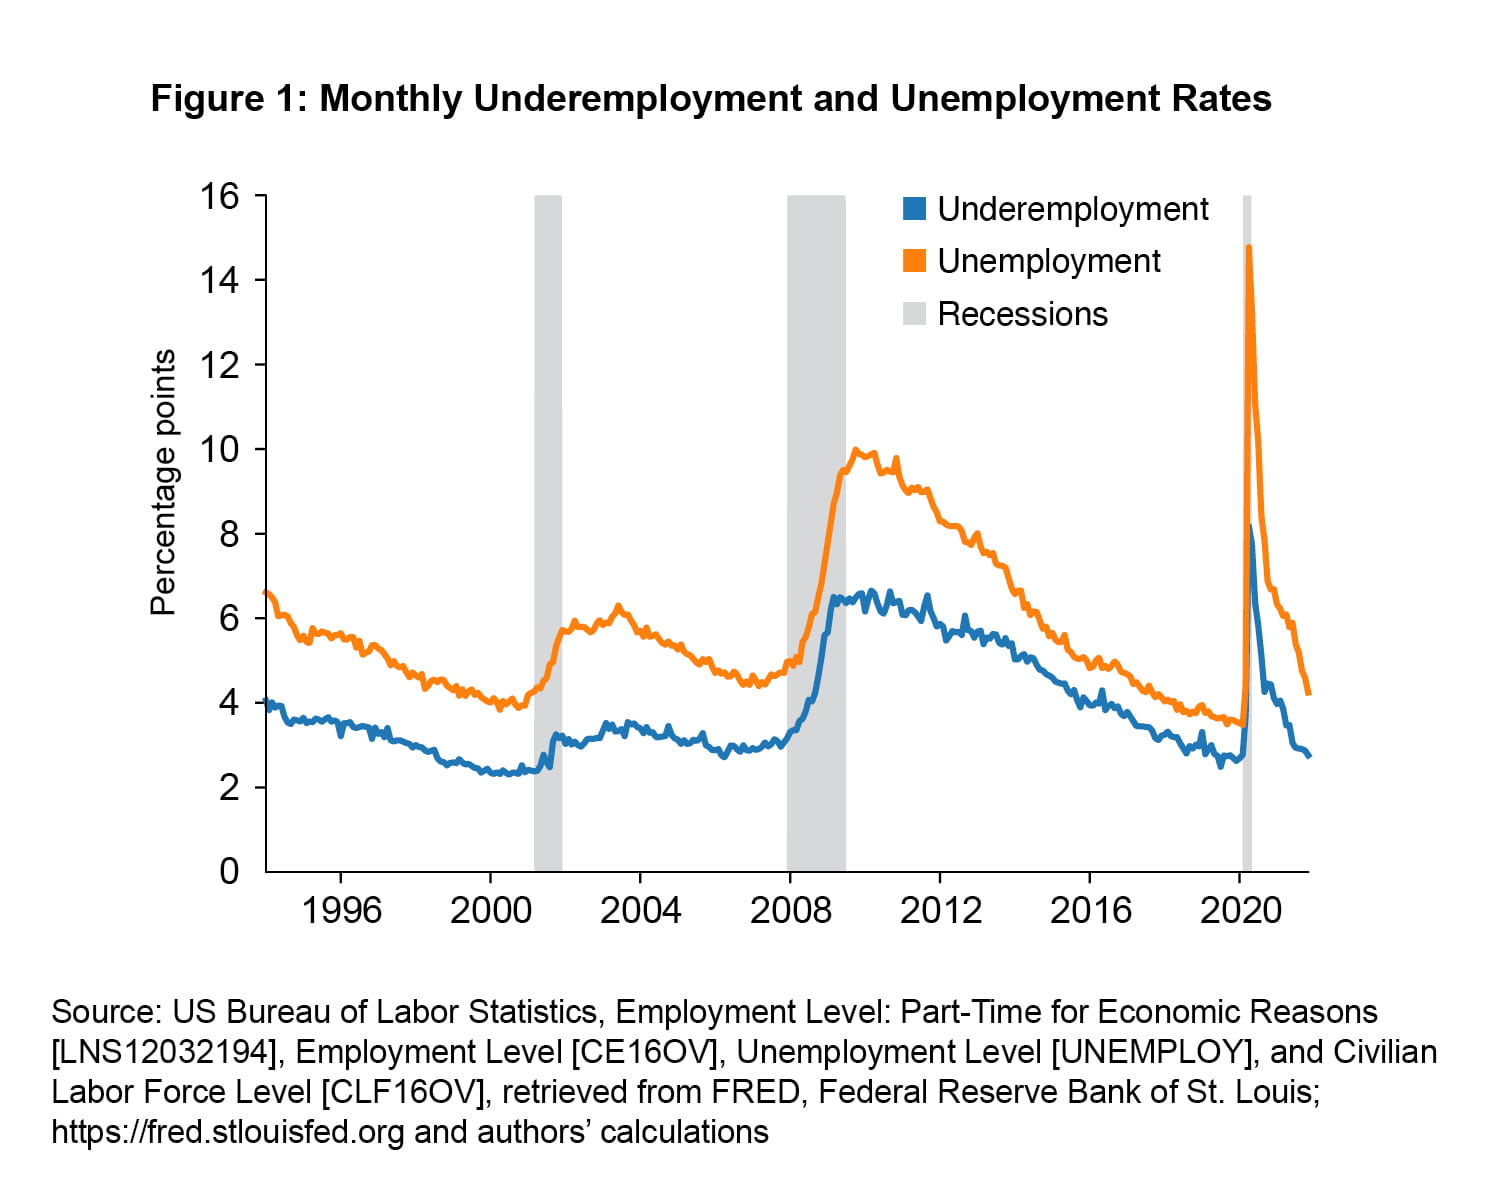
We now highlight three features of the underemployment and unemployment rates in Figure 1. First, from 1994 to 2007, the unemployment rate was between 1.4 percentage points and 3.0 percentage points above the underemployment rate, averaging 2.0 percentage points above the underemployment rate during this sample.
Second, the unemployment rate fell more quickly in the expansion after the Great Recession than did the underemployment rate. From January 2014 to February 2020, the month before the World Health Organization declared COVID-19 a global pandemic, sparking the COVID-19 recession, the unemployment rate was between 0.5 percentage points and 1.6 percentage points above the underemployment rate, averaging only 1.0 percentage points above the underemployment rate during this sample. In other words, the underemployment rate was elevated compared to the unemployment rate for more than a decade following the Great Recession. This elevated level of underemployment suggests that the unemployment rate may have been understating labor market slack after the Great Recession (Yellen, 2014).
Third, the underemployment rate has fallen sharply since the COVID-19 recession. As of November 2021, it is at 2.8 percentage points and is similar to levels observed late in economic expansions, such as in 1998, 2006, and 2019. On average from January 2021 to November 2021, the unemployment rate was 2.2 percentage points above the underemployment rate, a difference which is more consistent with the gap observed from 1994–2007 than that after the Great Recession.
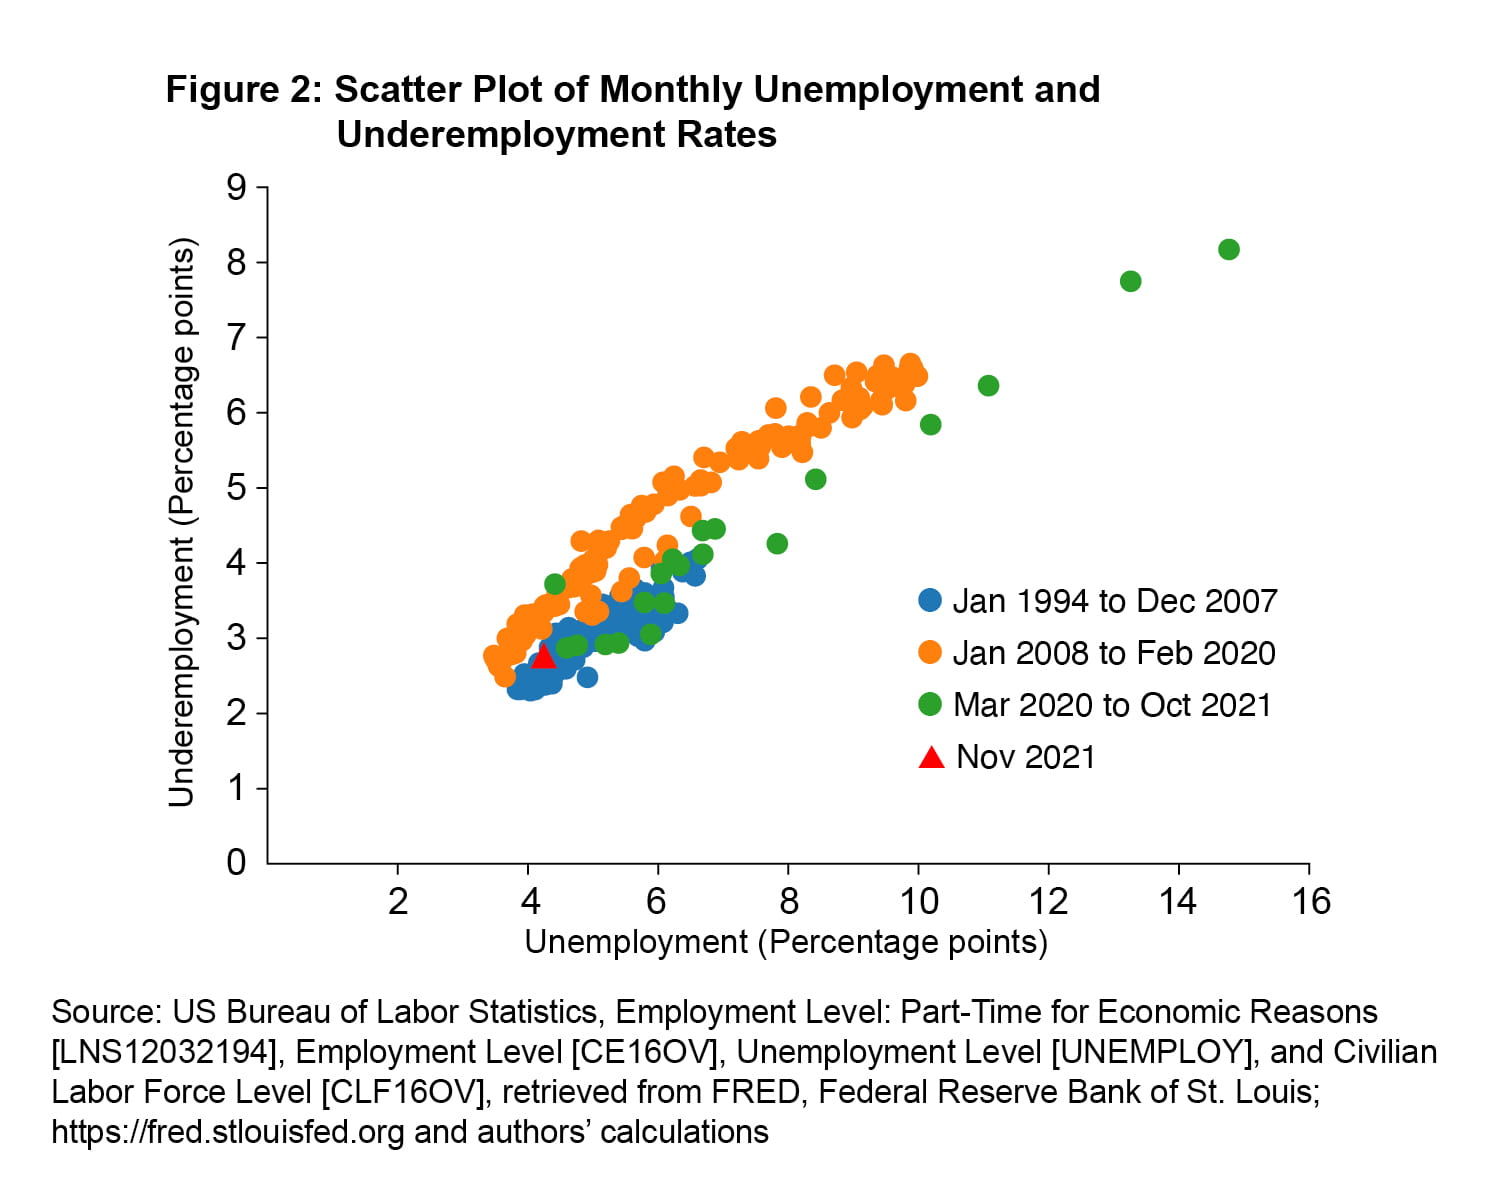
To highlight these features, we also show the monthly unemployment and underemployment rates as a scatter plot in Figure 2 using different colors to represent different time periods. Figure 2 shows an upward shift in the underemployment rate from the January 1994–December 2007 period to the January 2008–February 2020 period, with the collection of orange dots mostly being above the collection of blue dots. This upward shift is another way of seeing that the underemployment rate was persistently elevated compared to the unemployment rate following the Great Recession.8 The March 2020–October 2021 period, shown with green dots, shifts back down and appears more consistent with January 1994–December 2007 than with January 2008–February 2020.9 This downward shift represents the rapid fall in the underemployment rate compared to the unemployment rate after the COVID-19 recession. November 2021 is highlighted with a red triangle and shows that the current underemployment rate is more consistent with levels from January 1994–December 2007 than from January 2008–February 2020.
The results presented so far indicate that the underemployment rate was unusually high compared to the unemployment rate following the Great Recession; however, they do not address why this is the case. In the next section, we study one hypothesis: the change in industry structure. If following the Great Recession employment shifted into industries with generally higher rates of underemployment, then the underemployment rate could have become persistently higher. Further, if high-underemployment industries such as retail trade and leisure and hospitality were disrupted by COVID-19, then it is possible that the currently low underemployment rate could rise when these industries recover.
Underemployment rate by industry
We begin our study of industry structure by showing the underemployment rates across industries at different points in time in Table 1.10 Table 1 also shows the total unemployment and underemployment rates. We use averages of Q2 and Q3 data for 2004, 2015, and 2021 in Table 1 for three reasons. First, the total unemployment rate is similar in each of these periods, allowing us to essentially hold it constant when comparing underemployment rates. Second, using the same quarters in each of these years minimizes the effects of seasonality for our underemployment rates, which are not seasonally adjusted for the industries. Third, averaging over multiple quarters can smooth through noise in the monthly survey data.
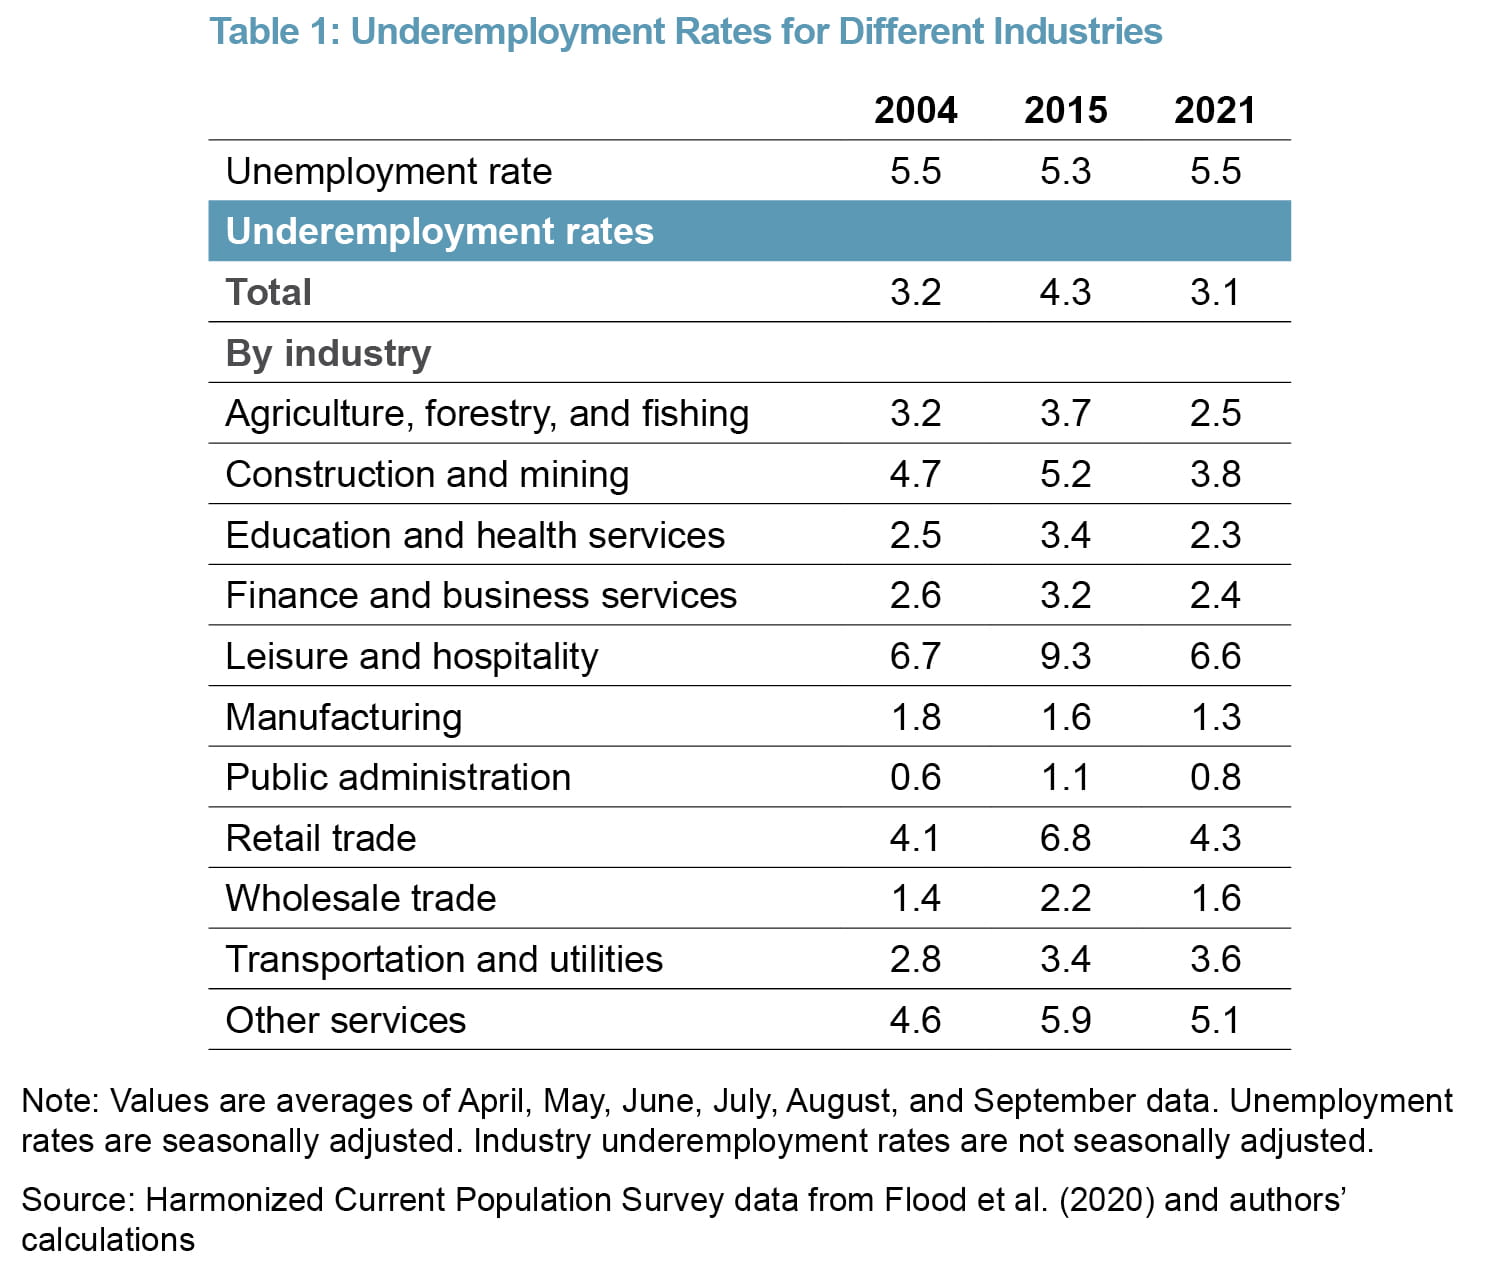
We highlight three results in Table 1. First, the total underemployment rate is about 1 percentage point higher in 2015 compared to the other periods in Table 1. This is consistent with the upward shift in the underemployment rate compared to the unemployment rate in the January 2008–February 2020 period discussed in the previous section. Second, there can be consistently large differences in underemployment rates across industries. For example, leisure and hospitality, retail trade, and other services have higher underemployment rates than manufacturing and wholesale trade in all periods listed in Table 1. Third, the underemployment rate can vary within each industry over time, and underemployment rates were higher across most industries in 2015 than in other periods shown in Table 1.
Next, we show employment shares, or the fraction of total employees working within a particular industry, in Table 2 for the same time periods as shown in Table 1. We highlight two results from Table 2. First, there is substantial variation in employment share across industry. For example, education and health services is between 6 and 10 times as large as wholesale trade depending on the time period. Second, employment shares of a given industry can change over time. In particular, the employment share of leisure and hospitality (a high-underemployment rate industry) rose from 2004 to 2015, while the employment share of manufacturing (a low-underemployment rate industry) fell from 2004 to 2015. Also, the employment shares of both leisure and hospitality and retail trade (high-underemployment rate industries) are lower in 2021 than in 2015.
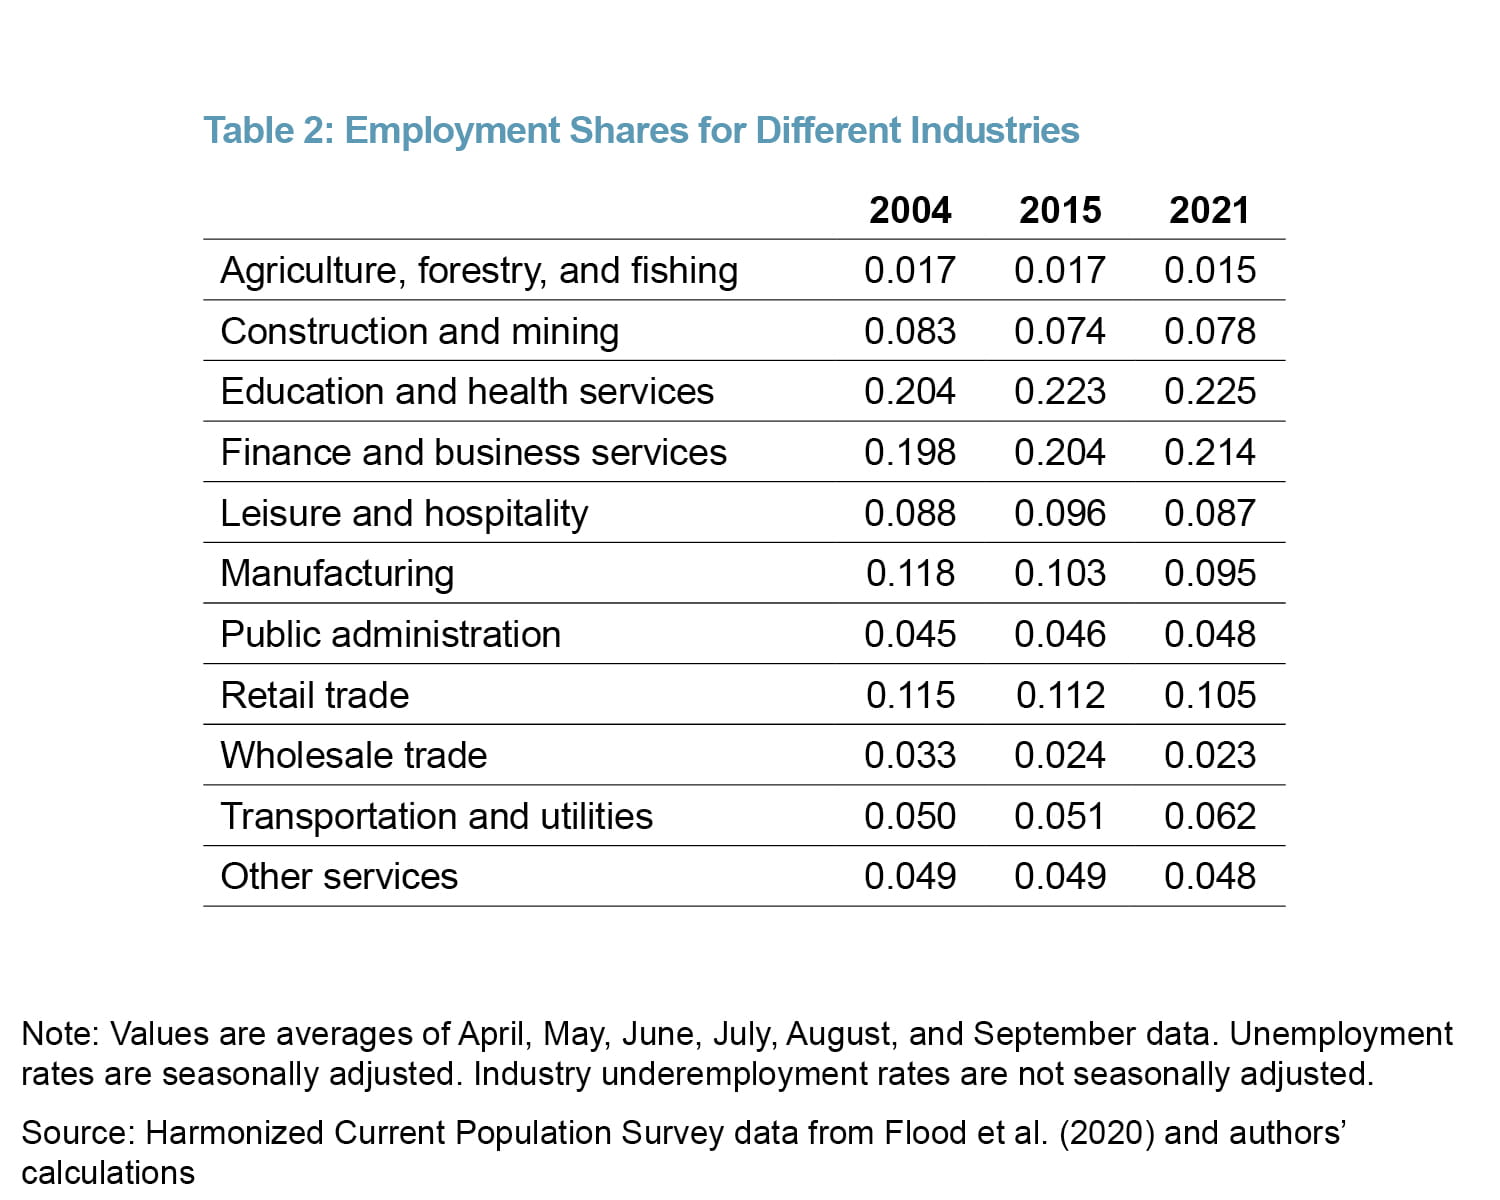
The total underemployment rate can be computed as a weighted average of the industry underemployment rates from Table 1, in which employment shares from Table 2 act as the weights. Using this weighted average, we can then decompose the change in the total underemployment rate into two components.11 The first component is the change in the underemployment rate in each industry, multiplied by an employment share that is held constant. We call this the “underemployment rate contribution.” The second component is the change in the employment share of each industry multiplied by an underemployment rate that is held constant. We call this “employment share contribution.”
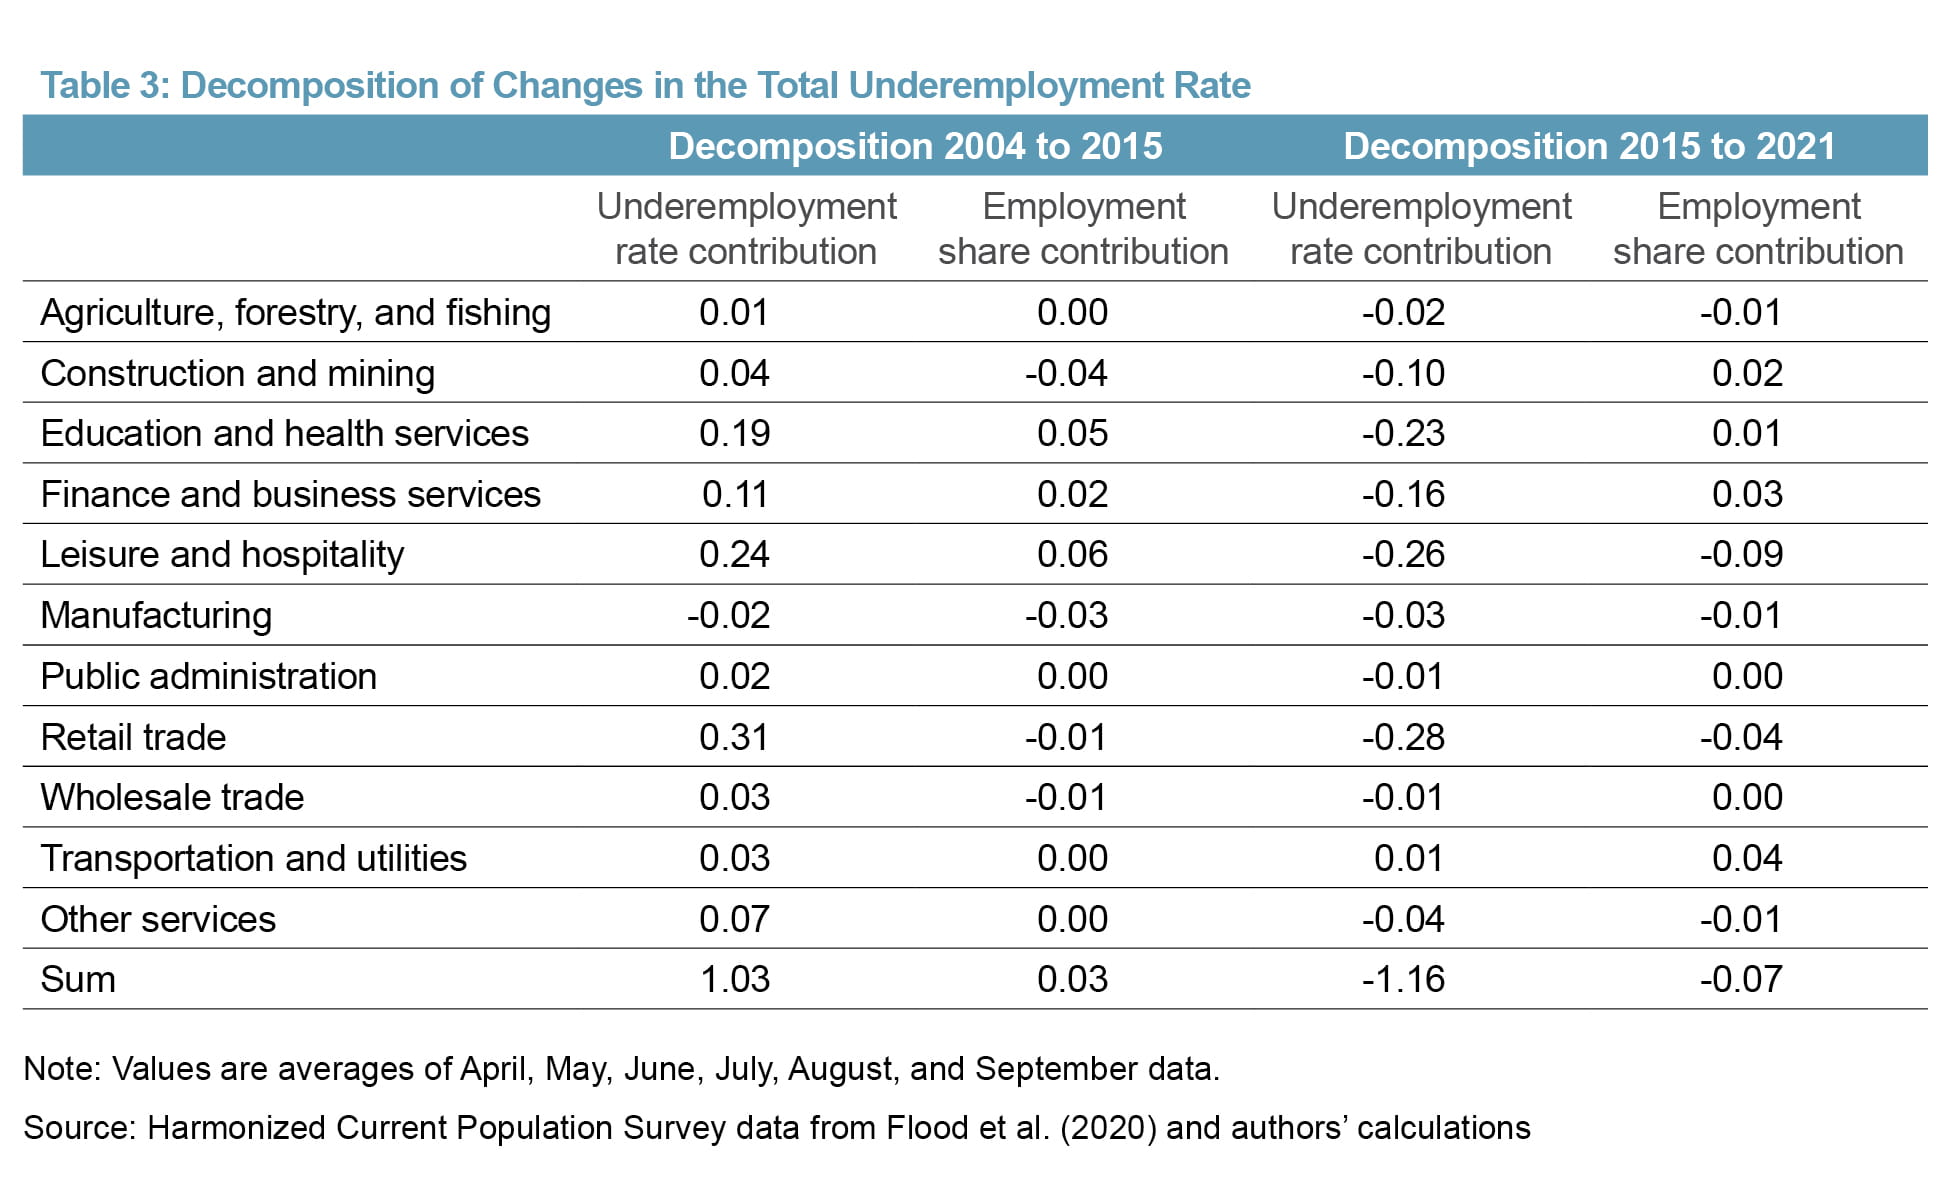
Table 3 shows the results of the decomposition of the change in the underemployment rate from 2004 to 2015 and from 2015 to 2021. For each decomposition, Table 3 has a column for the underemployment rate contribution and for the employment share contribution. The sums in Table 3 show that the underemployment rate contributions account for the vast majority of the 1.1 percentage point underemployment rate increase from 2004 to 2015 and 1.2 percentage point drop in the underemployment rate from 2015 to 2021. While the employment share contribution is positive from 2004 to 2015 and negative from 2015 to 2021, the magnitudes are small: less than 0.1 percentage point in both cases. In other words, changes in industry composition account for essentially none of the change in the total underemployment rate from 2004 to 2015 or from 2015 to 2021. Because of this finding, we do not expect the underemployment rate to revert back to its levels following the Great Recession if industry-specific employment shares revert back to the 2015 levels shown in Table 2.
Our findings leave open the question of why underemployment was persistently elevated following the Great Recession. The decomposition in Table 3 indicates that about half of the increase can be accounted for by increases in underemployment rates within the leisure and hospitality and retail trade industries. Earlier research provides evidence that some underemployment increases in these sectors may be due to the Affordable Care Act.12 However, this research does not address why underemployment has come down in these sectors since the COVID-19 recession.
Other earlier research has compared how often workers transition from full-time and voluntary part-time employment into unemployment and underemployment.13 This research finds that worker transitions into unemployment fell to low levels by 2015 but that worker transitions into underemployment remained elevated in 2015. In other words, relatively few workers were becoming unemployed by 2015, but a relatively large number of workers were becoming underemployed in 2015. However, these transition data have not been extended to study the months following the COVID-19 recession.
Conclusion
The underemployment rate, the percent of employed people who are working part-time but prefer to be working full-time, moves closely with the unemployment rate, rising in recessions and falling in expansions. Following 2008–2009’s Great Recession, the underemployment rate stayed persistently high when compared to the unemployment rate. However, following 2020’s COVID-19 recession, the underemployment rate fell sharply compared to the unemployment rate, and the underemployment rate is now consistent with its pre-2008 levels.
The persistent increase in underemployment following the Great Recession indicates that the unemployment rate alone may have understated the amount of labor market slack in the economy (Yellen, 2014). However, the large drop in underemployment following the COVID-19 recession suggests that the labor market may be tighter than indicated by the unemployment rate alone.
This Commentary examines whether changes in industry composition account for changes in the underemployment rate, and we find that essentially none of the change in the underemployment rate following either the Great Recession or the COVID-19 recession can be accounted for by changes in industry composition. As such, we do not expect the underemployment rate to revert back to its pre-COVID-19 levels if the industry composition reverts back to its pre-COVID-19 structure.
Footnotes
- For example, the Bureau of Labor Statistics uses “part time for economic reasons.” See https://www.bls.gov/cps/definitions.htm#pter. Valletta and Bengali (2013), Cajner et al. (2014), Valletta and van der List (2015), and Valletta et al. (2020) use “involuntary part-time.” Sum and Khatiwada (2010), Blanchflower and Levin (2015), and Bell and Blanchflower (2018) use “underemployed.” Return to 1
- Dividing underemployment by total employment controls for trends in the data, such as population or total employment growth, and makes the data more comparable over time. The underemployment rate we use is also used, for example, in Sum and Khatiwada (2010), Blanchflower and Levin (2015), and Valletta et al. (2020). Return to 2
- Valletta and Bengali (2013), Cajner et al. (2014), Blanchflower and Levin (2015), Valletta and van der List (2015), Bell and Blanchflower (2018), and Valletta et al. (2020) all document persistently high levels of underemployment following the Great Recession. In a 2014 speech, then-Chair of the Federal Reserve Janet Yellen also noted the elevated level of unemployment compared to the unemployment rate (Yellen, 2014). Return to 3
- See Valletta et al. (2020). Return to 4
- See Yellen (2014). Related to this idea that underemployment is important for fully understanding the amount of labor market slack, Blanchflower and Levin (2015) and Bell and Blanchflower (2018) provide evidence that elevated underemployment is associated with lower wages. In particular, Bell and Blanchflower (2018) write, “underemployment rather than unemployment lowers pay in the years after the Great Recession.” Return to 5
- This survey is known as the Current Population Survey (CPS): Current Population Survey (CPS) (bls.gov). Return to 6
- We begin our sample in 1994 because the BLS changed the definition of “underemployment” in the Current Population Survey in 1994. See Bregger and Dippo (1993) and Polivka and Rothgeb (1993) for further discussion of this and other changes to the Current Population Survey. Return to 7
- In a supplemental appendix, we test for a break in the relationship between the unemployment and underemployment rates using Andrews (1993). We find evidence of a break in January 2008, which immediately follows the National Bureau of Economic Analysis’s business cycle peak in December 2007. Return to 8
- The one green dot at the 4.4 percent unemployment rate in the collection of orange dots is March 2020. The BLS survey for this month was taken right as the COVID-19 pandemic was beginning, so this month looks more similar to January 2008 to February 2020 than to April 2020 to October 2021. Return to 9
- The industry-specific underemployment rate is the fraction of underemployed workers in an industry divided by employed workers in that industry times 100. We measure underemployment with “persons at work,” requiring workers to have worked between 1 and 34 hours in the reference week. We measure employment with “employed persons,” allowing workers to have 0 hours of work in the reference week if, for example, they are sick or on vacation. Return to 10
- This decomposition is shown in the appendix. There is also a third term in the decomposition: the change in the underemployment rate in each industry multiplied by the change in the employment share. This term is generally small, and we do not discuss it further. Return to 11
- See Dillender et al. (forthcoming). For some context, the Affordable Care Act requires larger employers to offer health insurance to employees working 30 or more hours per week, but not to employees working fewer than 30 hours per week. Hence, employers may be able to reduce healthcare costs by limiting work weeks to fewer than 30 hours. Return to 12
- See Borowczyk-Martins and Lalé (2020). Return to 13
References
- Andrews, Donald W. K. 1993. “Tests for Parameter Instability and Structural Change With Unknown Change Point.” Econometrica 61 (4): 821–56. https://doi.org/10.2307/2951764.
- Bell, David N.F., and David Blanchflower. 2018. “Underemployment in the US and Europe.” Working paper 24927. National Bureau of Economic Research. https://doi.org/10.3386/w24927.
- Bengali, Leila, and Robert G. Valletta. 2013. “What’s behind the Increase in Part-Time Work?” FRBSF Economic Letter 2013-24. https://ideas.repec.org/a/fip/fedfel/y2013iaug26n2013-24.html.
- Blanchflower, David, and Andrew Levin. 2015. “Labor Market Slack and Monetary Policy.” Working paper 21094. National Bureau of Economic Research. https://doi.org/10.3386/w21094.
- Borowczyk-Martins, Daniel, and Etienne Lalé. 2020. “The Ins and Outs of Involuntary Part-Time Employment.” Labour Economics 67 (December): 101940. https://doi.org/10.1016/j.labeco.2020.101940.
- Bregger, John E., and Cathryn S. Dippo. 1993. “Why Is It Necessary to Change?” Monthly Labor Review 116 (9): 3–9. https://www.jstor.org/stable/41844173.
- Cajner, Tomaz, Dennis Mawhirter, Christopher J. Nekarda, and David Ratner. 2014. “Why Is Involuntary Part-Time Work Elevated?” FEDS Notes 2014 (0014). https://doi.org/10.17016/2380-7172.0014.
- Dillender, Marcus, Carolyn J. Heinrich, and Susan Houseman. 2020. “Effects of the Affordable Care Act on Part-Time Employment: Early Evidence.” Journal of Human Resources, July, 0718-9623R2. https://doi.org/10.3368/jhr.57.4.0718-9623R2.
- Flood, Sarah, Miriam King, Renae Rodgers, Steven Ruggles, and J. Robert Warren. 2020. Integrated Public Use Microdata Series, Current Population Survey: Version 7.0 [dataset]. Minneapolis, MN: IPUMS, 2020. https://doi.org/10.18128/D030.V7.0.
- Polivka, Anne E., and Jennifer M. Rothgeb. 1993. “Redesigning the CPS Questionnaire.” Monthly Labor Review 116 (9): 10–28. https://www.jstor.org/stable/41844174.
- Sum, Andrew, and Ishwar Khatiwada. 2010. “The Nation’s Underemployed in the ‘Great Recession’ of 2007–09.” Monthly Labor Review, November, 3–15. https://www.jstor.org/stable/monthlylaborrev.2010.11.003.
- Valletta, Robert G., Leila Bengali, and Catherine van der List. 2020. “Cyclical and Market Determinants of Involuntary Part-Time Employment.” Journal of Labor Economics 38 (1): 67–93. https://doi.org/10.1086/704496.
- Valletta, Robert G., and Catherine van der List. 2015. “Involuntary Part-Time Work: Here to Stay?” FRBSF Economic Letter 2015-19. https://ideas.repec.org/a/fip/fedfel/00059.html.
- Yellen, Janet. 2014. “Labor Market Dynamics and Monetary Policy: A Speech at the Federal Reserve Bank of Kansas City Economic Symposium, Jackson Hole, Wyoming, August 22, 2014.” Speech 815. Board of Governors of the Federal Reserve System. https://econpapers.repec.org/paper/fipfedgsq/815.htm.
Suggested Citation
Dean Avila, Daniela, and Kurt G. Lunsford. 2022. “Underemployment Following the Great Recession and the COVID-19 Recession.” Federal Reserve Bank of Cleveland, Economic Commentary 2022-01. https://doi.org/10.26509/frbc-ec-202201
This work by Federal Reserve Bank of Cleveland is licensed under Creative Commons Attribution-NonCommercial 4.0 International

