

- Share
Expected Post-Pandemic Consumption and Scarred Expectations from COVID-19
The COVID-19 vaccination drive raises questions about the trajectory of the economic recovery and the pandemic’s impact on consumers’ longer-term behaviors. In this Commentary, we examine the evolution of consumers’ expectations for their post-crisis spending on services that have been dramatically curtailed by the pandemic: visiting restaurants, bars, and hotels, using public transportation, and attending crowded events. We document a U-shaped pattern of expected future use of these services, with growing pessimism in summer 2020 that had largely reversed by fall 2020—for most groups. More recently, higher-income individuals have indicated that they expect to sharply increase their use of these services compared with their pre-pandemic behaviors, but there has been a notable scarring of expectations among older Americans.

The views authors express in Economic Commentary are theirs and not necessarily those of the Federal Reserve Bank of Cleveland or the Board of Governors of the Federal Reserve System. The series editor is Tasia Hane. This paper and its data are subject to revision; please visit clevelandfed.org for updates.
The distribution of multiple COVID-19 vaccines provides hope that the virus will be brought under better control in the not-too-distant future, potentially allowing for a broadening recovery in economic activity. For some time, economists have been pondering what the trajectory of the economic recovery will look like following the pandemic and to what extent the pandemic may impact consumers’ longer-term behaviors. As vaccinations progress, these issues have now become more pressing, and measuring consumers’ beliefs about their future spending may help to inform forecasts about the strength of the economic recovery.
As part of the Consumers and COVID-19 survey project sponsored by the Federal Reserve Bank of Cleveland, we have been asking consumers a variety of questions about the effects of the coronavirus outbreak on their expectations. Since April 2020, the survey has included questions about consumers’ expectations for their post-pandemic spending on services that have been dramatically curtailed by the pandemic: visiting restaurants, bars, and hotels, using public transportation (such as airline travel), and attending crowded events (such as concerts). Responses to the survey provide an opportunity to gauge consumers’ current beliefs and how those beliefs have evolved over time.
While the median respondent has expected that his or her future use of these categories of consumer services spending would return to its pre-pandemic levels once the pandemic subsides, we show that there have been marked swings in the distribution of consumers’ beliefs that have traced out a U-shaped pattern over time. As virus cases rose during the second national wave in summer 2020, consumers’ expectations about their post-pandemic use of these services became more pessimistic. But by October 2020, even before the news of successful vaccine trials had broken—and as the third national wave of virus cases was growing—consumers’ views on their post-pandemic plans to use these services started to improve, and that optimistic upturn has continued through February 2021.
This pattern raises the potential for a strong rebound in spending on services in high-contact industries, where activity has been curtailed because of the pandemic. In particular, we find that individuals in higher-income households expect to sharply increase their use of these services after the pandemic. However, we document one notable exception to this pattern: Older Americans’ views on their post-pandemic plans are more pessimistic than are those of other groups and have shown somewhat less improvement over time. This notable scarring in the expectations of older Americans about their future behaviors can be related to models in which individuals’ expectations are affected by recent experiences, given that this group has suffered the most adverse health outcomes from the pandemic.
Survey Design and Questions
The Cleveland Fed has been sponsoring a daily survey of US consumers that asks about their beliefs, and the impact of the coronavirus on those beliefs, since March 10, 2020, as documented in Dietrich et al. (2020) and Knotek et al. (2020b). The survey is administered by Qualtrics Research Services, which draws respondents primarily from several actively managed, double-opt-in market research panels, along with social media (Qualtrics, 2019). The sample of participants is broadly nationally representative; Dietrich et al. (2020) present information on some of the background characteristics of the survey respondents. All respondents are required to be US residents, fluent in English, and 18 years of age or older. Individuals in the survey are anonymized to ensure confidentiality. There are relatively few repeat respondents, meaning that we have repeated cross-sectional data rather than a panel.
In this Commentary, we focus on three survey questions related to consumers’ expected post-pandemic behaviors. The survey began asking these questions on April 3, 2020, and the final day included in our sample was February 18, 2021. This yielded a sample size of 38,362 responses. These questions comprise a very small part of the total survey. Knotek et al. (2020b) document some of the other questions that are asked in the survey on a regular basis, the results of which are updated weekly for the Consumers and COVID-19 section on the Cleveland Fed’s website. We use some demographic information collected in the survey in our analysis below.1
Our three survey questions of interest take an identical format, differing only in the broad categories of consumer services spending that are mentioned.
- “When the coronavirus crisis has ended, to what extent do you expect to use hospitality services—such as bars, restaurants, and hotels—compared with your usage before the crisis?”
- “When the coronavirus crisis has ended, to what extent do you expect to use public transportation—such as airplanes, buses, and trains—compared with your usage before the crisis?”
- “When the coronavirus crisis has ended, to what extent do you expect to attend crowded events—such as concerts, amusement parks, and sporting events—compared with your usage before the crisis?”
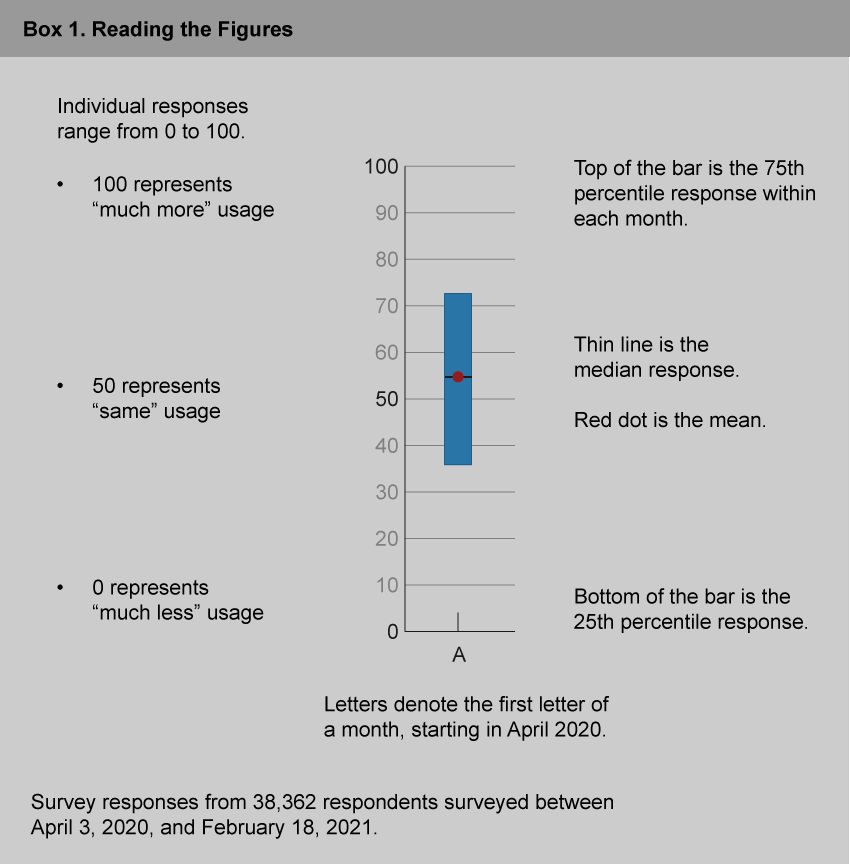
In each case, respondents answer the question by moving a sliding bar that ranges from 0 to 100. Above the slider, the label “Much less” is above 0 and other low values; the label “Same” appears above 50; and the label “Much more” appears above 100 and other high values. Hence, respondents who report a value of 50 indicate that they expect their post-pandemic use of these services will return to its pre-pandemic level; those who report values above 50 or below 50 indicate that, once the crisis has ended, their post-pandemic usage will be higher or lower, respectively, than their pre-pandemic usage. While not a perfect measure, we believe that capturing the expected intensity of post-pandemic usage can serve as a proxy for consumers’ expected demand for these services relative to pre-pandemic levels.
Survey Results
While we have daily survey responses, we plot results aggregated to the monthly frequency to improve the visualization of the data. Figures 1 through 3 show the evolution over time of responses to the three questions above. We summarize the individual responses by plotting four items for each month: the 25th percentile response (the bottom of the bar); the 50th percentile response, or median (thin line); the 75th percentile response (the top of the bar); and the average (mean) response (red dot). The responses between the 25th and 75th percentiles form the center of the distribution of respondents.
Figure 1. Expectations for Post-Crisis Usage of Hospitality Services
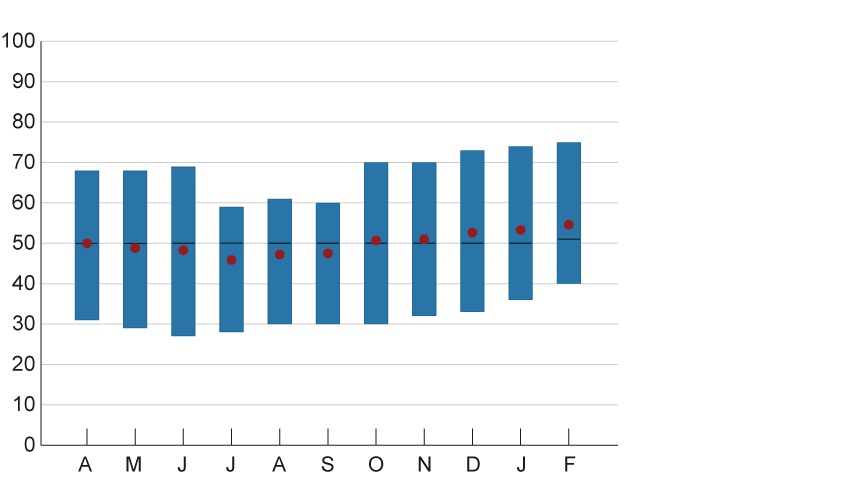
Note: See box 1 for the key to interpreting the bar charts.
Source: Federal Reserve Bank of Cleveland.
Figure 2. Expectations for Post-Crisis Usage of Public Transportation
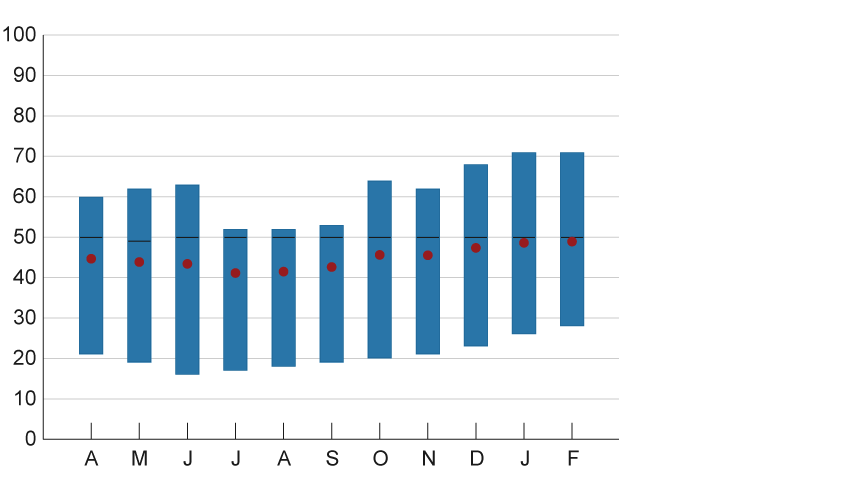
Note: See box 1 for the key to interpreting the bar charts.
Source: Federal Reserve Bank of Cleveland.
Figure 3. Expectations for Post-Crisis Attendance at Crowded Events
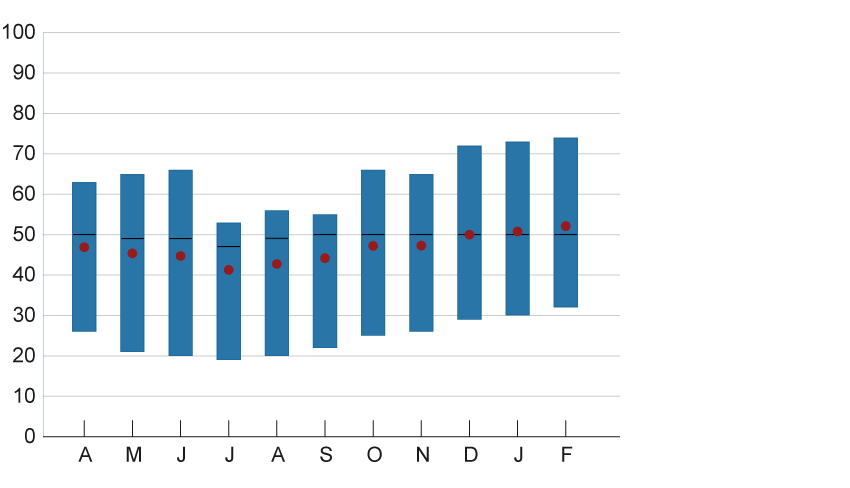
Note: See box 1 for the key to interpreting the bar charts.
Source: Federal Reserve Bank of Cleveland.
The most commonly reported (modal) value across our survey responses is 50 for each question, meaning that many individuals report that they expect their post-pandemic use of the services in question will be the same as their pre-pandemic use. Because there is a considerable amount of heaping on responses exactly equal to 50, this response has also normally been the median response as well.2 Taken at face value, these facts suggest that the “typical” consumer thinks that his or her post-pandemic demand for some services that have been severely impacted by the pandemic will look quite similar to their pre-pandemic levels.3
This point seems worth highlighting, because it suggests that many consumers seek to return to their old patterns, even after an extended hiatus. In other words, it is not a foregone conclusion that post-pandemic consumer behavior will be radically different in all ways from what it had been pre-pandemic.
However, bunching of responses hides heterogeneity across respondents and interesting shifts in the distribution of responses, which we can pick up by looking at the means and the 25th and 75th percentiles of the distribution. Here we see an interesting and similar pattern across questions. Between April 2020 and July 2020, there were notable downward moves in the means and the 25th percentile responses and especially in the 75th percentile responses. Even though our questions ask about future expected behaviors, the downward lurches in July closely coincided with the second national wave of COVID-19 infections, which took hold that month. Both movements suggest that consumers became more pessimistic about their post-pandemic plans to use hospitality services and public transportation and to attend crowded events around that time.
If we fast forward to the fall, in October 2020 we saw a marked uptick in the means and the 75th percentiles, and this was followed by further increases in subsequent months, along with increases in the 25th percentiles as well. On net, these moves suggest an optimistic upturn in consumers’ views about their post-pandemic use of these services. The timing of the initial improvement in October is notable and hard to explain; it preceded positive news on vaccines in November and coincided with the start of the third national wave of virus cases in fall 2020. Thus, it may have reflected pandemic fatigue and pent-up demand for activities that had been on hold for some time. The subsequent increases could reflect these same factors, as well as increasing hopes that widespread vaccinations would make it more feasible to eventually return safely to prior activities.
The locations of the means and the 25th and 75th percentiles relative to the same usage level (=50) give a sense of the overall net expected use of these activities. In April 2020, these measures were symmetrically distributed around 50 for the hospitality question, suggesting roughly the same expected use on net; those expecting to increase their use offset those expecting to decrease their use. But the measures were skewed below 50 for the transportation services and crowded events questions, signifying less expected use on net. By the end of our sample, however, the U-shaped pattern described above had progressed to such an extent that responses were skewed above 50 for the hospitality and crowded events questions, while the public transportation responses were roughly symmetrically distributed around 50. As vaccines are widely administered, consumers may not only continue to raise their expectations for post-pandemic use of these activities but also start acting on them as the pandemic subsides. This outcome would raise the potential for a strong rebound in spending on services in high-contact industries, where the pandemic has curtailed activity.
With many survey responses, we cut our survey data in a variety of ways to see how different groups have responded to these questions. Figures 4 through 6 show the means, 25th, 50th, and 75th percentiles in each month when we divide our respondents into groups based on age; household income; education level; and respondents’ expected duration of the coronavirus outbreak, which is arguably one measure of optimism or pessimism.4 In general, the U-shaped pattern—indicating a rise in pessimism from April to July 2020, and then a shift toward more optimism starting around October 2020 that has continued to the present—is clearly visible in virtually all groups and across our three questions.5
Figure 4. Expectations for Post-Crisis Usage of Hospitality Services, by Groups
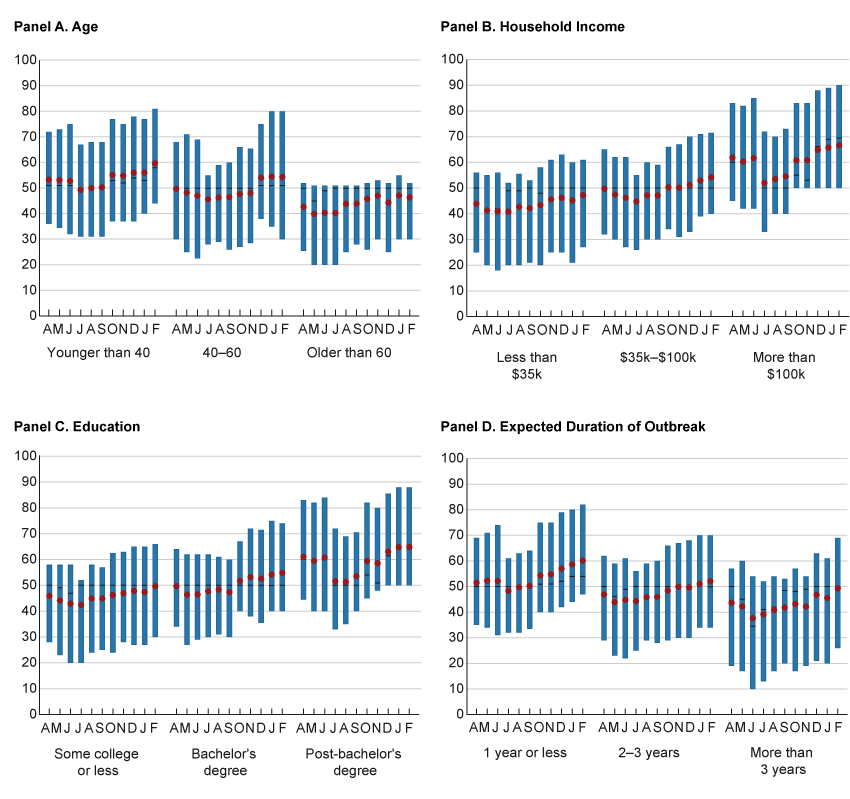
Note: See box 1 for the key to interpreting the bar charts.
Source: Federal Reserve Bank of Cleveland.
Figure 5. Expectations for Post-Crisis Usage of Public Transportation, by Groups
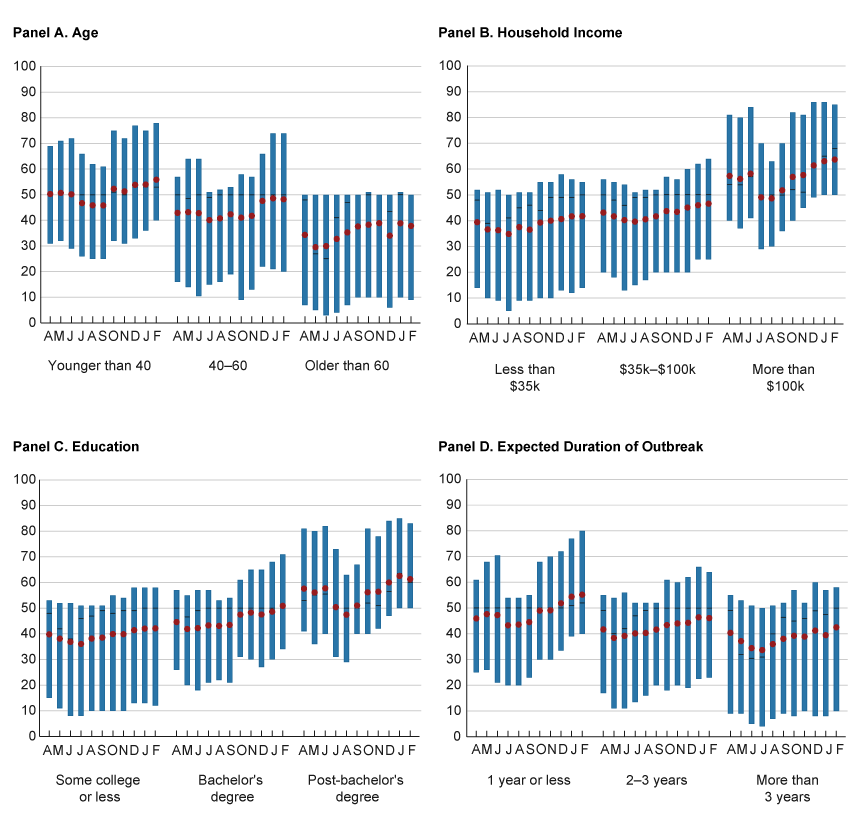
Note: See box 1 for the key to interpreting the bar charts.
Source: Federal Reserve Bank of Cleveland.
Figure 6. Expectations for Post-Crisis Attendance at Crowded Events, by Groups
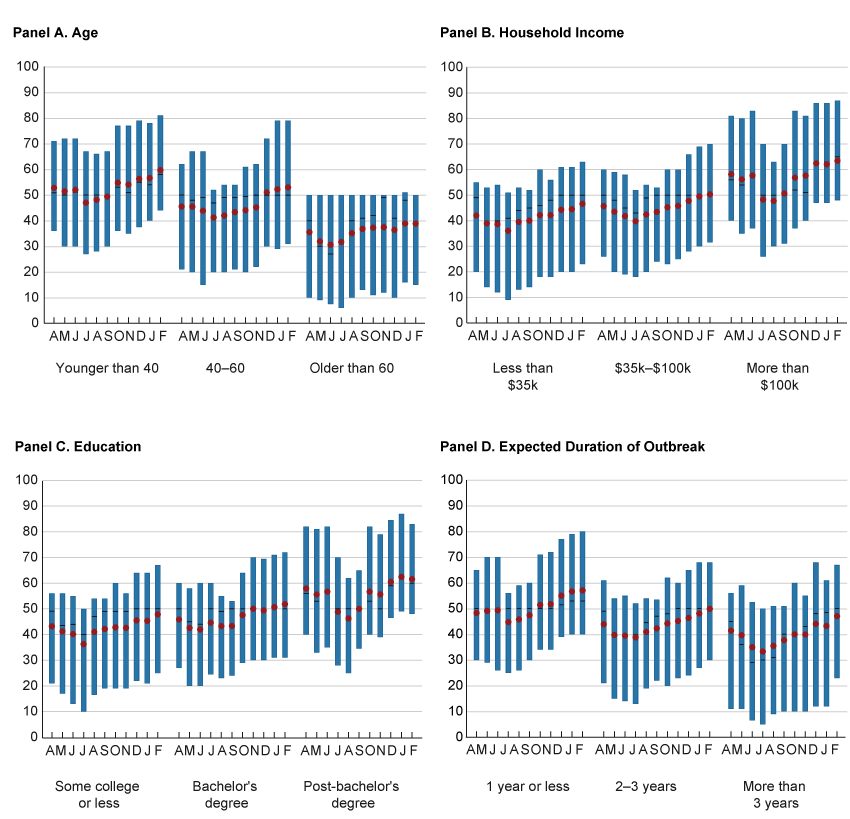
Note: See box 1 for the key to interpreting the bar charts.
Source: Federal Reserve Bank of Cleveland.
In our minds, there are two groups that stand out. One group is the respondents who report having household incomes above $100,000 per year. The responses from this group are consistently higher than those from other groups, and they have also experienced a stronger upturn over time. By February 2021, almost all of the central distributions for this group were above 50. This means that the vast majority of the higher-income respondents planned to increase their post-pandemic use of hospitality services and public transportation and attendance at crowded events compared with pre-pandemic levels. This is dramatically distinct from lower-income groups, where the overall median respondent in February 2021 reported plans to return to his or her pre-pandemic use. These results line up with observations on the inequalities created by the pandemic, as on average higher-income households have been less affected by job losses and have amassed more savings during the pandemic from reduced spending on services, which may support pent-up demand on those services from this group as the recovery proceeds.6
The other group that stands out as an exception is the group of respondents older than 60. Older Americans in our survey have on net consistently indicated expectations to reduce their post-pandemic use of hospitality services and public transportation and attendance at crowded events, compared with their pre-pandemic use; the central distribution of responses is heavily skewed toward values showing lower expected usage. In addition, there has been less discernible evidence of an improving trend among this group. Even after vaccine announcements and the start of actual vaccinations—which in many states have focused on individuals within this group—expectations of post-pandemic use of these services remain depressed among older Americans.
The findings that older Americans’ post-pandemic expectations for using relatively high-contact services are considerably more pessimistic than those from other groups, and that older Americans’ expectations have shown somewhat less improvement over time, appear to capture a notable scarring in expectations. It is not clear that these were necessarily foregone conclusions. Even if the members of this group had reduced their activities for a time out of health concerns to limit their exposure to the virus, our question focuses on longer-term, post-pandemic behaviors. Thinking ahead, respondents could have indicated a desire to use the services described to a greater extent than before, in order to make up for experiences lost during the pandemic itself.
Expectation scarring can come from recent experiences that are particularly salient.7 Older Americans have been especially impacted by deaths due to COVID-19, and individuals in this age group would therefore be more likely to have lost a spouse, friend, or contemporary to the virus than would individuals in other age groups. In addition, members of this group have suffered more severe adverse health outcomes, such as hospitalizations, because of the virus.8
Some economic models and other empirical evidence find that individuals’ expectations are affected by recent experiences. For example, Bordalo et al. (2018) and Bordalo et al. (2019) describe a model of diagnostic expectations in which relatively recent news can shift people’s longer-term beliefs. D’Acunto et al. (2020, forthcoming) show that the prices of goods that consumers have recently purchased can influence their inflation expectations. Kozlowski et al. (2020) consider a form of belief scarring in which an extreme event, such as the COVID-19 pandemic, causes individuals to reassess the likelihood of extreme adverse tail events; in the aggregate, this shift in beliefs can weigh on economic activity for some time.9
As vaccinations progress and public health conditions improve, it will be worth watching whether individuals in this group eventually become more comfortable in resuming their pre-pandemic activities or whether there is a permanent shift in their behaviors. In a separate question in our survey, we find that older individuals do expect to increase their spending in the near term—including on services—relative to current spending, and anecdotal reports point to a pickup in spending by older individuals who have been vaccinated against COVID-19.10 However, increases in spending from a relatively low level are not incompatible with spending less on services compared with pre-pandemic levels, which is the focus of our study.
Conclusion
Using responses to a daily survey that has been running since the early stages of the COVID-19 pandemic, this Commentary examines the evolution of consumers’ expectations for their post-pandemic use of services that have been dramatically curtailed by the pandemic: visiting restaurants, bars, and hotels, using public transportation, and attending crowded events. We document a U-shaped pattern of growing pessimism about consumers’ expected post-pandemic use of these services in summer 2020 that for most groups had largely reversed by fall 2020. This pattern raises the potential for a strong rebound in spending on services in high-contact industries as vaccines are widely administered, especially among individuals in higher-income households, who recently reported a strong intention to increase their spending compared with pre-pandemic levels. However, we find that older Americans’ views on their post-pandemic plans are more pessimistic than are those of other groups, and older Americans’ views have shown less improvement over time. Given that this group has suffered the most adverse health outcomes from the pandemic, the notable scarring in their expectations about future behaviors lines up with models in which expectations are affected by recent experiences.
Footnotes
- Additional modules have been added to the survey at different points, including modules on mask-wearing behaviors as documented in Knotek et al. (2020a) and on consumers’ beliefs about monetary policy as documented in Coibion et al. (2020). Return to 1
- Within the hospitality services question, 15 percent of respondents reported a value of 50. The comparable numbers were 16 percent for the public transportation question and 13 percent for the crowded events question. Return to 2
- That said, the three next most common responses across questions were always 0 (“much less” usage), 51 (just above “same” usage), and 100 (“much more” usage), though not always in that order: among hospitality responses, 100 accounted for 6 percent, 51 accounted for 5 percent, and 0 accounted for 4 percent; among public transportation responses, 0 accounted for 10 percent, 100 accounted for 5 percent, and 51 accounted for 5 percent; and among crowded events responses, 0 accounted for 7 percent, 100 accounted for 5 percent, and 51 accounted for 4 percent. Return to 3
- See Knotek et al. (2020b) for the expected duration of the outbreak question that is asked in the survey. In another sign that consumers’ expected duration of the outbreak is related to more general views on optimism and pessimism, we find that—even after controlling for age, income, education, and a number of other covariates—respondents who expect longer durations of the outbreak are also less likely to believe that a vaccine will be offered to them within the next three months. The online appendix contains regression results where we control for these and other factors. Return to 4
- We find that the U-shaped pattern also holds when we look at other groupings of respondents, including those living in metropolitan cores versus outside of metropolitan cores, and regardless of whether respondents identify as Black or African American, Hispanic, or non-Hispanic white. Return to 5
- Mester (2021) summarizes some of the inequalities created by the pandemic. Briggs and Mericle (2021) provide estimates of excess saving by income quintiles due to the pandemic and find that the top income quintile holds about 40 percent of the total. Return to 6
- See, e.g., Tversky and Kahneman (1974) or Rabin (1998). Return to 7
- Based on data from the Centers for Disease Control and Prevention (CDC) available as of February 24, 2021, the distribution of deaths has been severely skewed toward older adults: 81 percent of the deaths involving COVID-19 in the United States were from individuals who were 65 years old or older; deaths from those less than 50 years old were 4 percent of the total. See https://www.cdc.gov/nchs/nvss/vsrr/covid_weekly/index.htm for updated estimates. Aliprantis and Tauber (2020) and Elvery (2020) discuss aspects of mortality related to COVID-19. Hospitalization rates due to COVID-19 infections are strongly increasing in age as well; see https://www.cdc.gov/coronavirus/2019-ncov/covid-data/investigations-discovery/hospitalization-death-by-age.html. Return to 8
- Malmendier and Nagel (2011, 2016) provide evidence that differential life experiences can have a lasting impact on certain groups’ behaviors and expectations. In contrast with our results, where older individuals have experienced a greater shift in expectations, the learning from experience that they document occurs primarily among the young, who form inferences based on a shorter time series of experiences. Return to 9
- For example, see Steinhauer (2021). Return to 10
References
- Aliprantis, Dionissi, and Kristen Tauber. 2020. “Measuring Deaths from COVID-19” Federal Reserve Bank of Cleveland, Economic Commentary, 2020-18. https://doi.org/10.26509/frbc-ec-202018.
- Bordalo, Pedro, Nicola Gennaioli, and Andrei Shleifer. 2018. “Diagnostic Expectations and Credit Cycles.” Journal of Finance, 73(1): 199–227. https://doi.org/10.1111/jofi.12586.
- Bordalo, Pedro, Nicola Gennaioli, Rafael La Porta, and Andrei Shleifer. 2019. “Diagnostic Expectations and Stock Returns.” Journal of Finance, 74(6): 2839–2874. https://doi.org/10.1111/jofi.12833.
- Briggs, Joseph, and David Mericle. 2021. “Pent-Up Savings and Post-Pandemic Spending.” Goldman Sachs US Economics Analyst (February 15, 2021). https://www.gspublishing.com/content/research/en/reports/2021/02/15/e52e6826-59ec-4c7a-9ebb-732af6ce3946.html.
- Coibion, Olivier, Yuriy Gorodnichenko, Edward S. Knotek II, and Raphael Schoenle. 2020. “Average Inflation Targeting and Household Expectations” Federal Reserve Bank of Cleveland, Working Paper No. 20-26. https://doi.org/10.26509/frbc-wp-202026.
- D’Acunto, Francesco, Ulrike Malmendier, Juan Ospina, and Michael Weber. 2020, forthcoming. “Exposure to Grocery Prices and Inflation Expectations.” Journal of Political Economy. https://doi.org/10.1086/713192.
- Dietrich, Alexander M., Keith Kuester, Gernot J. Müller, and Raphael S. Schoenle. 2020. “News and Uncertainty about COVID-19: Survey Evidence and Short-Run Economic Impact.” Federal Reserve Bank of Cleveland, Working Paper No. 20-12. https://doi.org/10.26509/frbc-wp-202012.
- Elvery, Joel. 2020. “Getting to Accuracy: Measuring COVID-19 by Mortality Rates and Percentage Changes.” Federal Reserve Bank of Cleveland, Cleveland Fed District Data Brief (April 8, 2020). https://doi.org/10.26509/frbc-ddb-20200408.
- Knotek, Edward S., II, Raphael S. Schoenle, Alexander M. Dietrich, Gernot J. Müller, Kristian Ove R. Myrseth, and Michael Weber. 2020a. “Consumers and COVID-19: Survey Results on Mask-Wearing Behaviors and Beliefs” Federal Reserve Bank of Cleveland, Economic Commentary, 2020-20. https://doi.org/10.26509/frbc-ec-202020.
- Knotek, Edward S., II, Raphael S. Schoenle, Alexander M. Dietrich, Keith Kuester, Gernot J. Müller, Kristian Ove R. Myrseth, and Michael Weber. 2020b. “Consumers and COVID-19: A Real-Time Survey.” Federal Reserve Bank of Cleveland, Economic Commentary, 2020-08. https://doi.org/10.26509/frbc-ec-202008.
- Kozlowski, Julian, Laura Veldkamp, and Venky Venkateswaran. 2020. “Scarring Body and Mind: The Long-Term Belief-Scarring Effects of COVID-19.” NBER, Working Paper No. 27439. https://doi.org/10.3386/w27439.
- Malmendier, Ulrike, and Stefan Nagel. 2011. “Depression Babies: Do Macroeconomic Experiences Affect Risk Taking?” Quarterly Journal of Economics, 126(1): 373–416. https://doi.org/10.1093/qje/qjq004.
- Malmendier, Ulrike, and Stefan Nagel. 2016. “Learning from Inflation Experiences.” Quarterly Journal of Economics, 131(1): 53–87. https://doi.org/10.1093/qje/qjv037.
- Mester, Loretta. 2021. “Patience Will Be a Virtue in Fostering a Broad-Based Sustainable Recovery.” Speech at the Maekyung-Korea-American Economic Association Forum, Allied Social Science Associations Annual Meeting (January 4, 2021). https://www.clevelandfed.org/newsroom-and-events/speeches/sp-20210104-patience-will-be-a-virtue-in-fostering-a-broad-based-sustainable-recovery.
- Qualtrics. 2019. “ESOMAR 28: 28 Questions to Help Buyers of Online Samples.” Technical Report. https://www.iup.edu/WorkArea/linkit.aspx?LinkIdentifier=id&ItemID=274179&libID=274203.
- Rabin, Matthew. 1998. “Psychology and Economics.” Journal of Economic Literature, 36(1): 11–46. https://www.jstor.org/stable/2564950.
- Steinhauer, Jennifer. 2021. “Fully Vaccinated and Time to Party: If You Are 70.” The New York Times (March 22, 2021). https://www.nytimes.com/2021/03/21/health/older-residents-covid-vaccine.html.
- Tversky, Amos, and Daniel Kahneman. 1974. “Judgment under Uncertainty: Heuristics and Biases.” Science, New Series, 185(4157): 1124–1131. https://www.jstor.org/stable/1738360.
Suggested Citation
Knotek, Edward S., II, Michael McMain, Raphael S. Schoenle, Alexander M. Dietrich, Kristian Ove R. Myrseth, and Michael Weber. 2021. “Expected Post-Pandemic Consumption and Scarred Expectations from COVID-19.” Federal Reserve Bank of Cleveland, Economic Commentary 2021-11. https://doi.org/10.26509/frbc-ec-202111
This work by Federal Reserve Bank of Cleveland is licensed under Creative Commons Attribution-NonCommercial 4.0 International

