

- Share
Forecasting Implications of the Recent Decline in Inflation
Should the unanticipated slowing of inflation that has occurred since early 2012 raise doubts about the reliability of inflation forecasts? Our analysis indicates that inflation fell well within a normal range of uncertainty, and most of the deviation from the original forecast was a response to other economic developments.


The views authors express in Economic Commentary are theirs and not necessarily those of the Federal Reserve Bank of Cleveland or the Board of Governors of the Federal Reserve System. The series editor is Tasia Hane. This paper and its data are subject to revision; please visit clevelandfed.org for updates.
Many observers have been surprised by the decline in consumer price inflation that has occurred since early 2012. At that time, the Federal Open Market Committee (FOMC) projected that both overall and core PCE inflation would be about 1.7 percent in 2013.1 Today, though, these measures of inflation stand at about 1.2 percent. PCE inflation this year has also come in well below the projections of private-sector economists captured in the February 2012 Survey of Professional Forecasters (SPF).
Should the unanticipated fall in inflation raise doubts about the reliability of common forecasting models—such as those used at the Cleveland Fed—and projections of inflation for the period ahead? The answer to those questions depends on the magnitude of the surprise relative to historical norms and the ability of the models to explain (after the fact) the slowing of inflation. Magnitude matters because the outlook for inflation and other macroeconomic variables is always uncertain, and even though the actual path of inflation has deviated from the model forecast, it may still fall within the normal range of uncertainty around the path the model projected.
The ability of models to explain the deviation of actual inflation from the forecast matters because it reflects how well the model is constructed. Inflation may have followed a path different from the one expected because the economy experienced surprise movements in some of the determinants of inflation that are built into the model, such as GDP growth or unemployment. Assuming these determinants return to behaving as expected, the model’s forecasts will match actual inflation outcomes more closely. To the extent the model cannot attribute the deviation to movements in these determinants, we might worry about its reliability and its projections for the future.
Our results indicate that the surprising decline in inflation shouldn’t be raising doubts about model reliability and future projections of inflation. In our analysis, the gap between actual inflation and forecasts made in early 2012 falls well within the normal range of uncertainty. In addition, the model explains most of the falloff in inflation as a response to other economic developments. As a result, the unanticipated falloff in inflation should simply serve as a useful reminder of the uncertainty that always surrounds forecasts.
Recent Evolution of Inflation
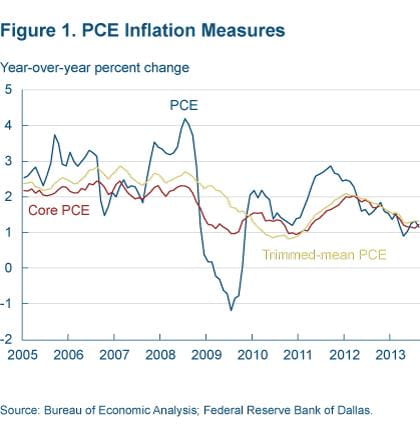
Figure 1 shows the sharp slowing of actual PCE inflation that has occurred since early 2012. Measured on a 12-month basis, PCE inflation plummeted from 2.5 percent in January 2012 to 1.2 percent in August 2013. Although some of the deceleration in PCE prices has been driven by energy prices, measures of the underlying trend in PCE prices that are either less affected or not affected by energy prices have also slowed significantly. Trimmed-mean PCE inflation dropped from 2.1 percent in January 2012 to 1.3 percent in August 2013, and core PCE inflation declined from 2.0 percent to 1.2 percent over the same period.
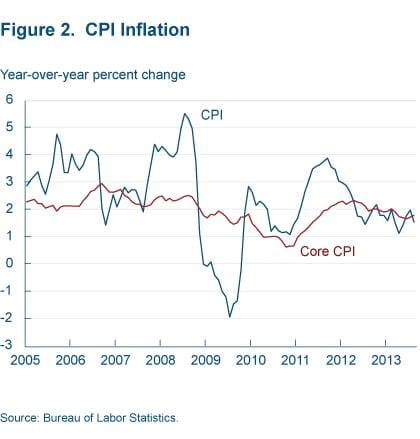
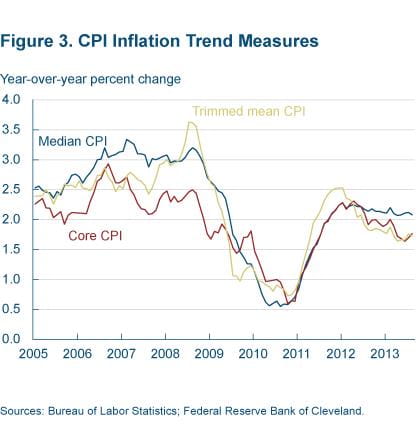
While the FOMC tends to focus on PCE measures of inflation, the CPI can also be useful for judging price trends. Figures 2 and 3 show that CPI measures of inflation have also slowed since the beginning of 2012, although the decline in some underlying measures of the trend in CPI prices hasn’t been as great as the falloff observed in underlying measures of PCE inflation.2 Measured on a 12-month basis, CPI inflation dropped from 2.9 percent in January 2012 to 1.5 percent in August 2013. Over the same period, 16 percent trimmed-mean CPI inflation fell from 2.1 percent to 1.3 percent, while core CPI inflation declined more modestly, from 2.3 percent to 1.8 percent. However, median CPI inflation has changed much less, edging down from 2.3 percent to 2.1 percent.
Model-Based Assessment
To more formally assess the implications of the recent decline in inflation for inflation modeling and forecasting, we use a type of forecasting model (known as a Bayesian vector autoregression) that is very common in macroeconomics. In this analysis, to abstract from some of the temporary variation in inflation that can arise due to noisy food and energy prices, we focus on core inflation.
Accordingly, the model includes core PCE and CPI inflation and eight other macroeconomic variables (table 1) that likely have some bearing on core inflation. The model consists of equations relating the current value of each variable to past values of all variables.3 We estimate the model using data ending in the first quarter of 2012, when core PCE inflation peaked. Although we focus our discussion on core PCE inflation, our model yields results for core CPI inflation that are very similar.
Table 1. Model Variables
| Real gross domestic product |
| Total nonfarm employment |
| Unemployment rate |
| Unit labor costs |
| Core import prices |
| Energy prices |
| Core CPI inflation less trend |
| Core PCE inflation less trend |
| Federal funds rate |
| Stock price index: Standard & Poor’s 500 Composite |
We begin by using the estimated model and data through 2012:Q1 to forecast core PCE inflation from 2012:Q2 to 2013:Q2. The model projects the most likely path of inflation over that period and estimates confidence bands around the most likely path. We report 70 percent confidence bands as a measure of the historically normal level of uncertainty around the forecast.
Figure 4 provides the baseline forecast of core PCE inflation, the 70 percent confidence band around it, and the path inflation actually followed. The baseline projection shows core PCE inflation dipping to about 1.6 percent by the end of 2012 and then gradually moving up toward 2 percent, broadly consistent with the forecasts the FOMC and SPF made in early 2012. Although the baseline forecast tracked actual inflation pretty well through about the middle of 2012, over the remainder of 2012 and the first half of 2013 actual inflation proved to be well below the model’s forecast. Clearly, if we define a surprise as any deviation of actual inflation from the forecast produced with what was known in early 2012, our forecasting model indicates the decline in core PCE inflation has been a surprise.
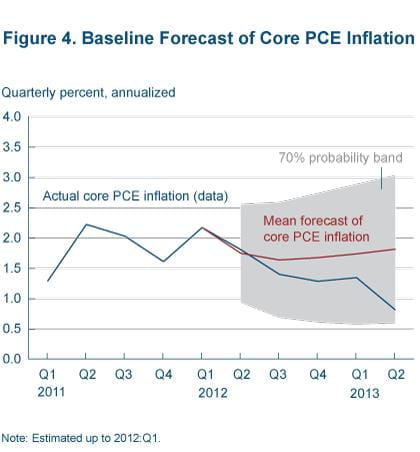
However, relative to historical uncertainty surrounding the forecast, the departure of actual inflation from the projected path hasn’t been especially large. Consistent with our previous observation that forecasts are always uncertain, the path of actual inflation fell well within the 70 percent confidence band around the baseline forecast. So the magnitude of the inflation surprise isn’t very big by historical norms.
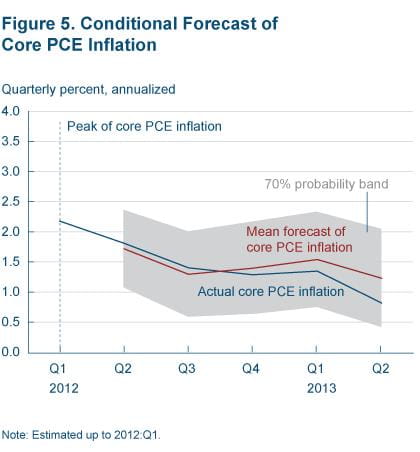
After the fact, how well does the model explain the falloff in inflation? To answer this question, we construct another forecast of inflation from 2012:Q2 through 2013:Q2, taking account of the actual paths of all other variables of the model over this forecast horizon. This forecast can be described as “conditional” because it is produced by feeding into the model the actual data (over the forecast horizon) for all the other variables of the model instead of the forecasts of those variables, which were incorporated in the baseline projection.4 The conditional forecast of core PCE inflation captures what the model implies would have happened to core PCE inflation if the model had “known” in early 2012 how the economy (except inflation) actually evolved from the second quarter of 2012 through the second quarter of 2013.
Figure 5 provides the conditional forecast, a 70 percent confidence band around it, and the path that inflation actually followed. The forecast of inflation conditioned on the actual values of the other model variables closely tracks the actual evolution of core PCE inflation in 2012 and 2013. The close match between the conditional forecast and the actual path of inflation means that, to a large degree, the falloff of inflation that occurred from early 2012 through mid-2013 was indeed a systematic response to other developments in the economy, which the model succeeds in capturing.
To determine which specific developments in the economy have driven inflation lower, we next use our forecasting model to assess the contributions of each variable to the path of inflation from 2012:Q2 through 2013:Q2.5 Computing these contributions is complicated by the fact that macroeconomic variables interact with one another. For example, changes in GDP affect unemployment, and changes in unemployment affect GDP. As a result, to assess the contributions of these variables to the path of inflation, we need to use the model to isolate the changes unique to each variable—that is, isolate the “shocks” to each variable in the model. We then estimate the effect of each shock on core PCE inflation to obtain the contribution of each variable.
We consider two counterfactual exercises (results shown in figure 6). The first reflects the effects of the model’s estimated shocks to real GDP, payroll employment, and the unemployment rate over the 2012:Q2–2013:Q2 period and just information through 2012:Q1 (coupled with forecasts for subsequent periods) for all other variables. The second reflects the effects of the model’s estimated shocks to all variables except core PCE inflation. For comparison, the baseline forecast, which uses only information as of 2012:Q1, and the path of actual inflation are also shown.
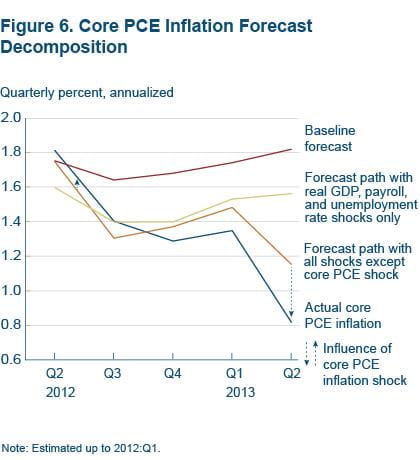
The model-based decomposition shows that much of the falloff in core PCE inflation since early 2012 has been a response to movements in other variables. Some of the falloff has been due to the evolution of GDP growth, employment, and unemployment, which is reflected in figure 6 by the forecast that includes shocks to those variables lying below the baseline forecast.
Some of the decline in inflation, particularly in 2013, is due to movements in other model variables, including labor costs and import and energy prices, reflected by the forecast with all shocks except to PCE inflation lying below the forecast with shocks only to GDP, employment, and unemployment. The combined impact of shocks to GDP growth, employment, unemployment, labor costs, etc., is represented by the distance between the baseline forecast and the forecast with all shocks except to PCE inflation. This impact is clearly sizable, particularly as of mid-2013.
However, a smaller portion of the falloff in core PCE inflation cannot be explained by shocks to other variables; this portion is instead due to a shock to inflation. The effect of the shock to inflation is reflected in the gap between the path of actual inflation and the forecast that reflects shocks to every variable except to core PCE inflation.
Our finding that some of the falloff in inflation in 2013 is due to an inflation-specific shock is consistent with the conclusions of the July 2013 Monetary Policy Report, according to which some of the decline in inflation in 2013 is likely transitory—that is, a temporary movement not likely to last, consistent with the notion of an inflation-specific shock in our model.6
Looking Ahead
Based on this analysis, the surprising fall in inflation that has occurred since early 2012 should not add to doubts about the reliability of common forecasting models. The shortfall of inflation relative to the forecast falls well within the normal range of uncertainty, and our model is able to explain most of the decline in inflation as a response to other economic developments. Instead, the unanticipated falloff of inflation highlights the uncertainty that always surrounds forecasts.
We complete our analysis by using a current version of the model, estimated with data through 2013:Q2, to forecast the most likely path of core PCE inflation from the second half of 2013 through 2015. As indicated in figure 7, our model projects that core PCE inflation has bottomed out and will gradually rise over time toward the FOMC’s long-term inflation goal of 2 percent.
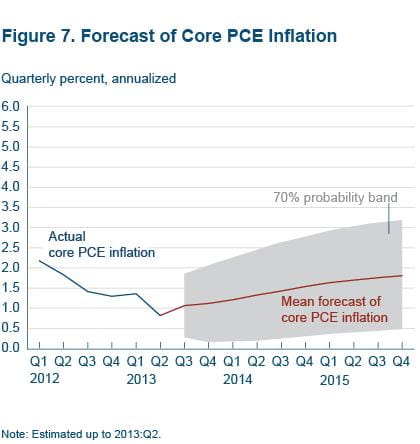
Of course, as we have emphasized, forecasts are always uncertain, as reflected in figure 7’s confidence bands around the projection. Inflation could well prove to be higher or lower than our model projects today, just as has happened over the past couple of years. Looking beyond the model gives us some comfort in projecting a gradual rise in inflation. In particular, as we noted earlier, measures of underlying inflation in the CPI haven’t declined as much since early 2012 as corresponding measures of PCE inflation. Moreover, this year, CPI measures have shown clearer signs of hitting bottom, with inflation in the Cleveland Fed’s median CPI very stable at just over 2 percent.
Footnotes
- This forecast refers to the midpoint of the central tendency of the individual forecasts included in the January 2012 Summary of Economic Projections of the FOMC (SEP). In the September 2013 SEP, the midpoint of the central tendency projection for 2013 was about 1.2 percent, for both overall and core PCE inflation. Return to 1
- It is normally the case that CPI inflation exceeds PCE inflation, reflecting some significant differences in the construction of the measures. The PCE price index and the CPI use different formulas for computing the average price change and cover somewhat different types of spending. In addition, specific item weights and some prices differ between the indexes. The most recently available quantitative decomposition of differences available from the Bureau of Economic Analysis indicates that, in the first half of 2013, the biggest driver of the gap between CPI and PCE inflation was the difference in the weights attached to individual items in the price indexes. Return to 2
- The PCE and CPI inflation variables enter the model as deviations from a long-run trend, defined as the survey-based long-run (5- to 10-year-ahead) PCE inflation expectations series from the Federal Reserve Board of Governor’s FRB/US econometric model. In autoregressive models, specifying inflation as a deviation from trend has been found to improve forecast accuracy (see, for example, Kozicki and Tinsley (2001), Clark (2011), and Zaman (2013)). Nevertheless, our results are not sensitive to this aspect of the model; we obtain similar results for models with the price variables entered in simple growth rates or log levels. Return to 3
- In the reported conditional forecast, we feed in actual values of core CPI inflation. However, we obtain essentially the same result if we don’t condition on the actual evolution of the CPI inflation measure. Return to 4
- To be precise and technical, we use the model to conduct a historical decomposition. Return to 5
- More specifically, the report states: “The very low rate of inflation in the first half of 2013 partly reflects energy, but other inflation rates have been subdued. Especially low inflation reflects other special factors (medical prices, nonmarket prices) that are expected to be transitory.” Return to 6
References
- Board of Governors of the Federal Reserve System, 2013, Monetary Policy Report, July 17.
- Board of Governors of the Federal Reserve System, 2012 (January) and 2013 (September), Summary of Economic Projections of the FOMC.
- Clark, Todd E. (2011), “Real-Time Density Forecasts from VARs with Stochastic Volatility,” Journal of Business and Economic Statistics, vol. 29, pp. 327–41.
- Clark, Todd E. (1999), “A Comparison of the CPI and the PCE Price Index,” Federal Reserve Bank of Kansas City, Economic Review, third quarter, pp. 15–29.
- Kozicki, Sharon, and Peter A. Tinsley (2001) “Term Structure Views of Monetary Policy under Alternative Models of Agent Expectations,” Journal of Economic Dynamics and Control, vol. 25, pp. 149–84.
- Zaman, Saeed (2013), “Improving Inflation Forecasts in the Medium to Long Term,” Federal Reserve Bank of Cleveland, Economic Commentary, 2013-16.
Suggested Citation
Clark, Todd E., and Saeed Zaman. 2013. “Forecasting Implications of the Recent Decline in Inflation.” Federal Reserve Bank of Cleveland, Economic Commentary 2013-15. https://doi.org/10.26509/frbc-ec-201315
This work by Federal Reserve Bank of Cleveland is licensed under Creative Commons Attribution-NonCommercial 4.0 International

