

- Share
Manufacturing Employment Trends in the Fourth District
In this District Data Brief, we use data from the Quarterly Workforce Indicators to examine changes in the number of manufacturing jobs and the characteristics of the manufacturing workforce across the Fourth District from 2002 through 2024.


The views authors express in District Data Briefs are theirs and not necessarily those of the Federal Reserve Bank of Cleveland or the Board of Governors of the Federal Reserve System. The series editor is Harrison Markel.
Introduction
Many people associate the states in and around the Great Lakes region with manufacturing. The Fourth District of the Federal Reserve System—made up of Ohio, eastern Kentucky, western Pennsylvania, and the northern panhandle of West Virginia—is no exception.
The large rise in Chinese exports after China joined the World Trade Organization in 2001 and the associated decline in manufacturing employment in the United States is commonly known as the “China Shock.” In 2002, roughly 20 percent of Fourth District employment was in the manufacturing sector, nearly 5 percentage points higher than for the nation.1 From 2002 through 2010—the period that included the China Shock followed by the Great Recession—the number of manufacturing jobs in the Fourth District declined by 325,000, and most of these jobs have not been recovered over the last 15 years. However, in 2024, manufacturing employment still made up roughly 14 percent of the Fourth District workforce, about 4 percentage points higher than the United States as a whole.2
In this District Data Brief, we use data from the Quarterly Workforce Indicators (QWI) to examine changes in the number of manufacturing jobs and the characteristics of the manufacturing workforce across the Fourth District from 2002 through 2024 (US Census Bureau, 2026).
Trends in Manufacturing and Overall Employment
Figure 1 illustrates the relative changes in total employment and manufacturing employment for the Fourth District and the nation from 2002 through 2024. The Fourth District experienced a sharper decline in manufacturing jobs from 2002 through 2010 than the nation as a whole. During this period, the number of manufacturing jobs fell by nearly 29 percent in the Fourth District and by 24 percent in the United States. By contrast, overall private employment fell by 4 percent in the Fourth District and increased by 2 percent in the United States from 2002 through 2010.
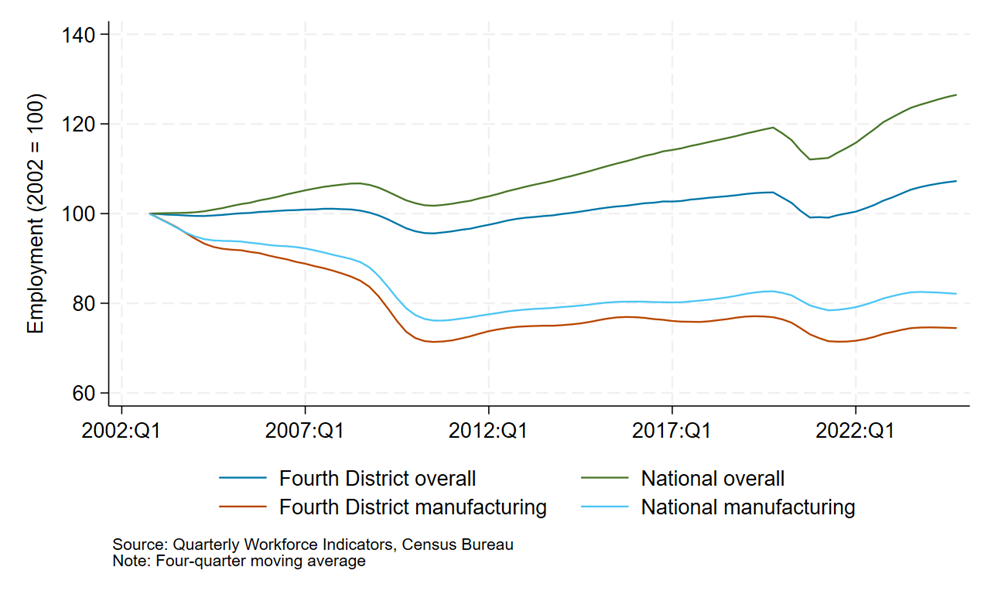
As of 2024, overall employment in the nation and the Fourth District had fully recovered from the Great Recession and the pandemic, rising to 26 and 7 percent above 2002 levels, respectively. However, manufacturing employment remained well below 2002 levels, both across the country and in the Fourth District. As of 2024, US manufacturing employment had returned to just over 80 percent of the 2002 level. By contrast, the number of manufacturing jobs in the Fourth District was only about 74 percent of the 2002 level.
Changing Demographics of the Fourth District Manufacturing Workforce
This decline in US and Fourth District manufacturing employment from 2002 through 2010 coincided with an aging manufacturing workforce. As shown in Figure 2, while some of the employment decline in the Fourth District can be attributed to reductions in employment within birth cohorts, a significant proportion can also be explained by a sharp decline in young workers (aged 25–34) in manufacturing.
Figure 2 illustrates the make-up of the Fourth District manufacturing workforce by birth cohort for 2002, 2012, and 2022. In the early 2000s, the manufacturing workforce was dominated by the baby boomer generation (roughly the lime green and bright blue segments). As this generation aged out of the workforce, a declining number of young people replaced them. The manufacturing workforce aged 25–34 decreased by 91,000 from 2002 (dark orange segment) through 2012 (dark green segment), despite the younger cohort being a somewhat larger share of the overall workforce in 2012. While the aging trend has reversed in recent years, the number of young workers has only partially recovered, increasing by 20,000 from 2012 through 2022 (dark blue segment).
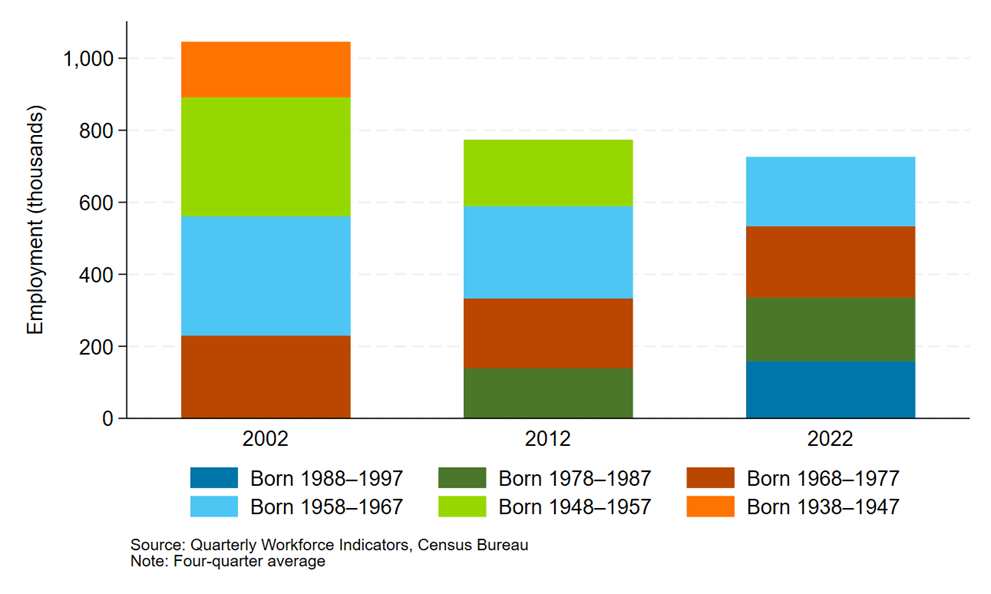
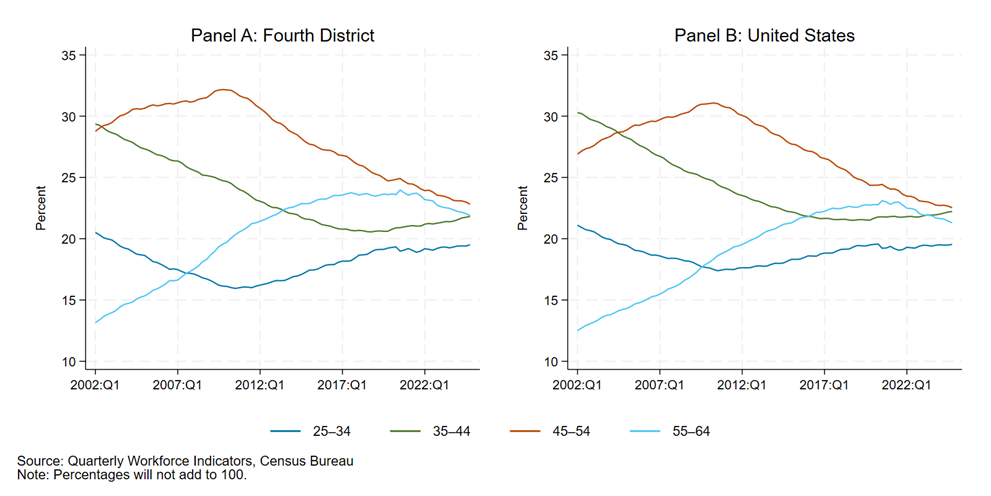
Figure 3 looks instead at the share of workers in each 10-year age group over time for the Fourth District (panel A) and the United States (panel B). The share of the Fourth District manufacturing workforce aged 25–34 hit a low of 16 percent in the third quarter of 2010 following the Great Recession. That same year, the baby boomer generation was aged 46–64. The aging of this generation can be seen in the decline in the percentage of the manufacturing workforce aged 45–54 and the rise in the percentage aged 55–64 from 2010 through roughly the start of the pandemic, when the youngest baby boomers were aged 55. Since mid-2020, the percentages of the manufacturing workforce aged 45–54 and 55–64 declined such that the manufacturing workforce was much more evenly divided across age groups by the end of 2024. These trends largely match the national trends (Figure 3, panel B).
Share of College-Educated Workers in Manufacturing Has Increased
Historically, manufacturing has been associated with creating good-paying jobs for individuals without a college education, particularly men. As shown in Figure 4, less than one-fifth of the US manufacturing workforce had a bachelor’s degree in 2002, with the Fourth District share even lower.
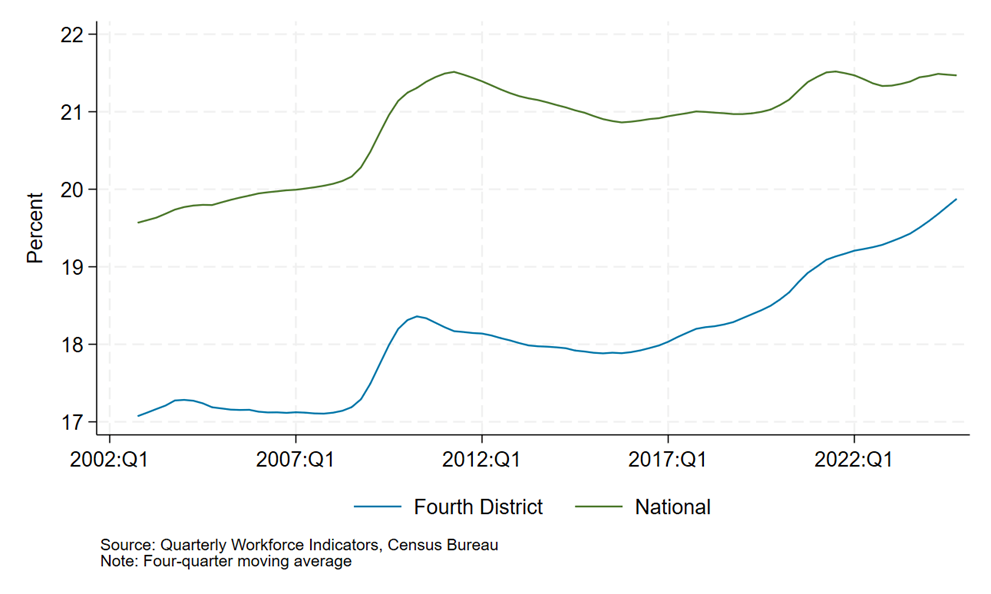
However, the gap between the share of manufacturing workers with a bachelor’s degree in the Fourth District and the nation has narrowed considerably in the past decade, from 3.1 percentage points in 2014 to 1.7 percentage points in 2024. Production jobs in manufacturing—which typically require less education than other positions in manufacturing—were especially hard hit by the Great Recession, leading to a rise in the share of workers with a college education (Garbarino and Cross, 2023). Furthermore, increased robotics and other forms of computer-assisted technologies in manufacturing contributed to a higher share of jobs for college-educated workers (Acemoglu and Restrepo, 2020; Boustan et al., 2022). The share of manufacturing workers with a bachelor’s degree in the Fourth District and nationwide fell from 2010 through 2015, after which education levels started to rise again.
Manufacturing Jobs across the Fourth District
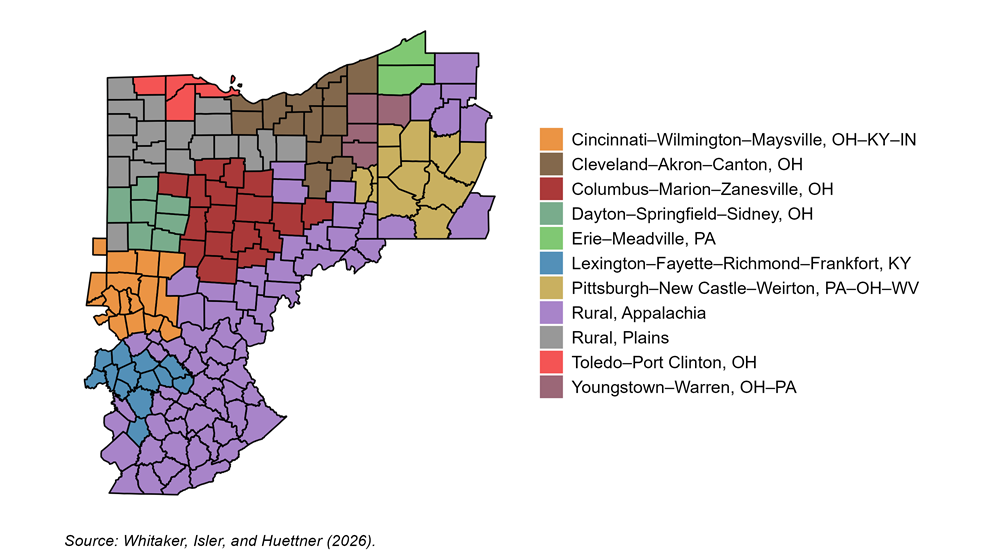
Autor et al. (2013) documented that some areas of the United States were harder hit by the China Shock than others. Next, we look at manufacturing employment across 11 economic regions of the Fourth District—nine urban (combined statistical) areas and two more rural regions—examining both the number of jobs relative to 2002 and the share of workers with a bachelor’s degree. See Figure 5 for a map of these 11 regions, and see the Fourth District Almanac for more information about the regions and how they are defined.
Loss of Manufacturing Jobs Was Uneven across the Fourth District
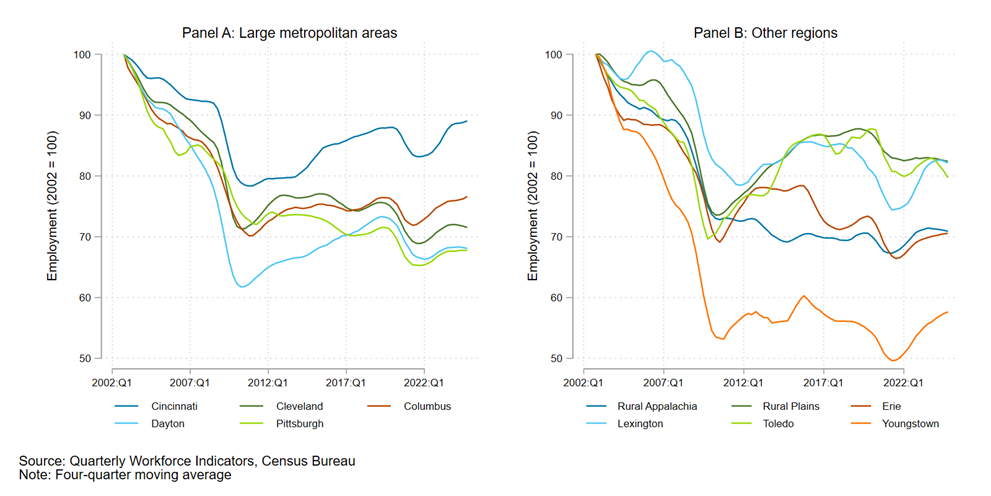
While manufacturing employment has declined everywhere, some regions of the Fourth District have been hit harder than others (Figure 6). Manufacturing employment in most regions in 2024 was between 65 and 75 percent of 2002 levels. The Rural Plains, Toledo, and Lexington areas have done slightly better than the other regions, with 2024 employment near 80 percent of 2002 levels, and Cincinnati has recovered the largest proportion of its workforce (88 percent of 2002 levels). Indeed, Whitaker (2025) reports that Toledo and Cincinnati were among the top 20 US regions in terms of the increase in the number of production jobs in manufacturing from 2013 through 2023. Youngstown has consistently remained the Fourth District region with the largest manufacturing employment decline, with its 2024 employment at only 58 percent of 2002 levels.
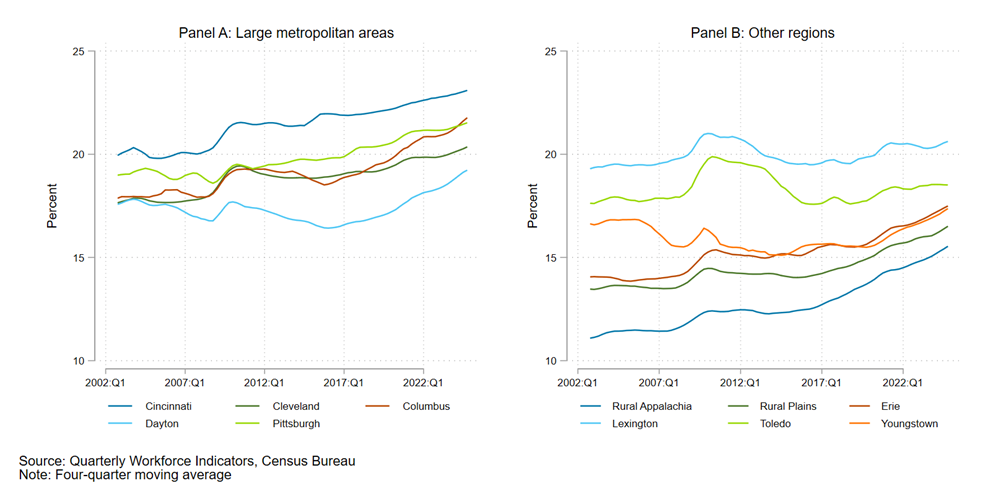
Generally, the largest cities in the Fourth District have the highest share of manufacturing workers with a bachelor’s degree (Figure 7, panel A). The rural regions traditionally had the lowest levels of bachelor’s degree attainment; however, in the past decade, the gap between the rural and urban areas has decreased (Figure 7, panel B). The regions that have seen the largest increases in the share of manufacturing workers with a bachelor’s degree are Rural Appalachia, Columbus, Cincinnati, and Erie.
Future of Manufacturing Employment in the Fourth District
Some policymakers and industry leaders see current lower manufacturing employment levels as, in part, reflecting talent shortages. In a recent State of the Manufacturing Workforce address, the president of the Manufacturing Institute declared that manufacturing has faced a “structural talent shortage” for many years that could lead to 1.9 million manufacturing jobs unfilled by 2033 (Lee, 2026).
A variety of strategies and policies have been adopted by Fourth District states and organizations to attract additional workers to manufacturing, expand earn-and-learn programs (for example, apprenticeships), align educational programs to train workers for the highest-demand manufacturing occupations, and support growth in the manufacturing sector more generally. Ohio’s innovation hub program has focused on supporting hubs in regions that specialize in areas of historic strength, such as the Greater Akron Polymer Innovation Hub and the Northwest Ohio Glass Innovation Hub. Additionally, nonprofit organizations, such as Catalyst Connection in Pittsburgh, work with small- and medium-sized manufacturers to strengthen the industry regionally. Moreover, local coalitions of manufacturers throughout Ohio provide training for entering and incumbent workers (for example, the Appalachian Ohio Manufacturers’ Coalition serving southeastern Ohio and the mid-Ohio valley) and organize manufacturing career days for high school students (for example, the Regional Manufacturing Coalition serving north central Ohio).
Finally, state government economic development agencies in Kentucky and West Virginia work to attract and support existing manufacturers and the jobs they provide in their respective states, and the public–private manufacturing extension partnerships (MEPs) in all four Fourth District states work to support and grow small- and medium-sized manufacturers across these states (see MEP sites for Kentucky, Ohio, Pennsylvania, and West Virginia).3 These efforts suggest that the Fourth District may continue to employ relatively more workers in the manufacturing sector than the United States as a whole.
Conclusion
Manufacturing employment in the Fourth District declined substantially from 2002 through 2010. Although it rebounded somewhat during the 2010s, 2024 employment levels remained below 2002 levels. Still, employment in the Fourth District as of 2024 remained more manufacturing intensive than in the nation as a whole.
Across the Fourth District, the relative decline in manufacturing employment was most pronounced in the Youngstown region, with 2024 employment at less than 60 percent of 2002 levels. Cincinnati fared much better, with 2024 employment recovering to nearly 90 percent of its 2002 level.
The Fourth District manufacturing workforce also changed demographically. From 2002 through 2012, the number of young manufacturing workers declined substantially, and there was only a partial recovery over the next decade. In 2002, the manufacturing workforce was dominated by the baby boomers, who were 38–56 years of age at the time. Nearly 30 percent of workers were in each of the roughly corresponding 35–44 and 45–54 age groups compared with only 20 percent aged 25–34 and 14 percent aged 55–64. By 2024, the youngest baby boomers were aged 60, many in that generation had retired, and the manufacturing workforce was more evenly split across the four 10-year age groups.
Educational attainment increased, as well. The share of Fourth District manufacturing workers with a bachelor’s degree rose from 17.1 to 19.9 percent from 2002 through 2024, reflecting technological advances that reduced the relative importance of production jobs. However, this increase lagged far behind the overall workforce, where bachelor’s degree attainment rose from 32 to 45 percent. Thus, manufacturing remains an important employer of individuals without a bachelor’s degree.
Footnotes
- Authors’ calculations based on US Census Bureau (2026). Return to 1
- See Whitaker (2025) for a more general discussion regarding manufacturing employment from 1940 to 2025. The numbers will not exactly match because the QWI covers only private payrolls. Additionally, we use stable employment, so the data set includes only workers with jobs that persist for the entire quarter. Return to 2
- MEP is a national program administered by the US Department of Commerce’s National Institute of Standards and Technology. Return to 3
References
- Acemoglu, Daron, and Pascual Restrepo. 2020. “Robots and Jobs: Evidence from US Labor Markets.” Journal of Political Economy 128 (6): 2188–244. https://doi.org/10.1086/705716.
- Appalachian Ohio Manufacturers’ Coalition. “Appalachian Ohio Manufacturers’ Coalition.” Accessed July 7, 2026. https://www.aomanufacturers.org.
- Autor, David H., David Dorn, and Gordon H. Hanson. 2013. “The China Syndrome: Local Labor Market Effects of Import Competition in the United States.” American Economic Review 103 (6): 2121–68. https://doi.org/10.1257/aer.103.6.2121.
- Boustan, Leah Platt, Jiwon Choi, and David Clingingsmith. 2022. Computerized Machine Tools and the Transformation of US Manufacturing. No. W30400. National Bureau of Economic Research. https://doi.org/10.3386/w30400.
- Catalyst Connection | Advancing Manufacturing In Southwestern PA. 2023. June 19. https://www.catalystconnection.org/.
- Garbarino, Paul, and Elizabeth Cross. “As Manufacturing Sector Changes, Production Occupations Disappear: An Analysis of Employment from 2007–20: Beyond the Numbers: U.S. Bureau of Labor Statistics.” Beyond the Numbers 12, no. 16 (2023). https://www.bls.gov/opub/btn/volume-12/as-manufacturing-sector-changes-production-occupations-disappear-1.htm.
- “Innovation Hubs | Development.” Accessed July 7, 2026. https://development.ohio.gov/business/third-frontier-and-technology/innovation-hubs.
- “Kentucky Manufacturing Extension Partnership.” Accessed July 7, 2026. https://louisville.edu/servicecenters/kymep.
- Lee, Carolyn. 2026. “2026 State of the U.S. Manufacturing Workforce.” Speech. 2026 NAM State of Manufacturing Tour, Plano, TX, February 25. https://themanufacturinginstitute.org/wp-content/uploads/2026/02/2026-State-of-the-U.S.-Manufacturing-Workforce-Address.pdf.
- “Manufacturing - West Virginia Division of Economic Development Website.” Accessed July 7, 2026. https://westvirginia.gov/industries/manufacturing/.
- “MEP National Network.” NIST. https://www.nist.gov/mep/mep-national-network.
- “Ohio Manufacturing Extension Partnership (Ohio MEP) | Development.” Accessed July 7, 2026. https://development.ohio.gov/business/manufacturing/ohio-manufacturing-extension-partnership.
- PA MEP – Pennsylvania Manufacturing Extension Partnership. Accessed July 7, 2026. https://pamep.org/.
- RMC Ohio – Regional Manufacturing Coalition of Ohio. Accessed July 7, 2026. https://rmcohio.org/.
- Team Kentucky | Cabinet for Economic Development. “Team Kentucky.” Accessed July 7, 2026. https://newkentuckyhome.ky.gov/Existing_Industries/Manufacturing.
- US Census Bureau. “Quarterly Workforce Indicators (QWI) (Time Series: 1990 - Present).” Census.Gov. Accessed July 7, 2026. https://www.census.gov/data/developers/data-sets/qwi.html.
- “West Virginia Manufacturing Extension Partnership (WVMEP).” 2019. NIST, March 18. https://www.nist.gov/mep/centers/west-virginia-manufacturing-extension-partnership-wvmep.
- Whitaker, Stephan D. 2025. “Where Could Reshoring Manufacturers Find Workers?” Cleveland Fed District Data Brief, no. 20251009 (October). https://doi.org/10.26509/frbc-ddb-20251009.
- Whitaker, Stephan D., Mitchell Isler, and Brett Huettner. 2026. “Fourth District Almanac 2026.” Regional Policy Report, no. 20260108 (January). https://doi.org/10.26509/frbc-rpr-20260108.
Suggested Citation
Barrow, Lisa, and Kate Whitbred. 2026. “Manufacturing Employment Trends in the Fourth District.” Federal Reserve Bank of Cleveland, Cleveland Fed District Data Brief. https://doi.org/10.26509/frbc-ddb-20260714
This work by Federal Reserve Bank of Cleveland is licensed under Creative Commons Attribution-NonCommercial 4.0 International


Related resources

Regional Data, Analysis, and Engagement
Explore economic trends and the circumstances impacting the economy and diverse communities of the Federal Reserve’s Fourth District, which includes all of Ohio, western Pennsylvania, eastern Kentucky, and the northern panhandle of West Virginia.

About Us
The Federal Reserve Bank of Cleveland (commonly known as the Cleveland Fed) is part of the Federal Reserve System, the central bank of the United States.