

- Share
Indirect Consumer Inflation Expectations


The views authors express in Economic Commentary are theirs and not necessarily those of the Federal Reserve Bank of Cleveland or the Board of Governors of the Federal Reserve System. The series editor is Tasia Hane. This paper and its data are subject to revision; please visit clevelandfed.org for updates.
Inflation expectations play a crucial role in households’ and businesses’ decisions. For example, when putting money into a certificate of deposit at a bank, the nominal interest rate tells depositors how many dollars they will be paid, but it is the real interest rate—which is the nominal interest rate minus expected inflation—that indicates the anticipated purchasing power of those dollars in the future. When interest rates are very low, changes in inflation expectations can be important in moving real interest rates, and these real interest rates impact economic decisionmaking. Therefore, monitoring the inflation expectations of consumers, firms, and financial markets is relevant and important. One of the challenges, however, is that inflation expectations are not always directly observed and can be difficult to measure.
In this Economic Commentary, we propose a new, indirect way of measuring inflation expectations in a survey of consumers using a novel formulation of the question. Instead of asking consumers directly about prices in general or overall inflation, we ask them to consider what they expect to happen to the prices of the goods and services that they purchase and then to report how their incomes would need to change for them to be equally well-off and afford the same basket of goods and services 12 months into the future. We call these “indirect consumer inflation expectations.” By focusing on their incomes and the prices of items they are already purchasing, our goal is to make the survey question more relevant and tangible to consumers than is asking them about prices in general. In addition to the unique question that we pose to elicit inflation expectations, our results come from a relatively massive number of survey responses that are collected at a higher frequency than many inflation expectations measures. We ask our question in a weekly survey conducted by Morning Consult that started in February 2021 and continues through the present day, with responses from approximately 20,000 participants from across the United States each week; in an international counterpart, we have monthly responses to our question from 14 other countries.
We document three key findings. First, we find that there has been a significant increase in our measure of indirect consumer inflation expectations for the next 12 months since early 2021. After fluctuating below 4 percent in spring 2021, inflation expectations moved up to above 6 percent by late January 2022. Interestingly, this pattern is similar to the increases in inflation expectations from other surveys that directly ask about prices or inflation. Second, we find that very few individuals have anticipated that deflation will occur over the next 12 months, with a sizeable majority expecting zero or relatively low inflation but an increasing minority expecting high inflation rates. Third, using our large number of survey responses, we document that higher inflation experiences across US cities correlate with higher inflation expectations at the city level. We find a similar pattern in our international surveys: consumers report higher inflation expectations in countries with higher levels of realized inflation.
Survey Design and Description
Two well-known surveys of consumers’ inflation expectations over the next 12 months come from the University of Michigan’s Surveys of Consumers (MSC) and the Federal Reserve Bank of New York’s Survey of Consumer Expectations (SCE). Both ask multipart questions related to inflation. The MSC asks respondents to think about what will happen to “prices in general.”1 The SCE asks about beliefs over “inflation” or “deflation.”2 Neither survey clarifies what is meant by prices in general, inflation, or deflation (beyond noting that deflation is the opposite of inflation). Consequently, consumers may be relatively uninformed about these variables because the concepts are unclear. They could also view the concept of aggregate inflation as rather abstract and not directly affecting them. To address these concerns, we consider an alternative question about inflation expectations that relates inflation expectations to more tangible concepts—namely, their income and the prices of the items that they already purchase. Specifically, we ask the following question:3
Next we are asking you to think about changes in prices during the next 12 months in relation to your income. Given your expectations about developments in prices of goods and services during the next 12 months, how would your income have to change to make you equally well-off relative to your current situation, such that you can buy the same amount of goods and services as today? (For example, if you consider prices will fall by 2% over the next 12 months, you may still be able to buy the same goods and services if your income also decreases by 2%.) To make me equally well off, my income would have to...
Respondents select from three options: (i) Increase by __%; (ii) Stay about the same; and (iii) Decrease by __%. They fill in the percentages if they select (i) or (iii).4
Our approach is related to the economic theory of indirect utility. All else being equal, given a change in prices, a consumer will be able to generate the same amount of utility if his or her income changes in the same proportion as the change in prices; for example, if income and all prices double, then the consumer could theoretically still buy the same goods and services and be equally well-off. Extending this line of reasoning to expectations, the change in income the consumer thinks will be needed over the next 12 months to purchase the same basket of goods and services and receive the same utility will be equivalent to the anticipated change in the overall price level specific to that consumer.5 Aggregation of responses across individuals generates a measure of the expected change in total income deemed necessary for consumers to maintain their welfare over the next 12 months while simultaneously capturing variation in the basket of goods and services across consumers. Therefore, even though our respondents are not asked directly about expectations of inflation in the overall price level or in a particular price index, the aggregation of their responses allows us to indirectly infer their aggregate inflation expectations.
The above question was introduced in the last week of February 2021 in US surveys conducted by Morning Consult, and data collection is ongoing. Each week, the question has been asked of a representative sample of approximately 20,000 US adults on average via Morning Consult’s proprietary survey infrastructure. The interviews are conducted online through multiple nationally recognized vendors. The survey uses a stratified sampling process based on age and gender to reach a broad, nationally representative audience. Survey results for the week ending each Saturday are then weighted to match the US adult population according to age, ethnicity, gender, educational attainment, and region; all results shown use these survey weights. The results come from repeated cross-sections; while some repeat sampling likely occurs given the size of our samples, we do not have a panel aspect to the data per se.
It is worth noting that, to the best of our knowledge, this effort represents the largest survey of inflation expectations in the US in terms of the number of respondents. It is also conducted at a higher frequency—weekly—than many similar surveys. For comparison, the MSC surveys approximately 500 individuals each month, while the SCE typically surveys somewhat more than 1,000 individuals each month. The weekly frequency allows us to keep track of movements in expected inflation essentially in real time. The large number of responses and broad geographic coverage allow us to analyze inflation expectations at fine local levels.
We complement our US survey results with international survey data from Morning Consult. Our same question is translated as necessary and has been run at a monthly frequency starting in April 2021 in Australia, Brazil, Canada, China, France, Germany, India, Italy, Japan, Mexico, Russia, South Korea, Spain, and the United Kingdom. The international sample size is smaller, averaging about 1,000 respondents per country. Our survey is thus one of the few international surveys on consumer expectations that asks the same question across countries with diverse levels of economic development and distinct inflationary environments.
Results
We present summary statistics from our survey question in Table 1, which reports results aggregated to the monthly frequency for the sake of compactness.6 The most striking finding is the prevalence of many zero responses to our survey question: In each month, about half of respondents said that they would not need any income growth to offset expected changes in prices over the next 12 months. Taken at face value, many consumers thus may not expect prices on net to change noticeably during the next year. However, there could be a number of other explanations for this finding, as well. For one, respondents might be inclined to round sufficiently small required income changes to zero.7 The experience of the pandemic may have created a more uncertain environment in general, and consumers may be more inclined to use round numbers—especially zero—as a result. The literature has long recognized the tendency of respondents to round responses in surveys of earnings, age, expenditures, and inflation, among other variables (see Binder, 2017, and references therein). It is also possible that respondents might not appropriately convert sufficiently small price changes in their individual consumption baskets into income changes, also causing responses to pile up at zero. Additionally, there could be a situational element to these zero readings: Elevated savings from the pandemic, coming from reduced spending opportunities and elevated fiscal transfers, may have given some consumers a stock of savings to potentially run down in the year ahead, thereby reducing the need for income growth to offset expected inflation in the near term.
Table 1
| 2021 | 2022 | |||||||||||
| All | March | April | May | June | July | August | September | October | November | December | January | |
| Median | 0 | 0 | 0 | 0 | 0 | 0 | 0 | 0 | 0 | 0 | 0 | 0 |
| 5th percentile | 0 | 0 | 0 | 0 | 0 | 0 | 0 | 0 | 0 | 0 | 0 | 0 |
| 10th percentile | 0 | 0 | 0 | 0 | 0 | 0 | 0 | 0 | 0 | 0 | 0 | 0 |
| 25th percentile | 0 | 0 | 0 | 0 | 0 | 0 | 0 | 0 | 0 | 0 | 0 | 0 |
| 75th percentile | 10 | 6 | 7 | 10 | 10 | 10 | 10 | 10 | 40 | 10 | 10 | 10 |
| 90th percentile | 40 | 30 | 30 | 32 | 40 | 40 | 40 | 50 | 50 | 50 | 45 | 50 |
| 95th percentile | 75 | 70 | 60 | 70 | 75 | 75 | 75 | 80 | 80 | 80 | 80 | 85 |
| Mean (trimmed) | 4.712 | 3.535 | 3.612 | 4.045 | 4.434 | 4.476 | 4.718 | 5.136 | 5.428 | 5.353 | 5.415 | 5.835 |
| Std. Dev (trimmed) | 8.248 | 6.713 | 6.705 | 7.205 | 7.887 | 8.042 | 8.278 | 8.852 | 9.275 | 8.829 | 8.720 | 9.357 |
| Observations (All) | 1,080,215 | 99,891 | 73,295 | 114,508 | 93,683 | 89,476 | 93,578 | 100,179 | 139,398 | 87,104 | 92,381 | 76,440 |
Sources: Federal Reserve Bank of Cleveland, Morning Consult
Notes: Responses are percentages. Observations from the last week of February 2021 are included in the "All" column. The mean (trimmed) and standard deviation (trimmed) both trim the bottom 10 percent and the top 10 percent of observations in each period. The percentiles and median are calculated using all observations.
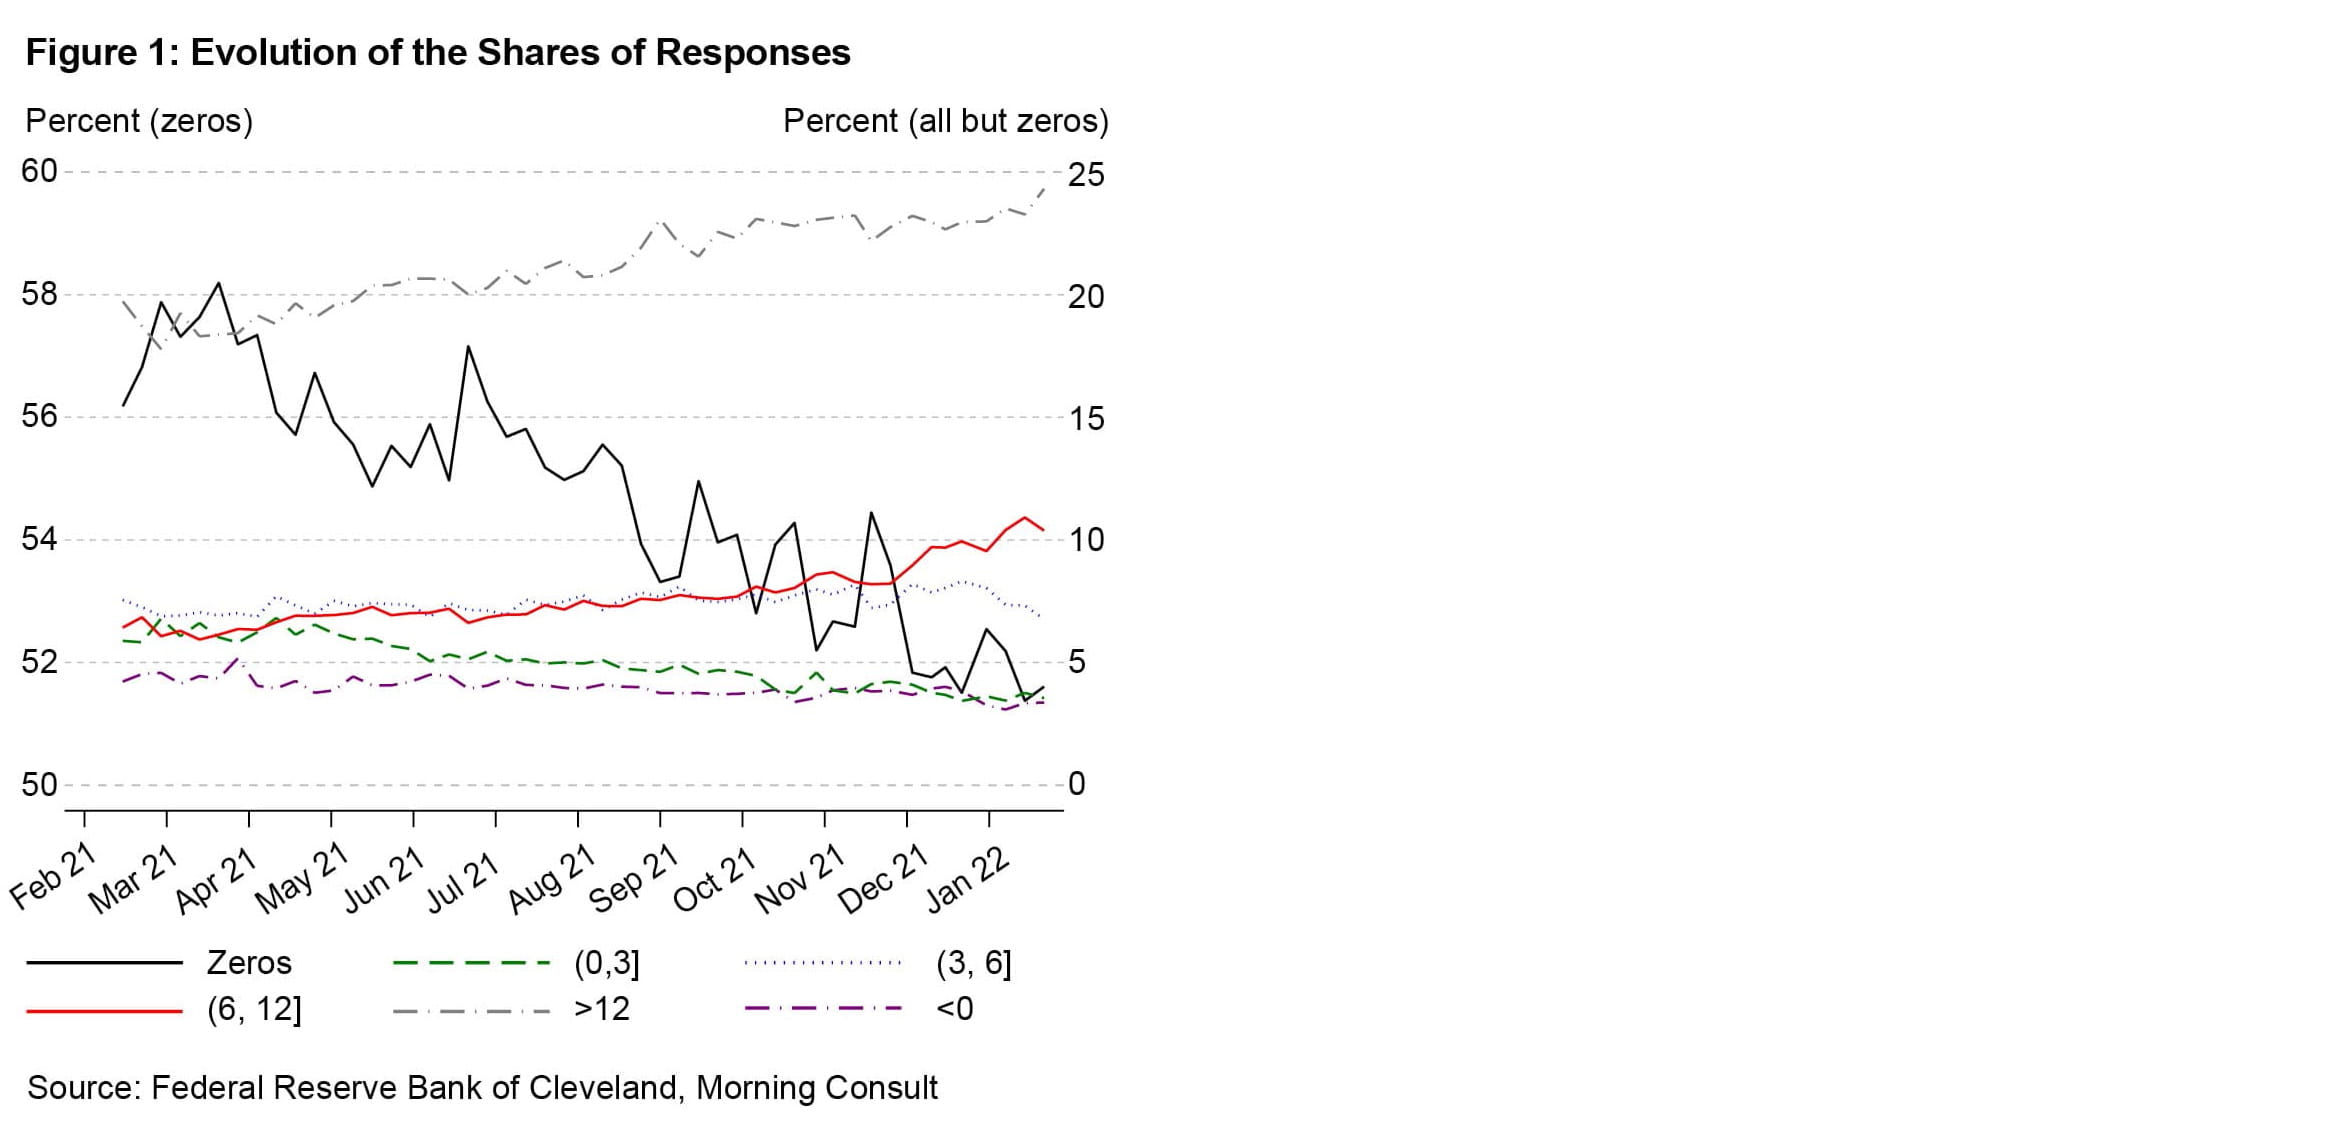
A second finding is that few respondents have reported that they would need to have their incomes fall to offset price changes and be equally well-off over the next 12 months; the 5th percentile of responses is consistently nonnegative. Figure 1 below shows that the share of negative responses has hovered at very low levels. On average, less than 4 percent of respondents each month report negative values. Based on our indirect utility framework, this finding suggests that very few respondents have expected deflation over the next 12 months during our sample (see also Gorodnichenko and Sergeyev, 2021, for further evidence along these lines). However, it is possible that other explanations may be at play that cause consumers to shy away from writing down declines in their nominal incomes even if they do expect prices to fall.8
The third finding is that the distribution has been shifting up over time. Because some consumers report extreme inflation expectations in surveys—which is visible in the upper and lower tails of the distributions shown above—it is common when using the MSC and the SCE measures to focus on the median of the distribution as a measure of aggregate inflation expectations. In our survey responses, the mass of the distribution at zero percent makes the median less informative because it completely obscures other shifts that we can see in the percentiles in Table 1 (and in the distribution of responses that we plot in Figure 1 below).
To correct for the high degree of agreement at zero percent and the asymmetry of the resulting response distribution, and to also rule out some of the most extreme responses, our preferred measure of aggregate indirect consumer inflation expectations is a trimmed mean in which we symmetrically trim the top 10 percent and the bottom 10 percent of the responses. This trimmed mean was below 4 percent in March and April 2021, but it has been steadily rising since then. Similar upward drift is visible in the upper percentiles of the distribution and the increasing standard deviation across responses.
To further illustrate this last point, Figure 1 switches to the native weekly frequency of the survey and plots the shares of responses that fall into the following categories: (i) the zero responses, (ii) responses less than 0 percent, (iii) greater than 0 and less than or equal to 3 percent, (iv) greater than 3 and less than or equal to 6 percent, (v) greater than 6 and less than or equal to 12 percent, and (vi) greater than 12 percent. The share of consumers reporting a zero response has been decreasing since April 2021, from around 58 percent to about 51 percent in January 2022. This decline has been accompanied by a decline in the share of consumers who think that inflation will be between 0 and 3 percent (dashed green line)—a range that encompasses the Federal Reserve’s long-term inflation target of 2 percent. There have been clear upward moves in the shares of consumers expecting more than 6 percent inflation over the next 12 months.9
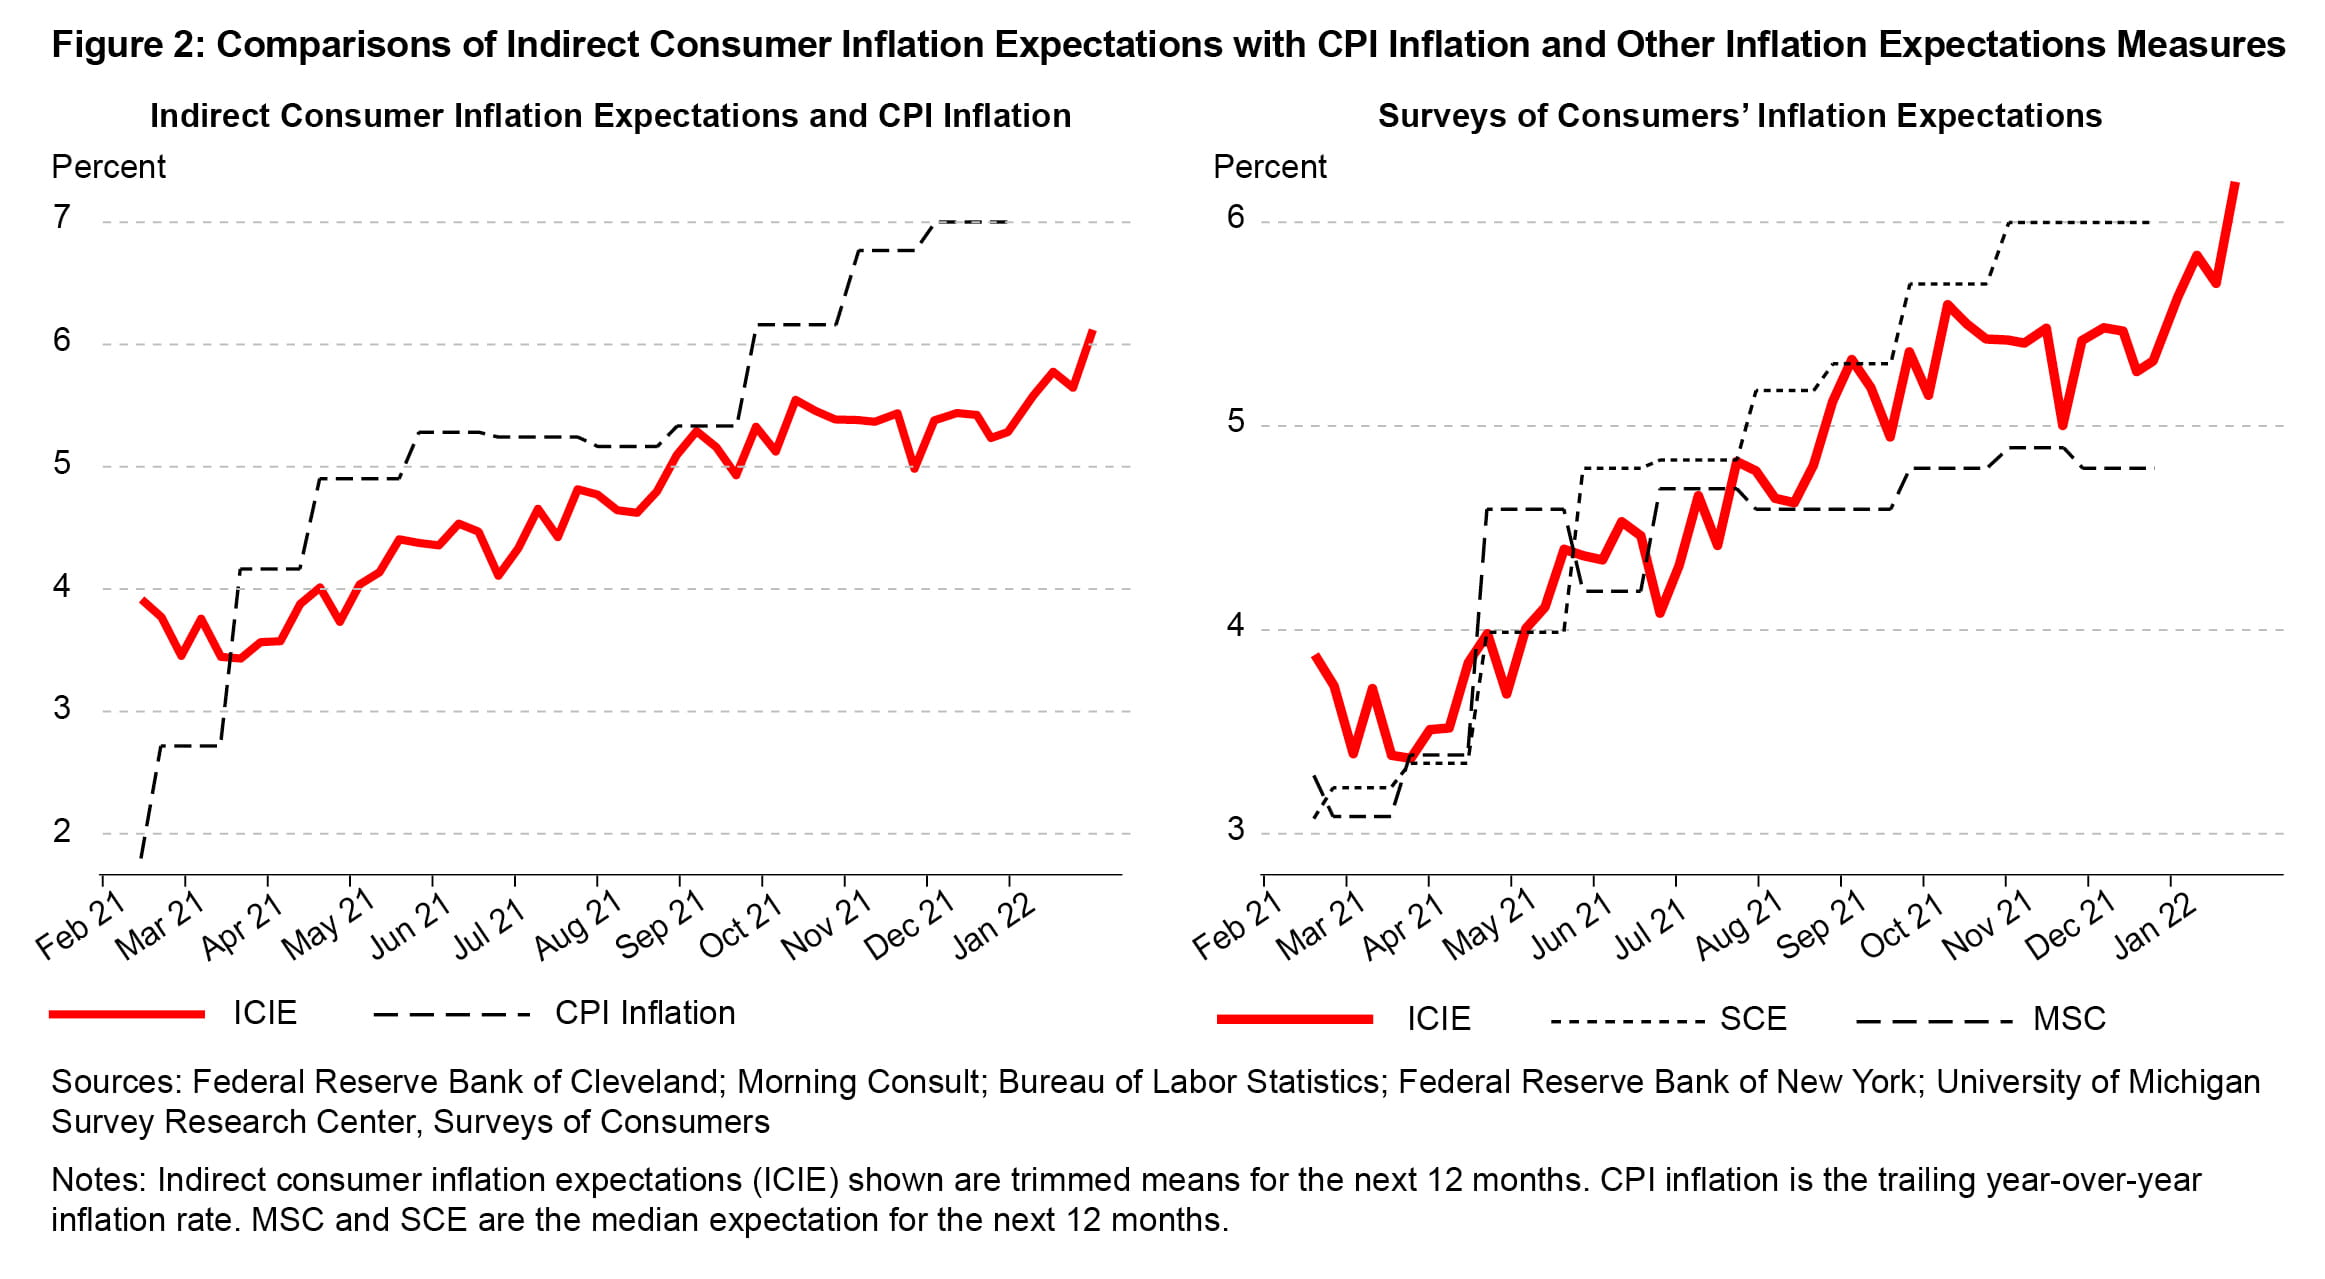
We plot the evolution of our weekly indirect consumer inflation expectations (abbreviated ICIE in the figures) measure in Figure 2. The left panel compares our inflation expectations measure with inflation over the past 12 months as measured by the Consumer Price Index (CPI).10 The two series have both been trending up since early 2021, though CPI inflation has increased by more than inflation expectations. Recently, CPI inflation has been higher than our measure of inflation expectations over the next 12 months, a reversal from the pattern in early 2021. The right panel compares our indirect consumer inflation expectations with the inflation expectations from the MSC and the SCE. Despite asking three very different survey questions, all three series have moved up since spring 2021, with more notable differences across the surveys in recent months.
Increases in inflation expectations have been widely shared across different demographic groups, but the extent of the increase has varied. Figure 3 plots indirect consumer inflation expectations based on gender, household income, age, and education alongside the reading across all groups. We find that women’s inflation expectations have been higher than men’s inflation expectations, consistent with findings in previous literature (see, for example, D’Acunto et al., 2021b), and women’s inflation expectations have tended to increase by more than the inflation expectations of men. Relatively high-income households tend to have lower inflation expectations than those of lower-income households.
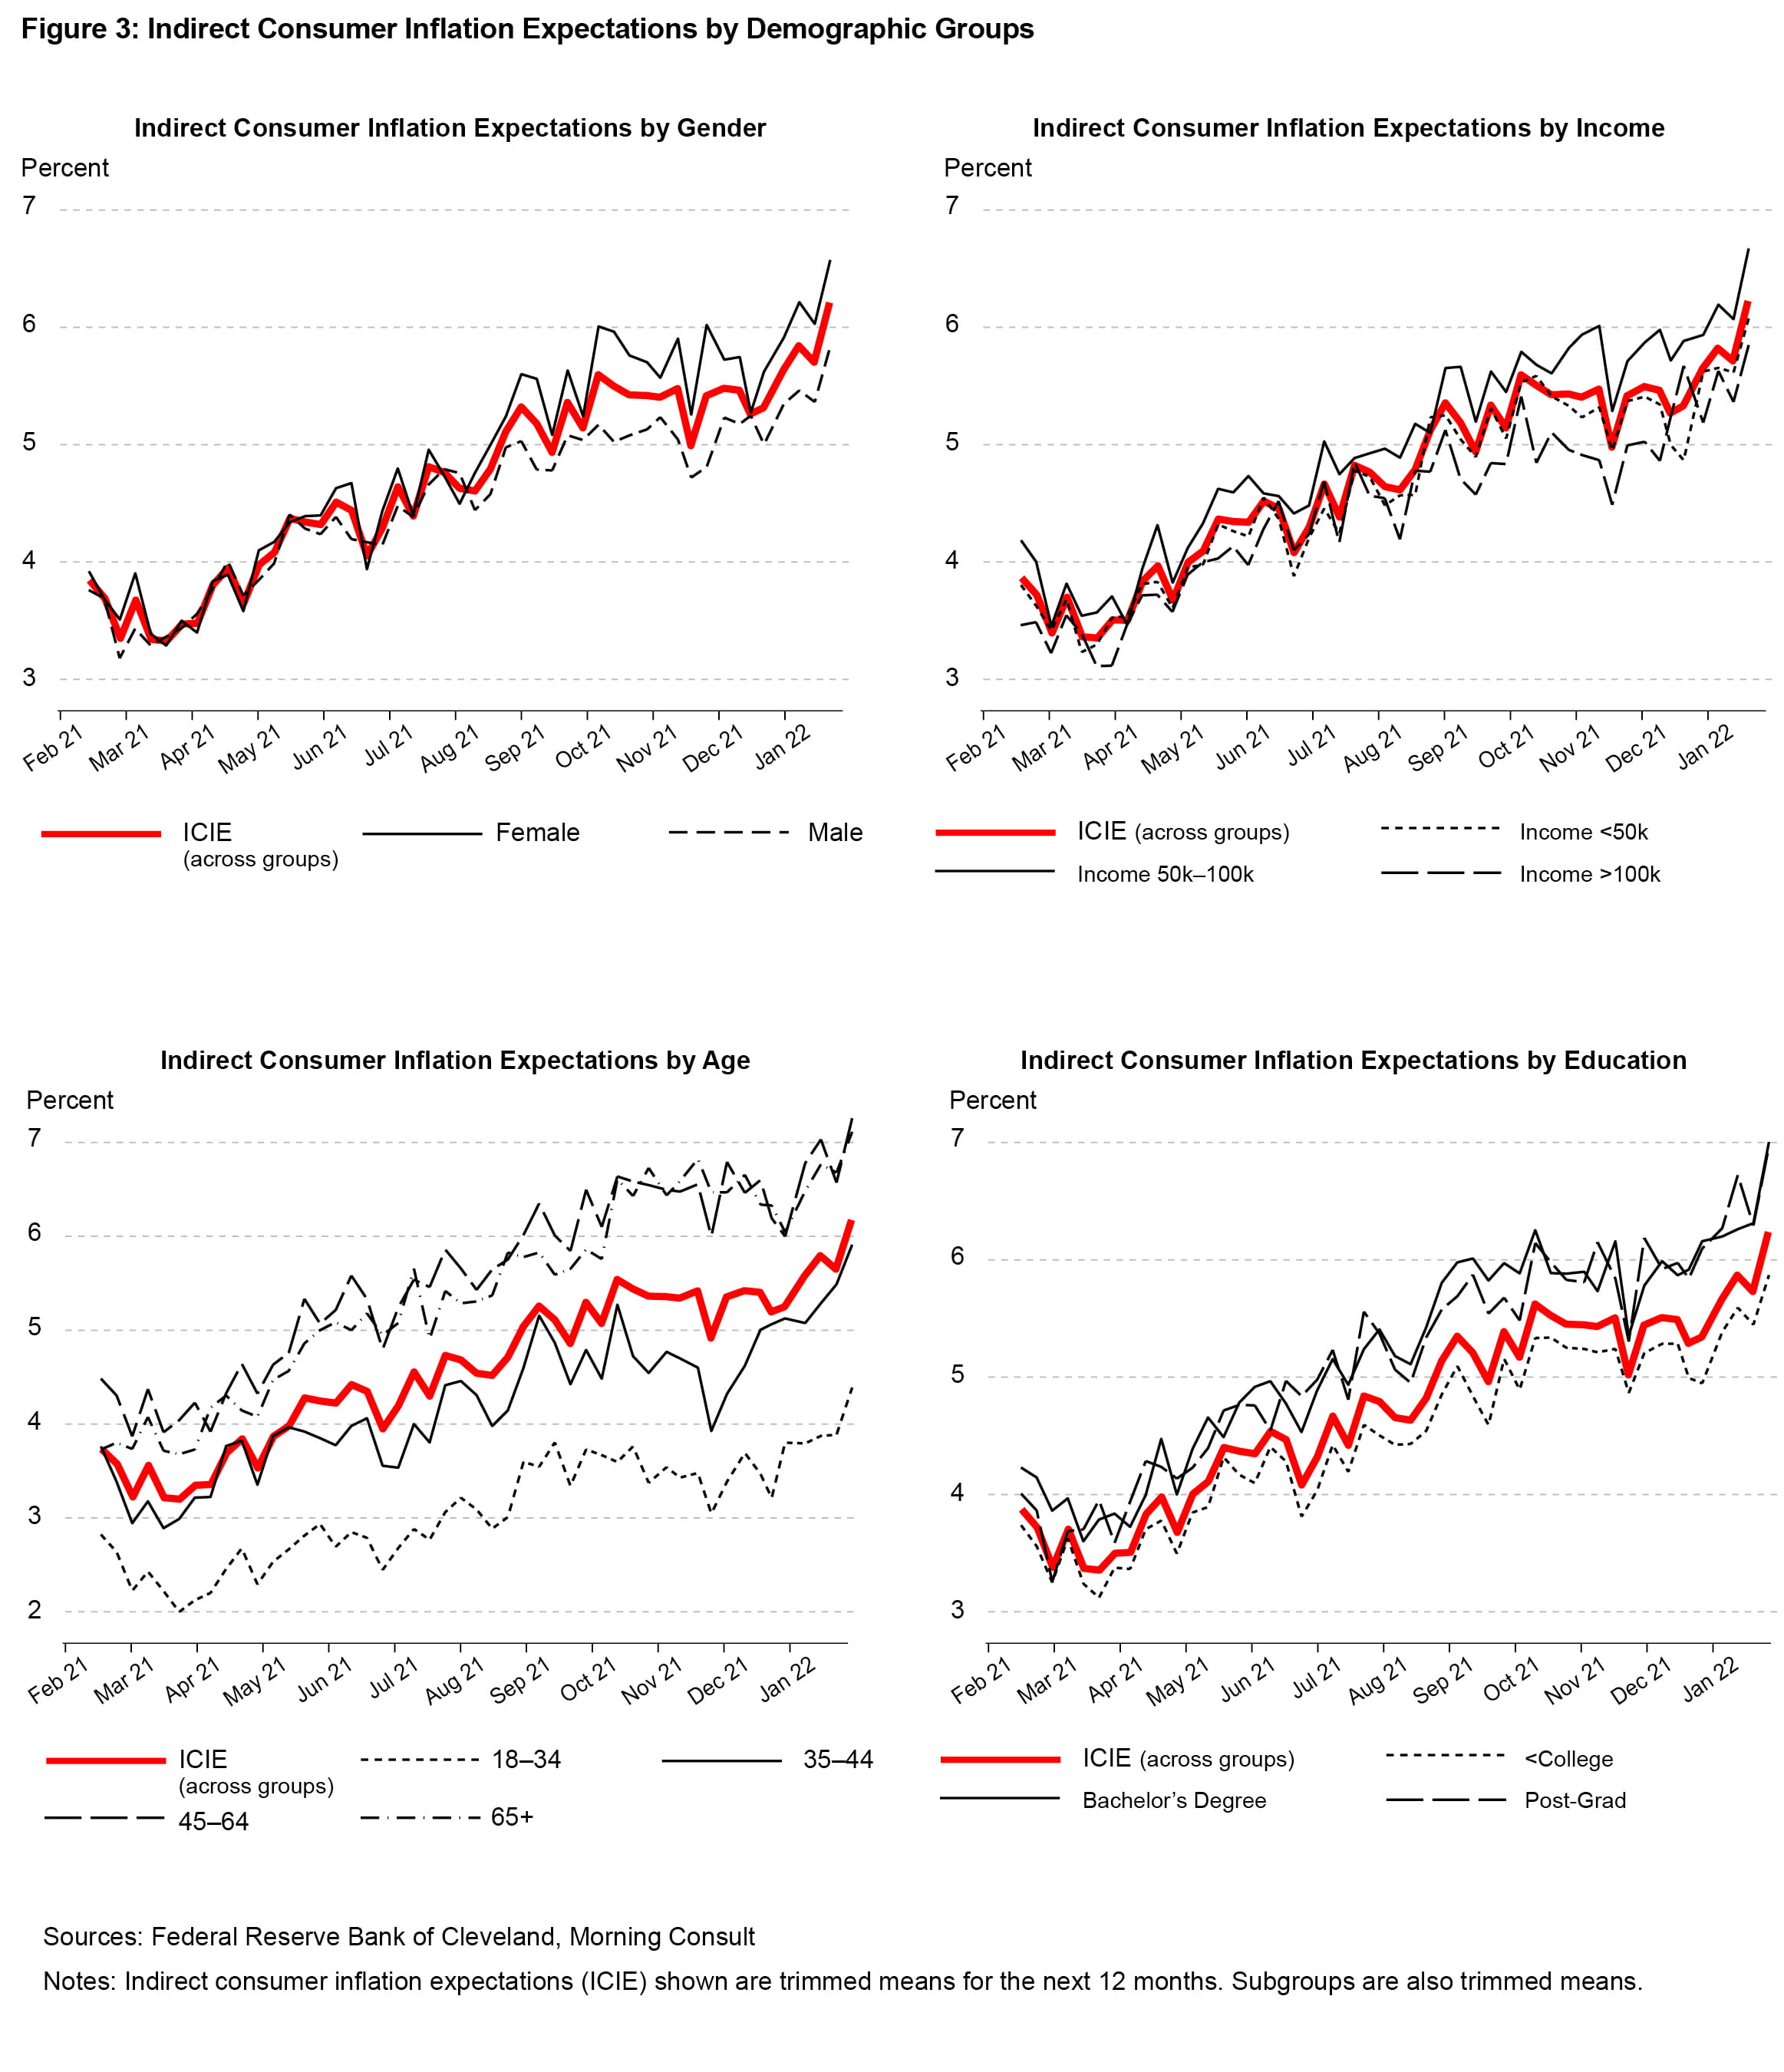
Older respondents have consistently higher inflation expectations than younger respondents; this same pattern is shared by the SCE. Individuals older than 45—who were born during or lived through the Great Inflation period in the 1970s and early 1980s in the United States—report significantly higher growth in required income levels over the next year to preserve their current well-being given expected changes in prices. Respondents between 18 and 34, who have primarily experienced low inflation rates through much of their lives, generally believe they require an increase of only about 3 percent in their incomes over the next 12 months to offset price changes. This outcome is consistent with evidence presented in Malmendier and Nagel (2016) showing that individuals’ past experiences highly influence their perceptions about the future. We also find that respondents with a higher level of education report higher indirect inflation expectations than those respondents with less than a college education within the past year. This pattern is at odds with the SCE data that show respondents with a college education tend to have lower inflation expectations than those with less education. We think that this difference merits further exploration, with the collection of more time series data allowing us to determine whether it reflects current events or differential understanding of our survey question.
Geographic Variation in Realized and Expected Inflation
Over the relatively short time in which our survey question has been running, we have seen that indirect consumer inflation expectations have increased alongside actual CPI inflation. We use the geographical variation in our survey data, along with international survey data, to show that this relationship is also true in the cross-sectional dimension: higher realized inflation is associated with higher inflation expectations.
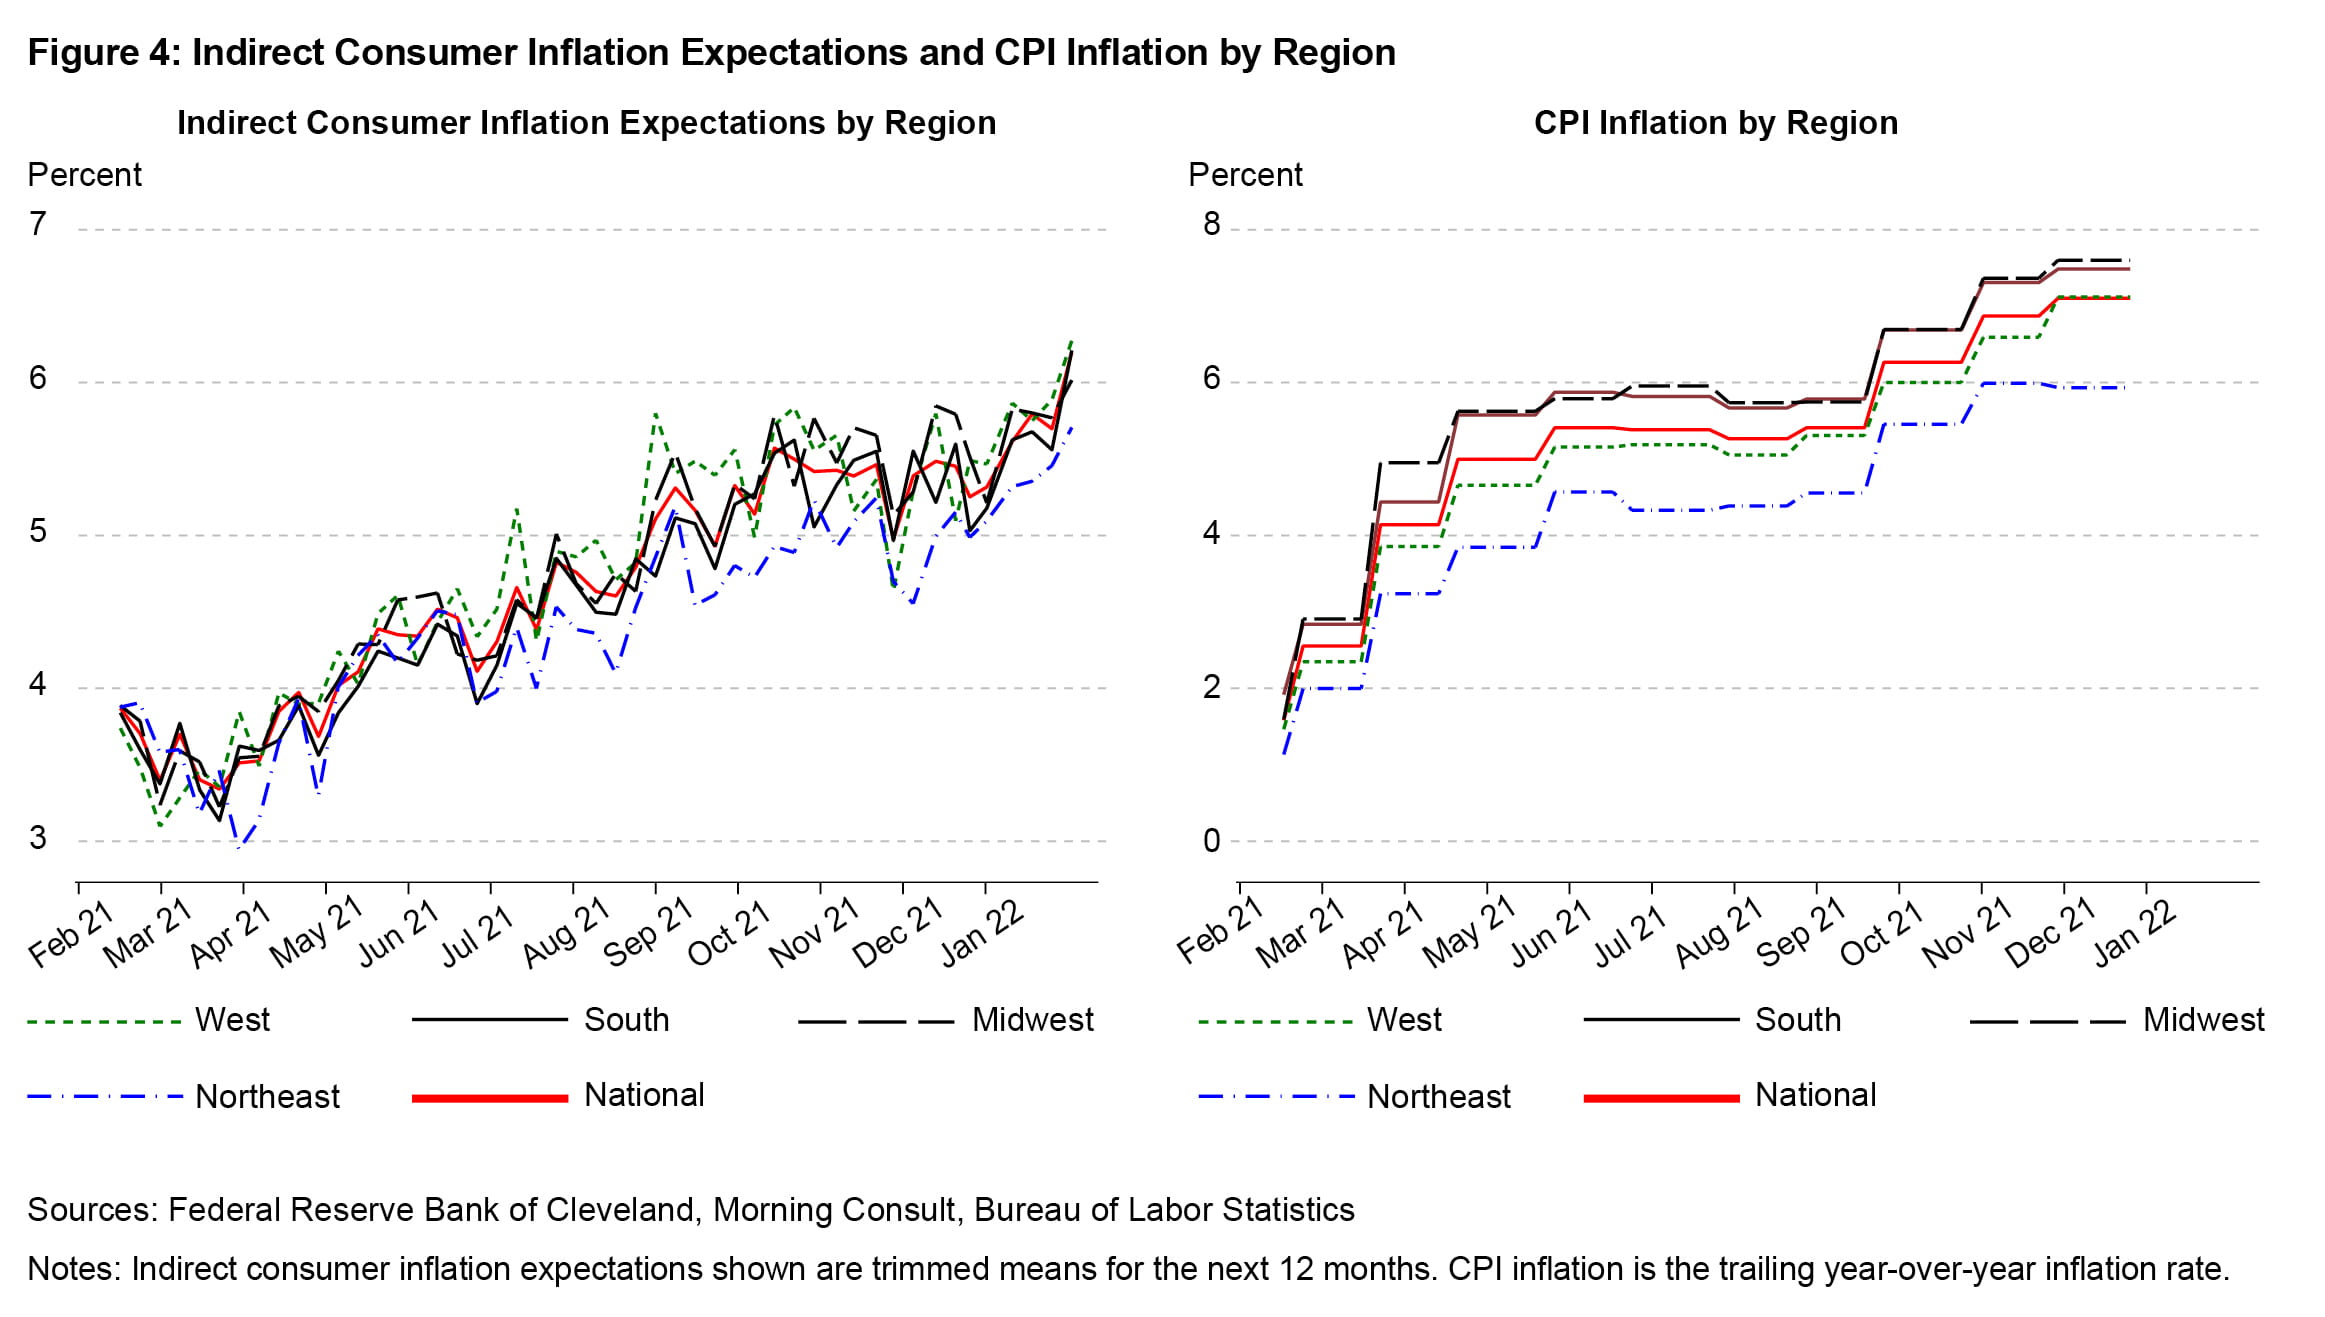
We first examine the evolution of our measure of indirect consumer inflation expectations across the four main regions in the United States—the Northeast, Midwest, South, and West. Figure 4 shows that there are some differences in the level of inflation expectations at the regional level but that these expectations have tended to move in a generally similar fashion across the four regions. Inflation expectations have tended to be somewhat lower for respondents in the Northeast compared with other regions, while respondents from the Midwest have tended to be at the upper end of the range. The right panel shows that this pattern is echoed by realized CPI inflation, which has been lowest in the Northeast and highest in the Midwest and South.
To exploit geographic variation further, we assign the reported county of our respondents to their respective commuting zones and compare local measures of indirect inflation expectations from those areas with Bureau of Labor Statistics estimates for CPI inflation within selected local areas. Similar to our findings at the regional level, the top panel of Figure 5 shows that there is a strong positive correlation between local CPI inflation over the past year and local inflation expectations for the next 12 months, with the local evidence suggesting a less than one-for-one relationship. This relationship is consistent with evidence presented in D’Acunto et al. (2021a) that the prices of items consumers purchase—in this case, in their local areas—significantly affect their inflation expectations.
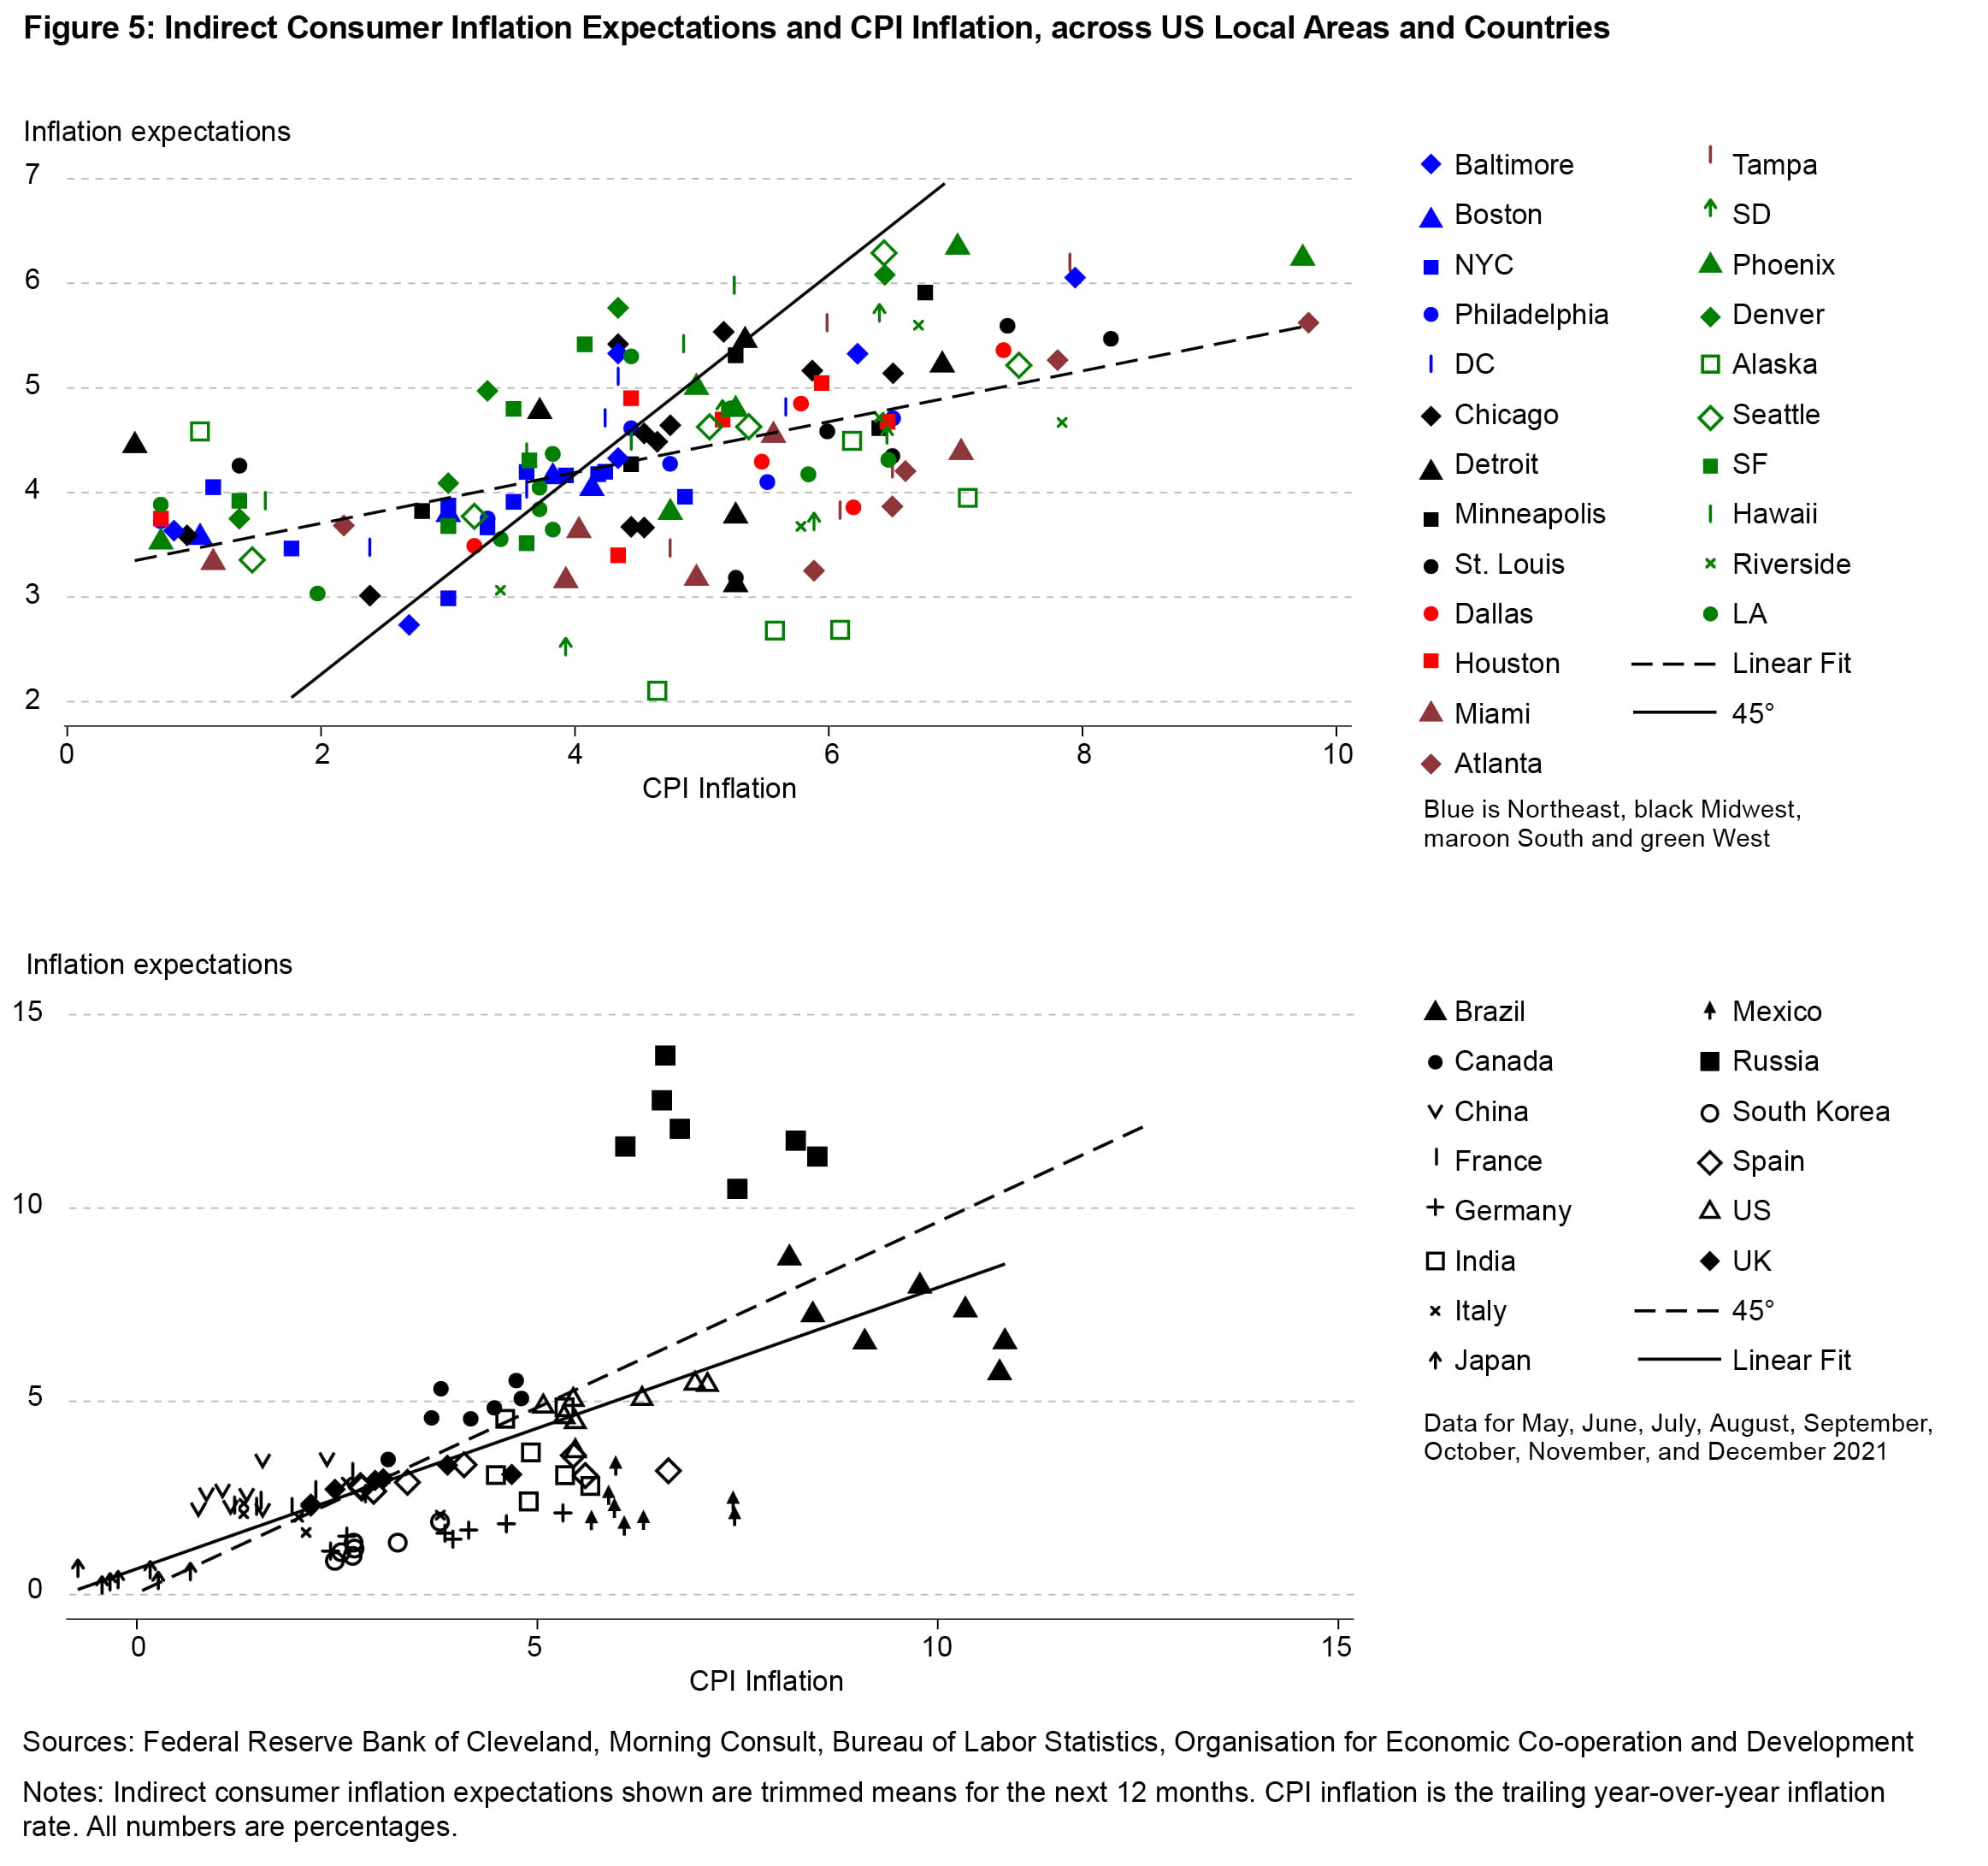
Finally, we conduct a similar comparison for our indirect consumer inflation expectations measure and realized inflation across countries. This exercise is useful because there is considerably greater cross-country variation in their inflation rates. As shown in the bottom panel of Figure 5, we find that the strong positive relationship between local inflation expectations and local realized inflation readings is robust across countries.
Conclusion
Inflation expectations impact the decisions of consumers, firms, and financial markets. Measuring those expectations can be challenging, however, as they are not always directly observed. In this Economic Commentary, we present a novel way of measuring inflation expectations. Instead of directly asking consumers to report what they expect to happen to inflation, we ask them to report the income change required over the next 12 months such that they are equally well-off and are able to consume the same basket of goods and services. This question gives us a measure of indirect consumer inflation expectations. This novel question, the weekly frequency of our survey, and the massive weekly sample of 20,000 respondents make our work unique.
We find that our measure of indirect consumer inflation expectations increased significantly, rising from less than 4 percent in early 2021 to more than 6 percent in January 2022. Interestingly, this pattern is similar to the increases in consumer inflation expectations from other surveys that directly ask about prices or inflation. Very few individuals have anticipated deflation to occur over the next 12 months during our sample period, with a sizeable majority expecting zero or relatively low inflation, but an increasing minority expecting high inflation rates. Finally, leveraging our large number of survey responses across the United States and in an international panel, we show that higher rates of realized inflation have been positively correlated with higher inflation expectations.
Endnotes
- The questionnaire for the MSC is available via https://data.sca.isr.umich.edu/survey-info.php. The MSC first asks, “During the next 12 months, do you think that prices in general will go up, or go down, or stay where they are now?” It then asks, “By about what percent do you expect prices to go (up/down) on the average, during the next 12 months?” The survey contains probes if respondents indicate that they “don’t know” the answer to the first question or report “stay the same” or if respondents answer more than 5 percent to the second question. Return to 1
- The questionnaire for the SCE is available via https://www.newyorkfed.org/medialibrary/interactives/sce/sce/downloads/data/frbny-sce-survey-core-module-public-questionnaire.pdf. The SCE has multiple inflation questions for the 12-month-ahead horizon, two that focus on respondents’ point expectations of inflation and one that captures the probabilities that consumers assign to various inflation and deflation bins. All of the questions focus on inflation and/or deflation. Return to 2
- We thank Mark Bils for the conversations that helped to motivate the development of this question. Return to 3
- We provide the example in parentheses to highlight and reinforce our interest in the percent change in income needed to offset the expected percent change in prices. Preliminary analysis, based on randomizing the percent changes in the example and whether the example provided increases or decreases in prices and incomes, suggested that the example values provided had essentially no effect on responses. As detailed below, very few respondents report decreases in their income, a situation further suggesting that the practical influence of this example on responses is very small. Return to 4
- Because inflation does not typically affect all prices to the same extent, the substitution effect would posit that individuals may choose to decrease spending on those items whose prices rise by relatively more and increase spending on those items whose prices rise by relatively less. We attempt to fix the basket by focusing on buying “the same amount of goods and services as today,” making our inflation measure akin to a Laspeyres-based inflation rate. This explanation relies on a first-order approximation to get around Jensen’s inequality; further investigation of this point is warranted but beyond the scope of this Commentary. Return to 5
- We omit a column for survey data that were collected starting in late February 2021. Return to 6
- While the response option “stay about the same” could be nudging responses to zero, depending on how the term “about” is interpreted, we ran a small randomized test and found essentially identical answer patterns to our baseline set of response options and an alternative set of response options that instead used “Stay the same.” Return to 7
- As one example, nominal debt contracts (e.g., mortgage payments) would not be changed by falling prices, making them more difficult to service if income were to fall. Return to 8
- The decline in the level of agreement among respondents who report zero percent is associated with increases in CPI inflation in the United States, a situation hinting at a positive relationship between disagreement and inflation over time and echoing evidence provided by Falck et al. (2021). Return to 9
- We compare our inflation expectations measure with CPI inflation rather than inflation in the price index for personal consumption expenditures (PCE) for two reasons. First, PCE inflation puts considerable weight on expenditures made on behalf of households for things such as medical care instead of out-of-pocket spending, items which consumers may not appreciate as being part of their consumption baskets when thinking about inflation. Second, the Laspeyres nature of our indirect inflation expectations measure is closer to CPI inflation than to PCE inflation. Return to 10
References
- Binder, Carola C. 2017. “Measuring Uncertainty Based on Rounding: New Method and Application to Inflation Expectations.” Journal of Monetary Economics 90 (October): 1–12. https://doi.org/10.1016/j.jmoneco.2017.06.001.
- D’Acunto, Francesco, Ulrike Malmendier, Juan Ospina, and Michael Weber. 2021a. “Exposure to Grocery Prices and Inflation Expectations.” Journal of Political Economy 129 (5): 1615–39. https://doi.org/10.1086/713192.
- D’Acunto, Francesco, Ulrike Malmendier, and Michael Weber. 2021b. “Gender Roles Produce Divergent Economic Expectations.” Proceedings of the National Academy of Sciences 118 (21): e2008534118. https://doi.org/10.1073/pnas.2008534118.
- Falck, Elisabeth, Mathias Hoffmann, and Patrick Hürtgen. 2021. “Disagreement about Inflation Expectations and Monetary Policy Transmission.” Journal of Monetary Economics 118 (March): 15–31. https://doi.org/10.1016/j.jmoneco.2019.08.018.
- Gorodnichenko, Yuriy, and Dmitriy Sergeyev. 2021. “Zero Lower Bound on Inflation Expectations.” Working paper 29496. National Bureau of Economic Research. https://doi.org/10.3386/w29496.
- Malmendier, Ulrike, and Stefan Nagel. 2016. “Learning from Inflation Experiences.” The Quarterly Journal of Economics 131 (1): 53–87. https://doi.org/10.1093/qje/qjv037.
Suggested Citation
Hajdini, Ina, Edward S. Knotek II, John Leer, Mathieu Pedemonte, Robert W. Rich, and Raphael S. Schoenle. 2022. “Indirect Consumer Inflation Expectations.” Federal Reserve Bank of Cleveland, Economic Commentary 2022-03. https://doi.org/10.26509/frbc-ec-202203
This work by Federal Reserve Bank of Cleveland is licensed under Creative Commons Attribution-NonCommercial 4.0 International

