

- Share
What’s Holding Back Employment in the Recovery from the COVID-19 Pandemic?

The views authors express in Economic Commentary are theirs and not necessarily those of the Federal Reserve Bank of Cleveland or the Board of Governors of the Federal Reserve System. The series editor is Tasia Hane. This paper and its data are subject to revision; please visit clevelandfed.org for updates.
Introduction
When the World Health Organization declared SARS-CoV-2 (COVID-19) a pandemic in March 2020, US businesses shut down, millions of people were laid off or furloughed, and unemployment skyrocketed. As restrictions loosened and business opened back up, anecdotal reports from early in the recovery included reports that many firms were unable to staff their businesses despite the high unemployment rate. Today, the labor market has tightened substantially, with unemployment rates well below 5 percent nationwide, but many previously employed individuals are neither working nor looking for work. We use survey data on nonemployment from the Census Bureau’s Household Pulse Survey (HPS) to examine the reasons why nonemployed people are not working and how these reasons have shifted throughout the pandemic. The HPS offers detailed reasons for nonemployment and information on pandemic-related life changes that we use to describe larger trends in the aggregate labor force. We find that the number of people who are nonemployed because of labor-demand reasons such as furloughs and firm closures has decreased, while nonemployment for labor-supply reasons such as lack of childcare and fear of the virus have risen from May 2020 to October 2021. The lack of progress in nonemployment because of a lack of childcare, virus concerns, or other supply-side reasons highlights the potential barriers to employment that must be addressed in order to bring workers back to the labor force.
Detailed reasons for not working
The HPS asks respondents if they worked for pay in the previous week, and if they were not working, it asks them to select the main reason why. The answers fall into two general categories, labor supply and labor demand. Supply reasons are personal circumstances or choices unrelated to an employer that prevent nonemployed people from working, such as lack of child- or eldercare, fear of the virus, or lack of transportation.1 Demand reasons are actions taken by employers that cause nonemployment for people who would otherwise be working.2 This includes layoffs, furloughs, and business closures in response to COVID-19.3
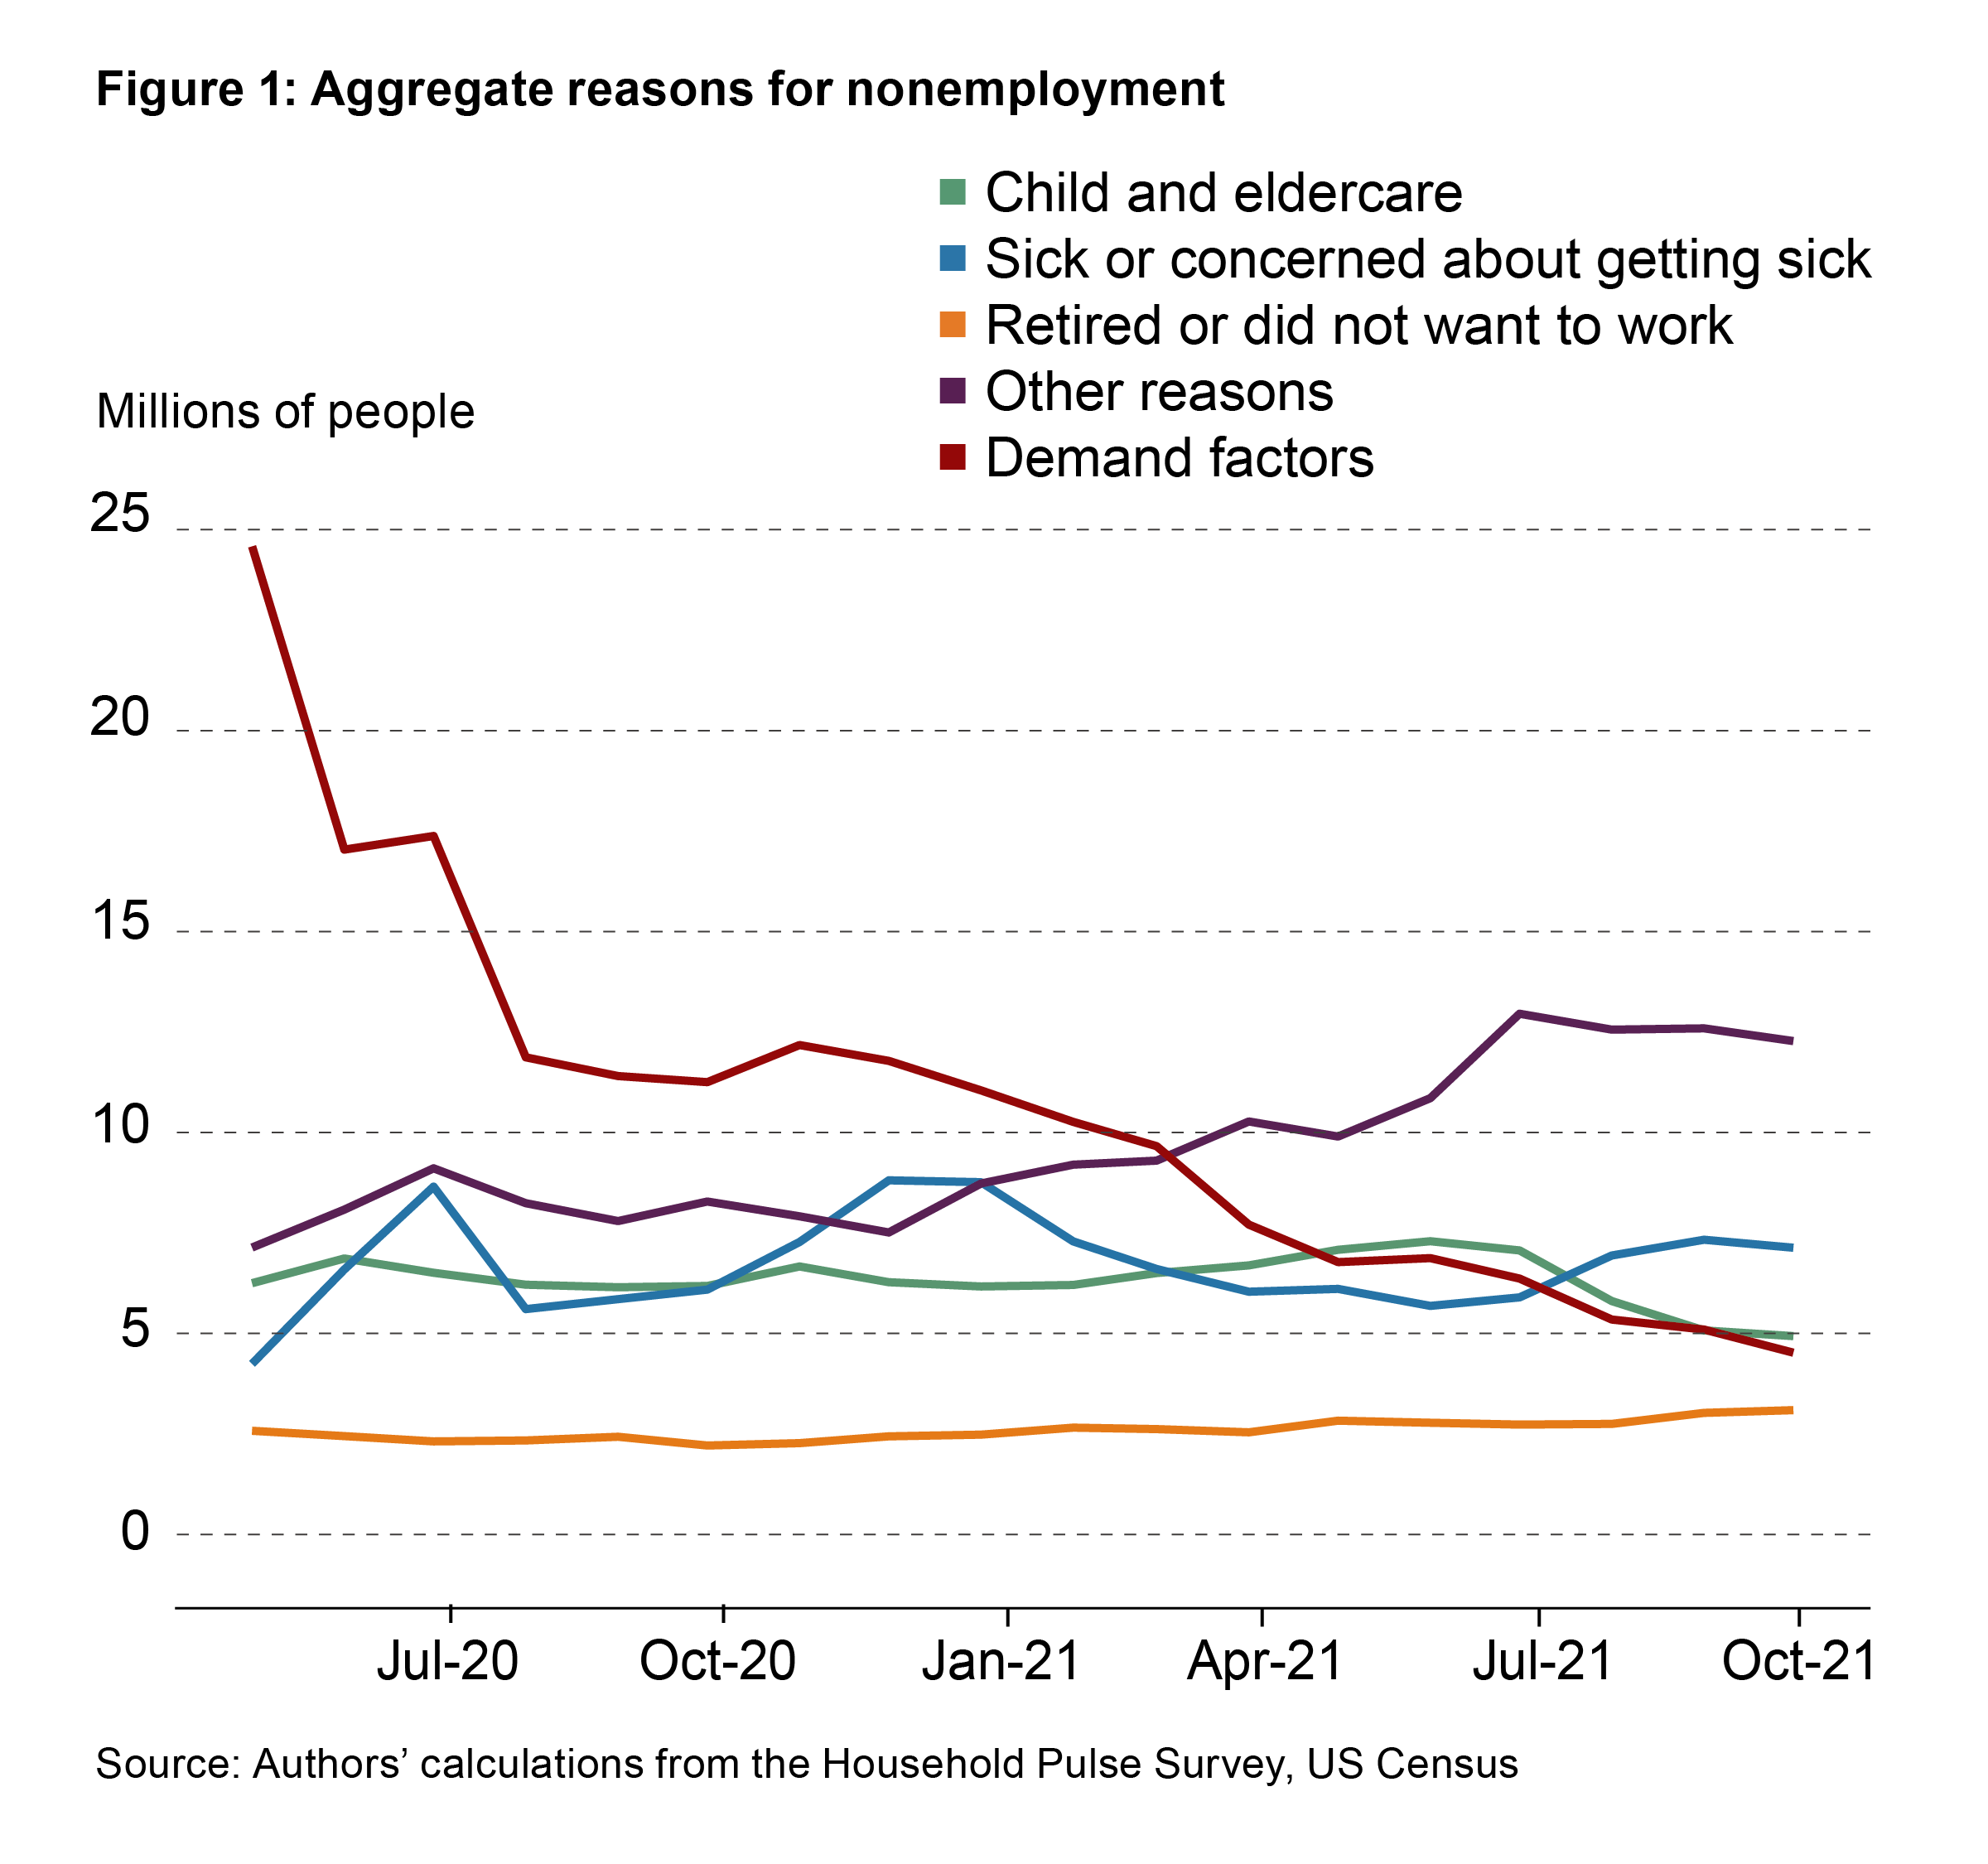
Figure 1 shows the main reasons for nonemployment over time for all prime-age people. Most nonemployment was due to lack of demand at the start of the pandemic, but the share of the prime-age nonemployed population in this category has decreased substantially since May 2020 from 21 percent of all prime-age people near the start of the pandemic to 4 percent. Conversely, total nonemployment because of supply reasons has increased from 14 percent to 19 percent among all prime-age people. Among prime-age people, the percent who are retired or do not want to work has been relatively low and stable across the period. Child- and eldercare has been an important limiter of labor supply but dipped in reason given as recently as this fall, when many schools reopened. Sickness and concerns about sickness have been persistent and show the importance of variations in COVID-19 case rates in limiting labor supply. Finally, “other reasons” had been rising until recently, a fact we will address later in this Commentary. Total nonemployment has decreased over the period,4 but demographic differences in major reasons for nonemployment and total levels of nonemployment have made this progress uneven across demographic groups.
Demographic analysis
While total nonemployment has decreased for all groups, examining differences in reasons for nonemployment by demographic group demonstrates where barriers persist and which communities are most affected by specific barriers to employment. To aid interpretation, we collapse related reasons into categories: employers’ labor demand; self-reported sickness and concerns about COVID-19; child- and eldercare responsibilities; retirement and not wanting a job; and nonspecific reasons (including those answering “other reasons”).5 This aggregation also reduces some problems with how households’ interpretation of the pandemic has changed over time. For example, early data show a relatively high rate of non-COVID-19-related sickness, but households had few testing options and may have thus underreported COVID-19-related sickness.
Figure 2 shows the breakdown by gender of reasons for nonemployment. Overall, the nonemployment rate has decreased for both men and women; however, men’s nonemployment has decreased faster than women’s nonemployment. There are large differences in supply reasons for nonemployment between men and women, as well, especially in child- and eldercare: 1.5 percent of men are not working because of child- or eldercare issues, compared to 6.6 percent of women. Other reasons for nonemployment were higher for women in 2020 and have remained higher for women compared to for men. Taken together, women seem to have several additional barriers to employment that are not resolving as quickly as are the major issues for men. It is also worth noting that despite a widely reported retirement boom, retirements in the prime-age workforce for both men and women have not been a large factor keeping people from working.
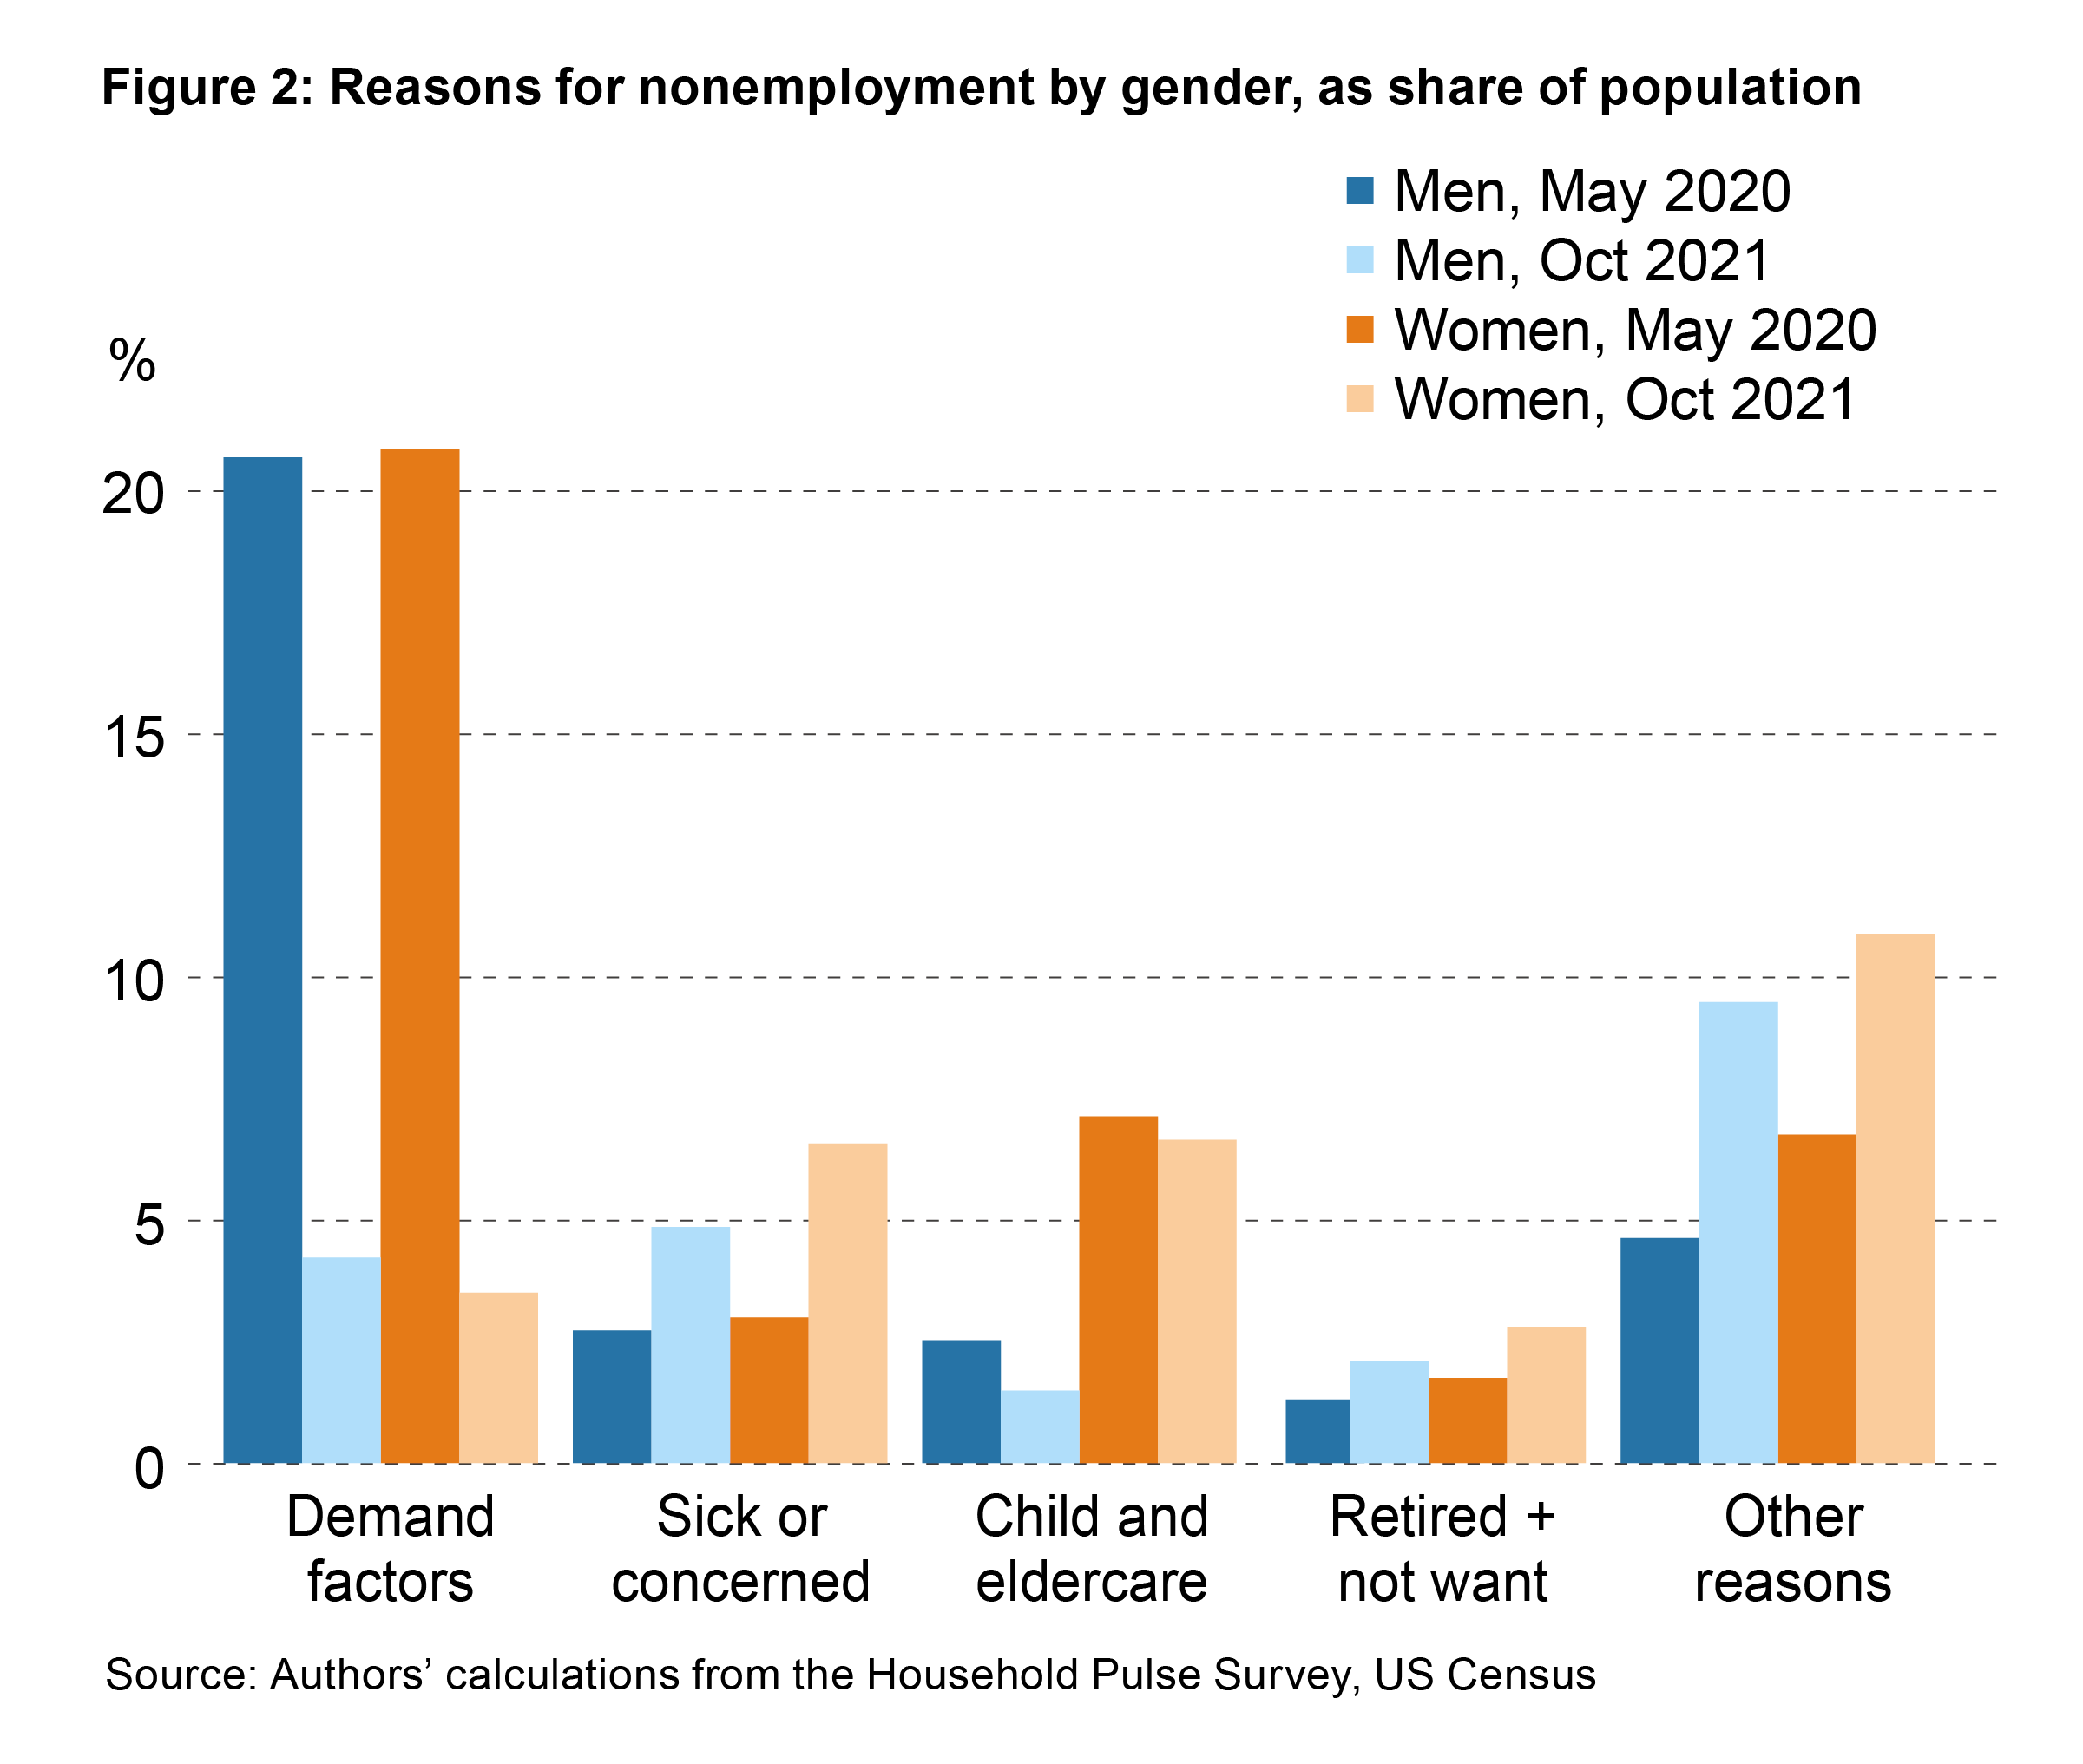
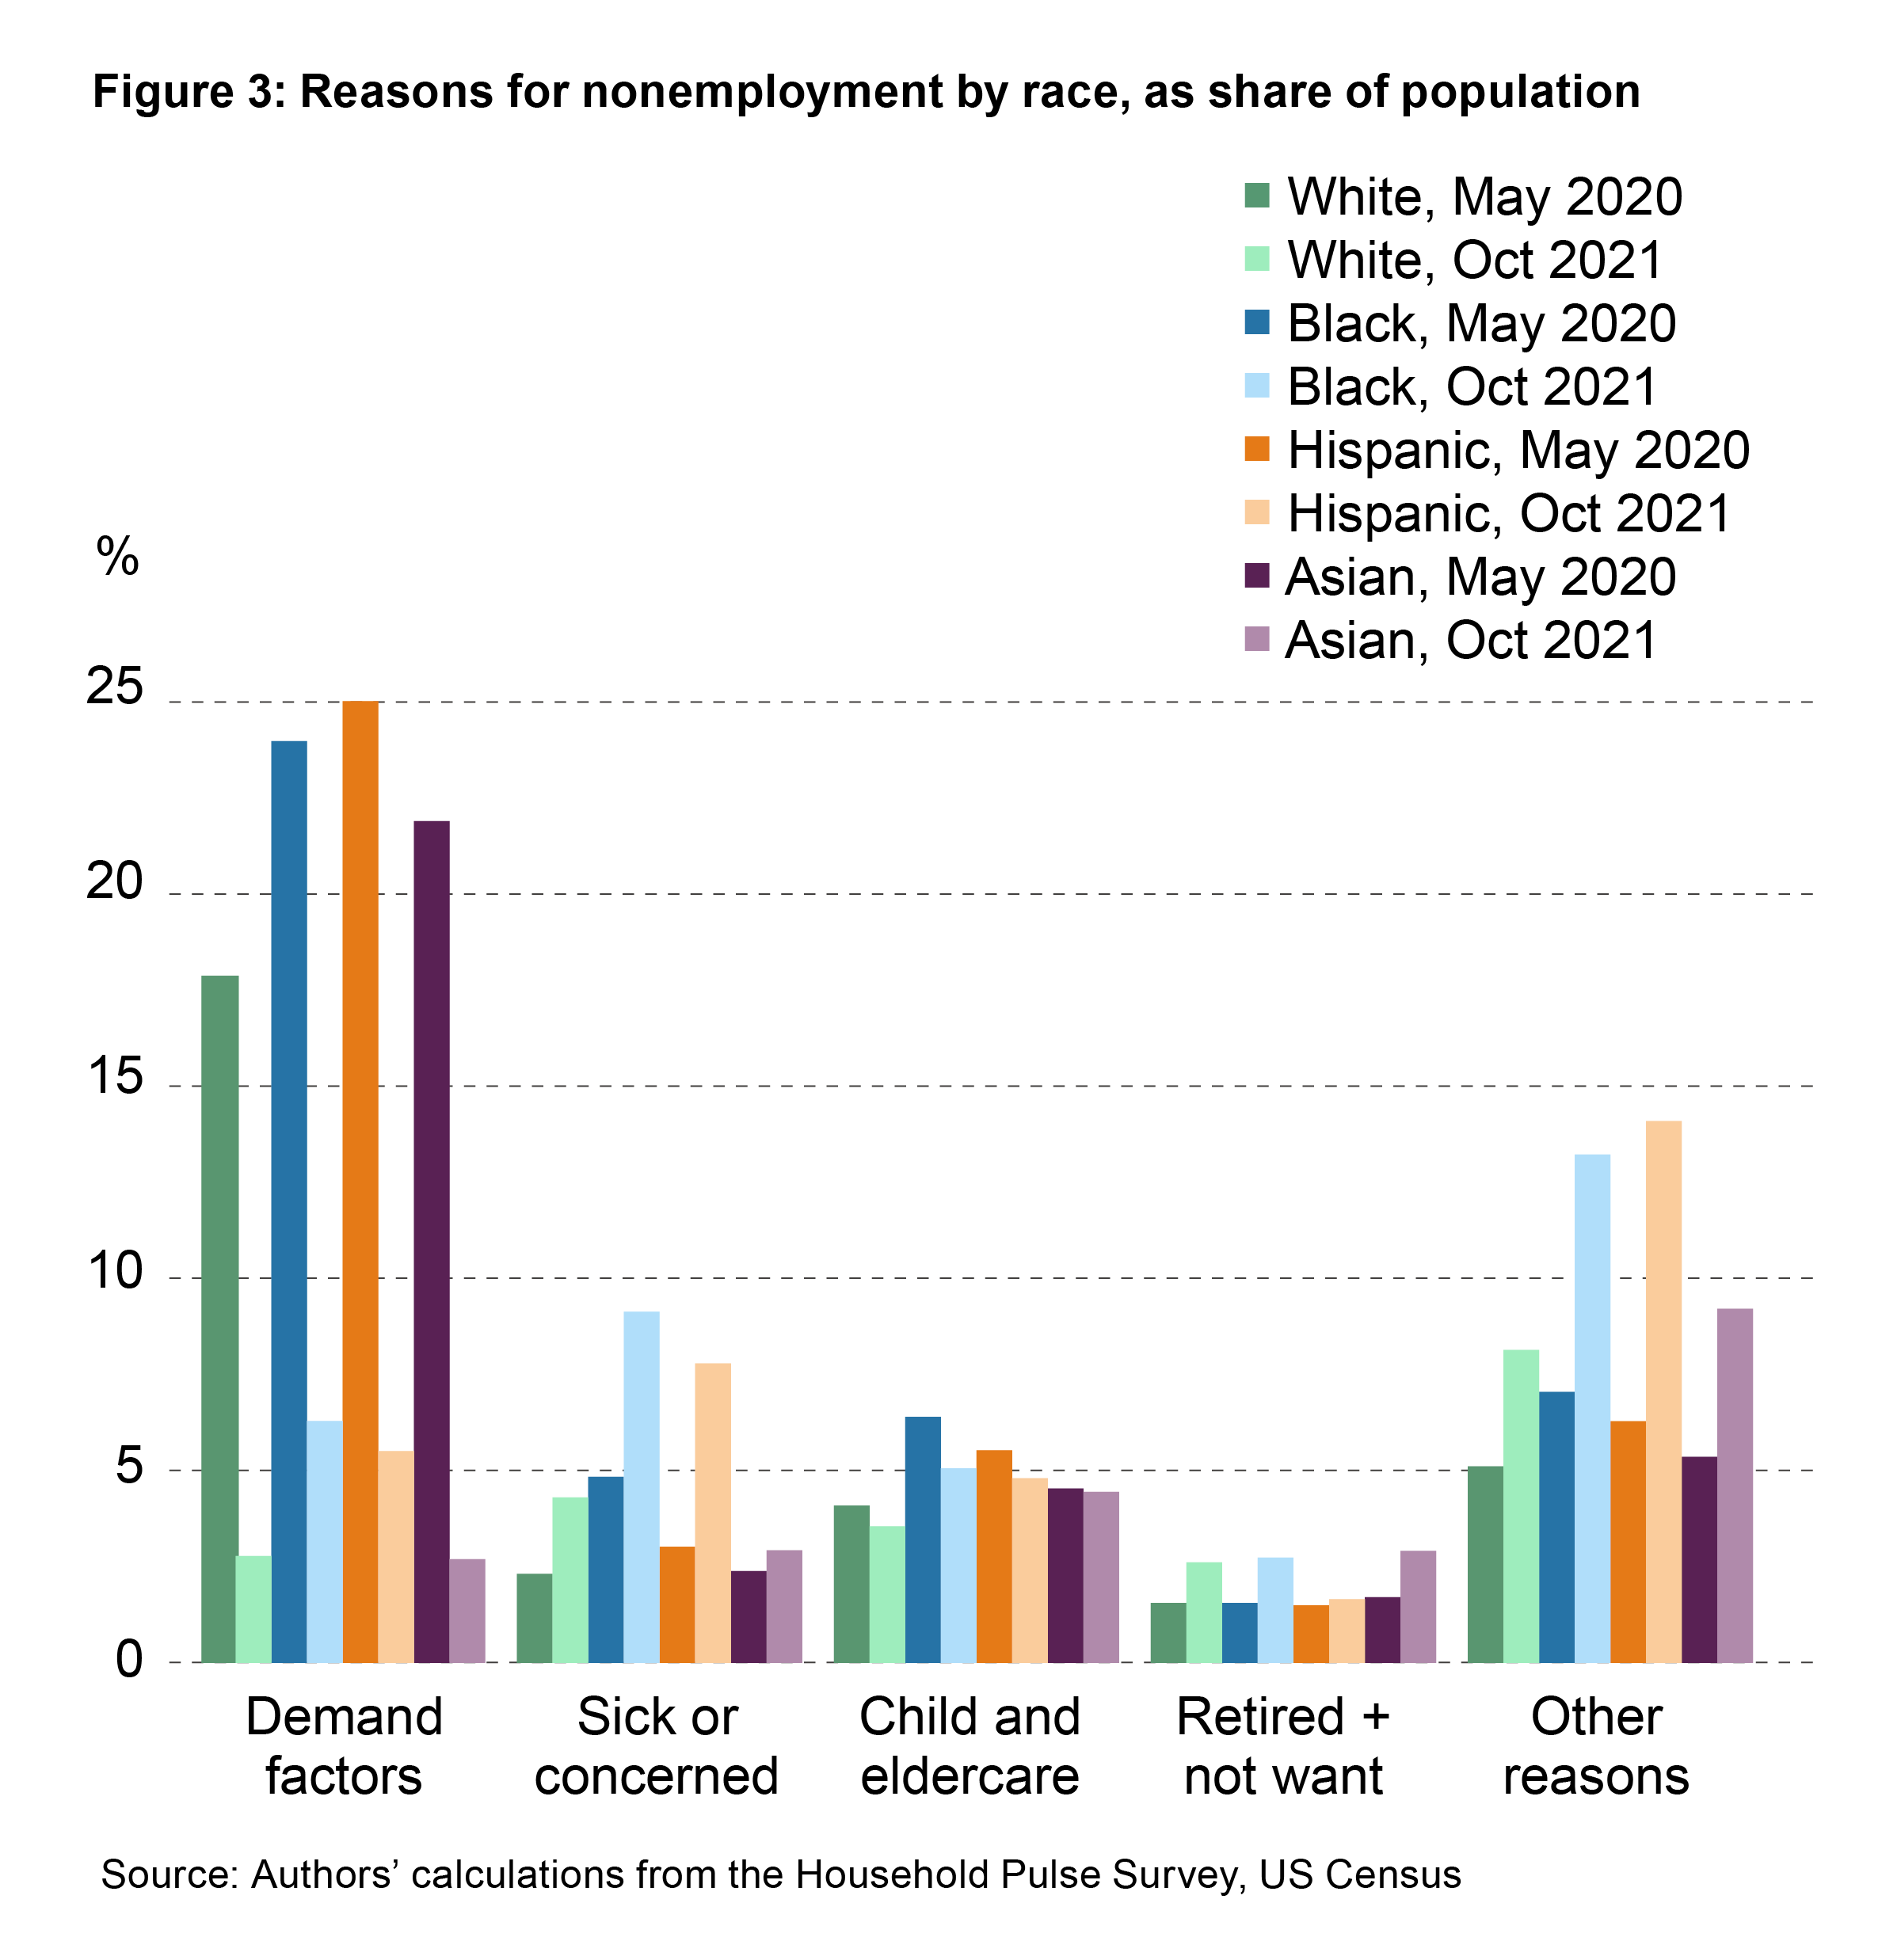
Figure 3 shows a similar chart categorized by race and ethnicity.6 Total nonemployment has been decreasing across all races and ethnicities, but the overall nonemployment rate varies substantially. Prime-age Asian and white people have lower overall nonemployment rates, at 22 percent and 21 percent, respectively, compared to the 35 percent and 32 percent rates, respectively, for Black and Hispanic people. Demand reasons for nonemployment have decreased substantially across all races and ethnicities, but the percent of the population that is nonemployed for demand reasons was and still is larger for Black and Hispanic people than for Asian and white people. This gap is likely a result of higher layoffs and furloughs among racial and ethnic minority workers and more business closures in racial or ethnic minority-owned firms and in sectors in which there are disproportionately large numbers of racial and ethnic minority workers (AP News, 2021; Misera, 2020; Gould and Kassa, 2020).
Nonemployment for supply reasons has increased for all races and ethnicities over the period. Black and Hispanic people have the highest rate of nonemployment for supply reasons, at 25 percent and 23 percent, respectively, compared to 17 percent for Asian people and 16 percent for white people. Sickness and fears of COVID-19 appear to be greater obstacles to employment for Black and Hispanic people than for Asian and white people. These obstacles have not been fully alleviated over the course of the pandemic.
Across both race and ethnicity and gender, the key explanations for nonemployment are sickness and concerns about COVID-19, child- and eldercare, and unspecified and other reasons. We examine what the HPS and other sources can reveal about these reason categories with an eye on the potential persistence of these nonemployment categories.
Sickness and concerns about COVID-19
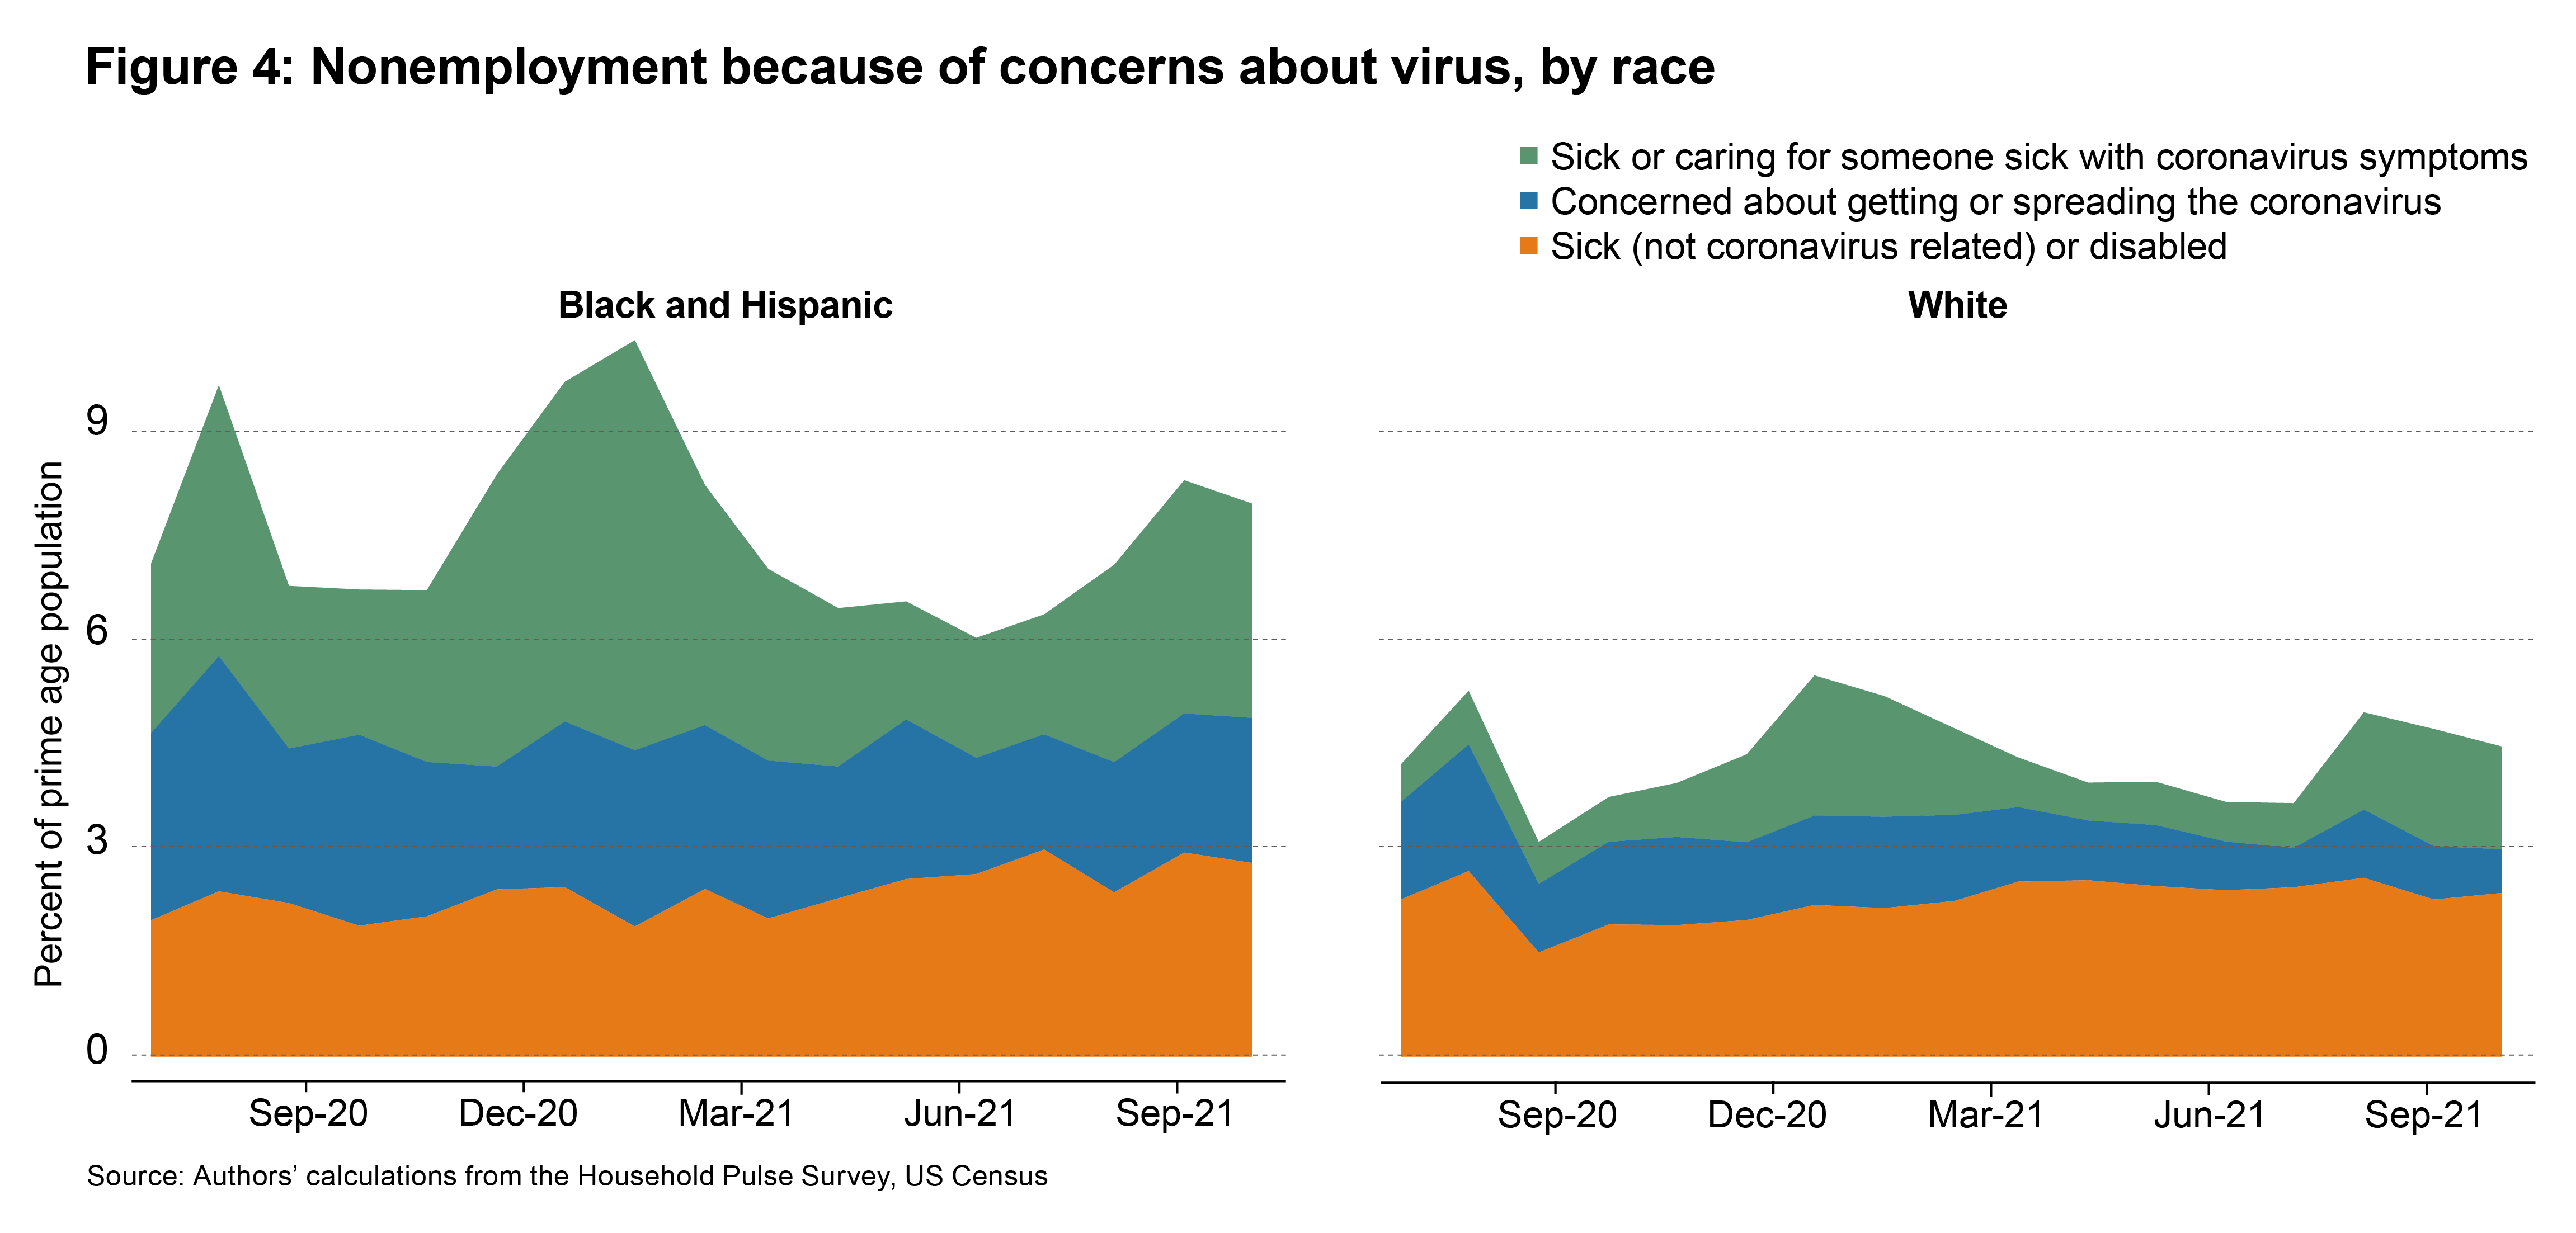
Sickness and concern about COVID-19 appear to differ across groups. Looking at nonemployment because of self-reported sickness, we see that Black and Hispanic people had significantly higher rates of sickness with COVID-19 compared to white people, with a peak sickness rate more than three times higher than that of white people. The HPS response includes people reporting sicknesses that may not have been confirmed by testing and includes individuals who were caring for others with COVID-19 symptoms. Black and Hispanic people are also twice as likely as white people to be nonemployed because of concerns about catching or spreading COVID-19. These differences in virus concern could be partly a result of differences in average occupational exposure to the virus and differences in household composition that lead to Black and Hispanic workers’ being more likely to live with someone who is at high risk of severe illness if infected with COVID-19. Black and Hispanic workers are overrepresented in occupations with a high risk of exposure to COVID-19, including occupations that require in-person participation, often in close contact with other people, and they are also significantly more likely to live in multigenerational households than are white workers (Dubay et al., 2021). Together this means that employment for Black and Hispanic workers is on average riskier when considering their risk of exposure and consequent risks to family members who may be more likely to include older adults at greater risk of serious illness. This additional risk could make Black and Hispanic workers more likely to leave their jobs or decline new jobs and remain nonemployed because of virus concerns, a situation which leads to a higher share of that population who are nonemployed for this reason.
Black and Hispanic populations have not seen a significant decrease in the share who are nonemployed because of virus concerns in spring 2021, when vaccines became widely available to adults in the United States. This lack of difference may point to additional barriers to vaccination in this population. As of November 1, 2021, just 57 percent of eligible Black people are fully vaccinated, compared to 63 percent of white people, 66 percent of Hispanic people, and 80 percent of Asian people7 (Ndugga et al., 2021). In the most recent week of HPS microdata from September 29 through October 11, the two most commonly cited reasons for not getting vaccinated among Black people eligible for vaccination are concern about possible side effects and a lack of trust in COVID-19 vaccines. This distrust is consistent with the comparatively higher levels of distrust in COVID-19 vaccines among Black Americans seen in other surveys and “stems directly from historical and ongoing discrimination and racism experienced by Black communities” (Bogart et al., 2021). This ongoing hesitance to get vaccinated and the constant rate of nonemployment because of virus concerns among Black people may imply that progress in this category could be slow without sharper declines in case rates, transmission, and overall threat of the virus, particularly for Black and Hispanic people.
Child- and eldercare
Figure 1 reveals that child- and eldercare has been a persistent factor keeping workers from reentering the workforce, and it has started to diminish only recently. Figure 2 revealed a clear split in this reason by gender. For men, this rate was fairly constant from May 2020 through July 2021, accounting for between 6 percent and 8 percent, or 0.9 million men of prime age who were not working, while for women this rate increased from 17 percent to its peak in July 2021 of 28 percent, or 5.7 million women. Eldercare (which is separately reported in the HPS) is a factor holding some individuals out of work; it is a relatively steady component over this period for both men and women. In September and October 2021, the fraction of the population citing childcare reasons for nonemployment stepped down for both men and women as schools reopened to in-person schooling, but nonemployment because of childcare issues remained elevated for women compared to for men. The HPS data collection does not start until after the pandemic had been declared, so we do not know how many of these women were not in the labor force before the pandemic, but this differential in the number of men and women not working because of childcare responsibilities shows that the majority of the pandemic-related childcare burden has fallen disproportionally on women. This burden has been especially heavy for Black and Hispanic women who are the most likely to cite childcare as their reason for nonemployment.
A change in the wording of the survey between the 14-day periods ending on July 5 and August 2 reveals that cost and safety concerns of childcare facilities are significant factors in the number of people experiencing childcare issues. The survey previously asked about only pandemic-related childcare closures but then changed to include inability to attend childcare because of unavailability, unaffordability, or safety concerns. The percent of prime-age women caregivers reporting childcare issues jumped 5.8 percentage points after the wording of the question changed, from 7.4 percent of prime-age women with children to 13.2 percent. This large increase shows that almost half of mothers experiencing childcare issues are doing so because of issues related to the pandemic but unrelated to pandemic-related closures specifically. This suggests that school and daycare reopenings will not be enough to bring all of these mothers back into the workforce and that one must also address affordability, availably, and safety concerns.
Sources outside the HPS also report an increase in the cost of childcare, a decrease in the availability of childcare compared to prepandemic access, and ongoing safety concerns. Seventy-two percent of families reported an increase in their childcare costs during the pandemic, and childcare centers report only 71 percent to 75 percent enrollment from prepandemic levels because of restrictions on operating capacities and severe staffing shortages (Care.com, 2021; Frank et al., 2021). Together, these two factors mean that costs are rising quickly as families compete over limited spots. This increase in cost affects primarily low-income families. In the most recent week of our reporting period, 24 percent of people who reported cut hours, losing, or leaving their jobs because of lack of childcare had a household income of less than $25,000 compared to only 11 percent of all households that fall into this income bracket. Overall, the increase in women who are reporting in the HPS that they are staying home to care for their children is effectively a signal of their leaving the labor force until childcare is both available and affordable.
Unspecific and other reasons
Finally, unspecified and “other reasons” for nonemployment have been growing since December 2020 across all demographic groups. The HPS offers respondents a wide range of reasons for not working, and these options are adapted to the changing conditions of the pandemic, but there are still other potential reasons for being out of work that are not included as options in the survey. It is inherently difficult to infer much about the “other reasons” category, but given the increasing frequency that individuals are not identifying a reason for nonemployment, it is important to further analyze this category. We use the individuals’ answers to other questions in the HPS to model which respondents are included in this category. Survey changes also make it difficult to statistically model this decision because some potentially useful information is included only briefly in the survey. In order to clarify sources of the rise in the “other reasons” category, we examined the period from May 2020 to October 2021. The extra information available throughout this period are the characteristics of the respondent (age, race, sex, education level), household income and structure, the household’s challenges in paying their mortgage and rent, and whether the household receives Medicaid benefits.
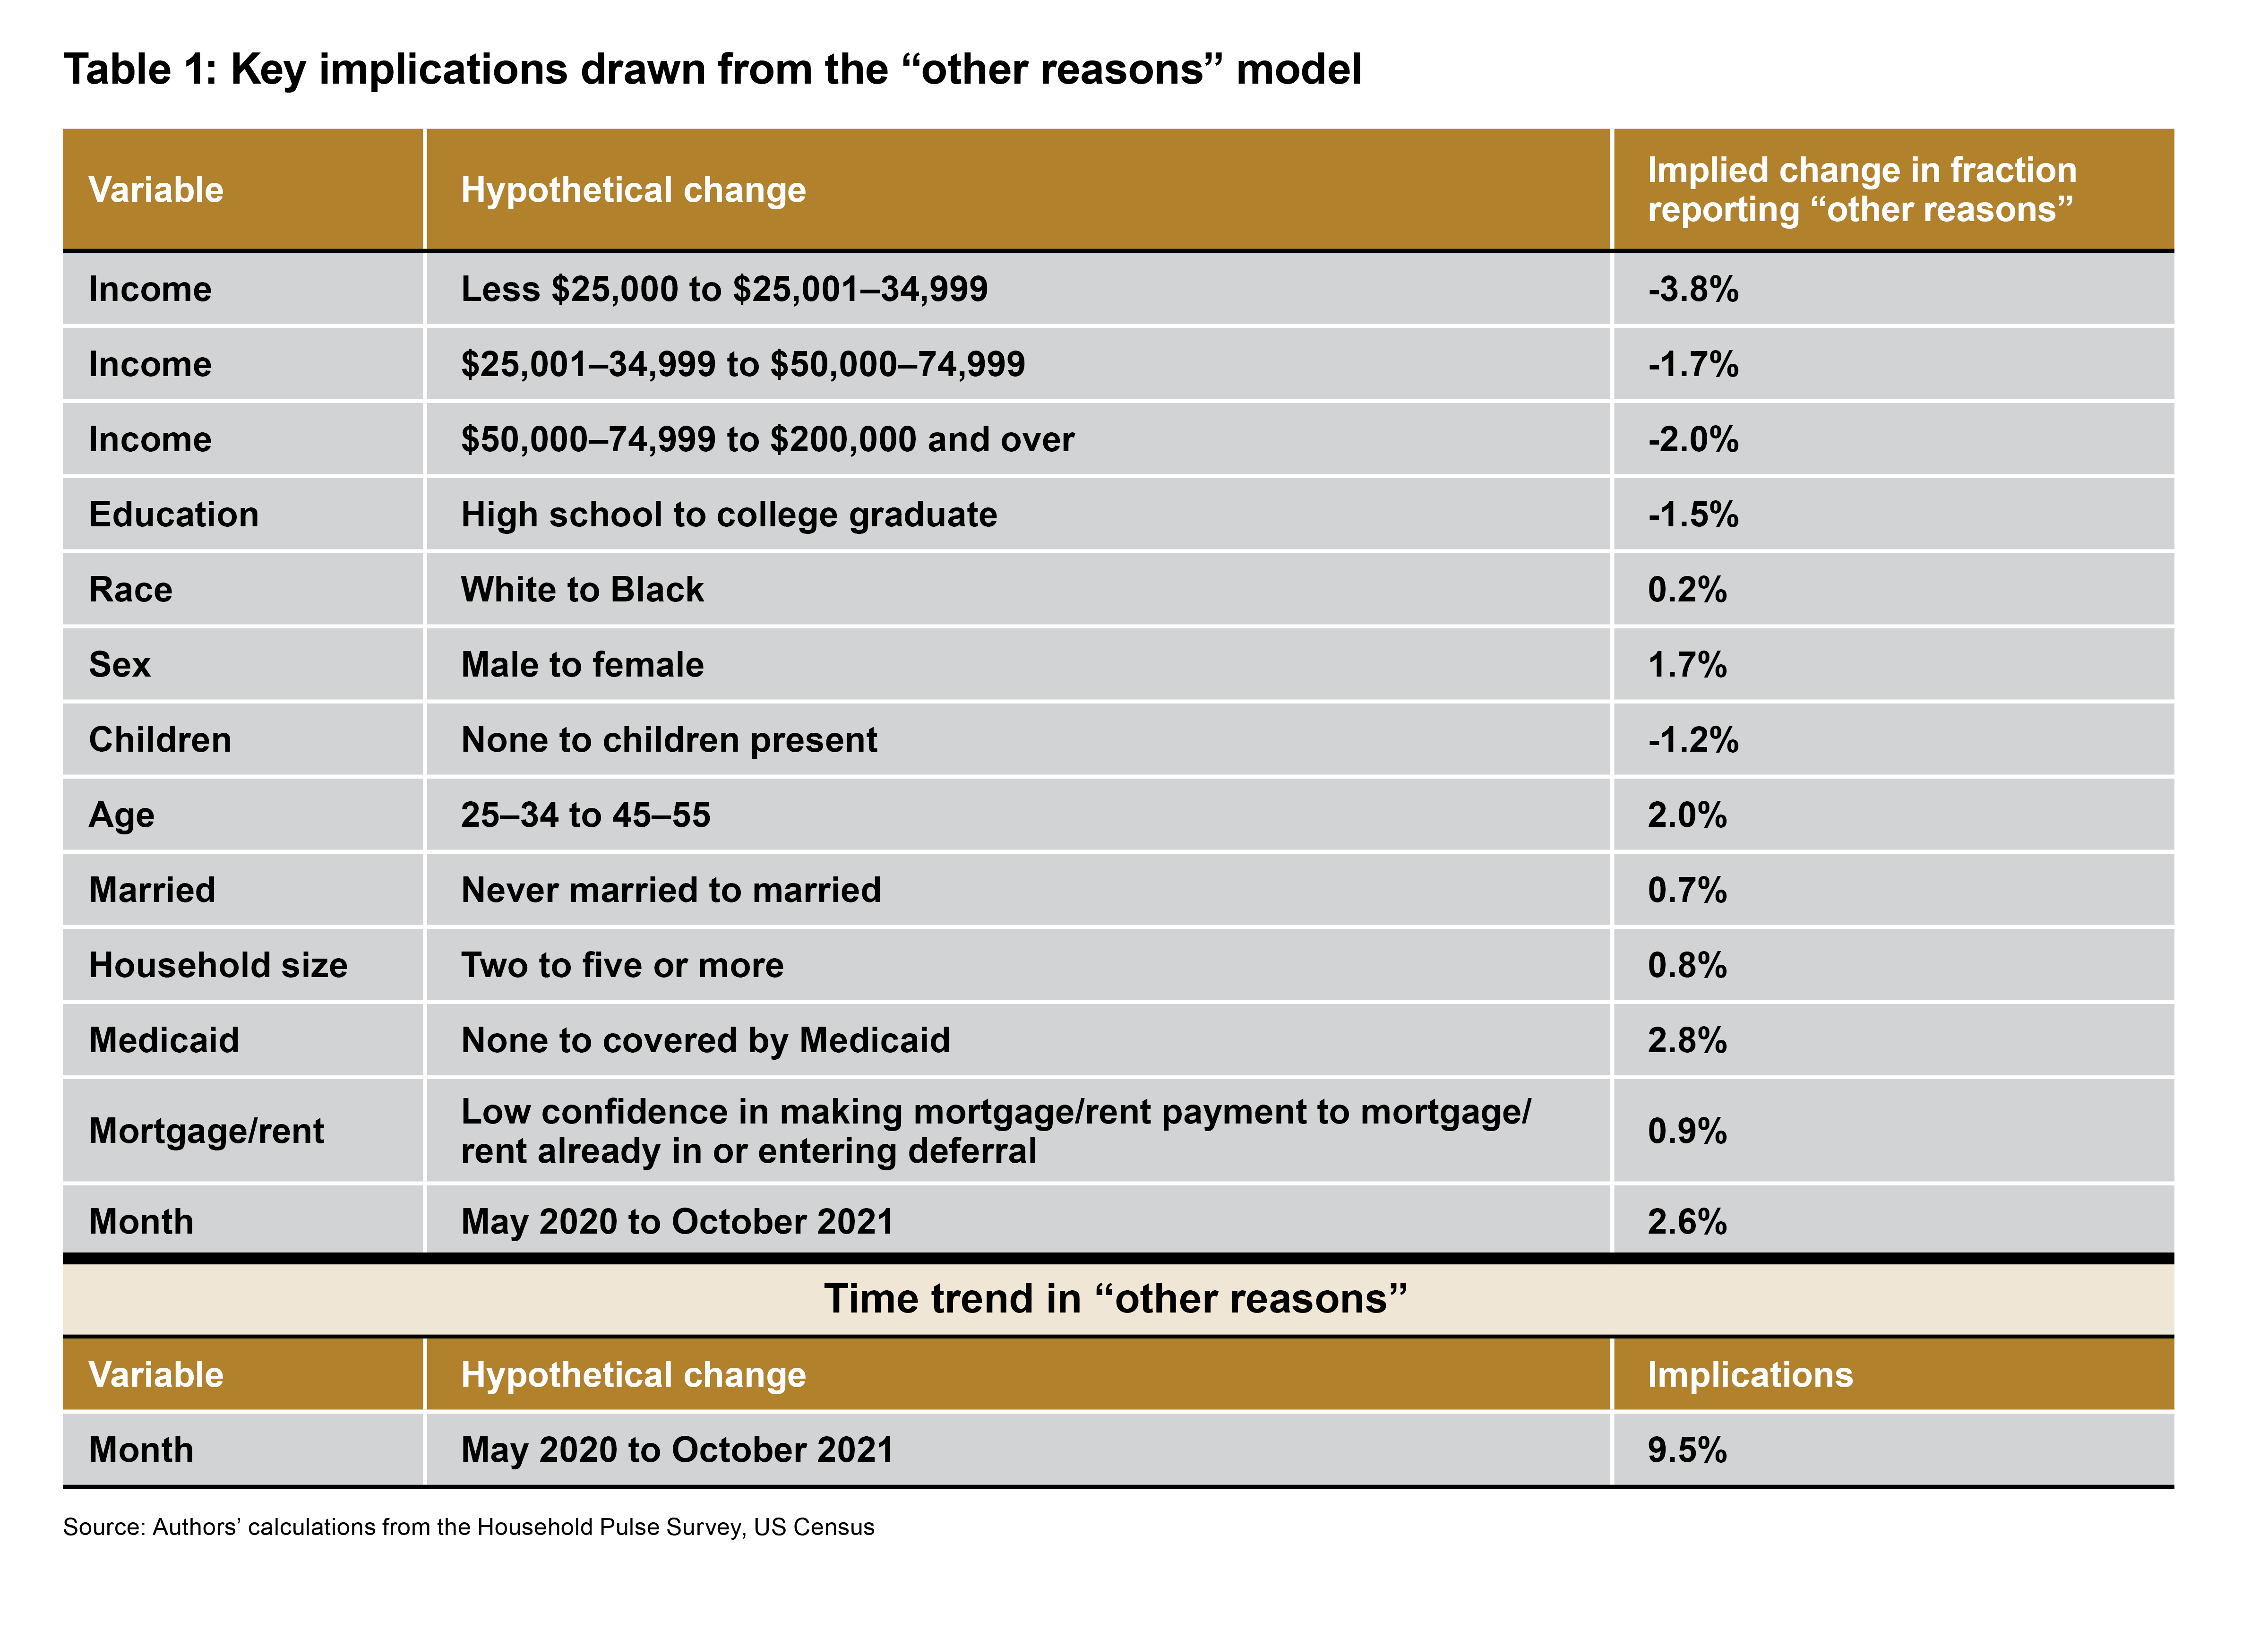
The estimated model predicts the likelihood that an individual does not provide a reason or answers “other” when asked his or her main reason for nonemployment relative to all other options (including working). The coefficients in this model are too numerous to detail. Instead, Table 1 reports the implications of key variables in the form of predicted effects. For example, the first row reports the change in the model’s prediction of an individual with a household income of less than $25,000 reporting “other reasons” if they instead had a household income between $25,000 and $34,999. This implication holds all other characteristics (e.g., race, education, sex) constant so that the prediction is for an income increase. The model is able to parse the relevant differences in the population because there are many observations in each category with a full range of other characteristics. The implied changes shown in the table can be compared to average levels of reporting other reasons that ranged from roughly 5 percent to 15 percent of the population during this period.
The most important variable is household income: The lowest-income households are far more likely to choose the “other reasons” category. It is also the case that less-educated individuals, women, people without children present, older people, married people, and older prime-age individuals all have a higher likelihood to report “other reasons” than being employed or citing one of the survey’s specified reason for nonemployment. On the benefits side, receiving Medicaid, federal health insurance for lower-income households, significantly boosts the reporting of “other reasons.” Together, these results suggest that the population reporting “other reasons” is a relatively disadvantaged group, but many of the relevant variables are demographic and are unlikely to change much in just more than a year.
To fully account for the rise in “other reasons” responses, the model includes monthly base estimates that match the rise in other responses not explained by the variables included in the model. These monthly base estimates rise 2.6 percent from May 2020 to October 2021. An alternative model that includes only month estimates would have predicted a 9.5 percentage point increase in “other reasons” responses, so including the demographics and other controls explains almost three-quarters of the rise.
A key factor in modeling the rise in “other reasons” responses is that the number of people reporting the lowest household income category (less than $25,000) has been increasing. This is happening despite the fact that income levels are rising on average for prime-age people during this period. People in this lowest income category have sharply higher rates of reporting “other reasons.” Other work on low-income people’s labor market options points out the importance of benefits cliffs, in which an individual may lose valuable benefits that more than offset income gains from working more or even at a higher wage rate.8 The strong Medicaid effects are also consistent with the possibility of benefits tradeoffs being important to low-income potential workers. In any case, the pattern of lower participation by low-income and less-educated groups has persisted for decades. The groups overrepresented in the “other reasons” category likely face persistent challenges that will not be quickly addressed in the recovery or by a reduction in COVID-19 case rates.
Conclusion
The Household Pulse Survey shows that while the initial shock from the pandemic affected mostly labor demand, persistent supply-side barriers have kept previously employed people from returning to employment. There are various distinct reasons why people are not returning to employment, and the severity of these issues varies by demographic group. Some of these reasons for nonemployment point to persistent shifts in the labor force that may not resolve with the end of the pandemic. The lack of affordable and accessible childcare largely affects women with young children and will likely continue to keep some of these women out of the labor force even after the end of the pandemic because of the increased cost of childcare and the long-term job separations experienced by these mothers. Differences in virus fears and virus risks may make return to employment slower for Black workers, especially in areas with low vaccination rates. The largest category of reasons is “other reasons,” but lower-income and less-educated individuals are substantially overrepresented in this category. These individuals have long had lower workforce participation rates, and research on the benefits cliffs has revealed many situations in which increasing work can lower family incomes because of discrete cutoffs for other benefits. These distinct barriers all have different implications for the labor force and different solutions beyond ending the current public health crisis. By distinguishing which reasons for nonemployment are most limiting for each demographic group, we can better design policies that will help address specific issues for the populations most affected.
Footnotes
- Complete list of supply reasons: “I did not want to be employed at this time,” “I was sick with coronavirus symptoms,” “I was caring for someone with coronavirus symptoms,” “I was caring for children not in school or daycare,” “I was caring for an elderly person,” “I was concerned about getting or spreading the coronavirus,” “I did not have transportation to work,” “I am/was sick (not coronavirus related) or disabled,” and “I am retired.” Return to 1
- Complete list of demand reasons: “My employer experienced a reduction in business (including furlough),” “I was laid off,” “My employer closed temporarily,” and “My employer went out of business.” Return to 2
- The phrasing of these questions is around COVID-19. It is possible for businesses to reduce labor for other reasons, but it appears that respondents linked most business cutbacks to COVID-19 during this period. Return to 3
- See the appendix online for a comparison of employment in the HPS compared to official labor force statistics from the BLS’s Current Population Survey. Return to 4
- Labor demand responses are “I was laid off or furloughed due to coronavirus pandemic,” “My employer closed temporarily due to the coronavirus pandemic,” and “My employer went out of business due to the coronavirus pandemic.” Sickness and concerns about COVID-19 reasons are “I was caring for someone or sick myself with coronavirus symptoms,” “I was concerned about getting or spreading the coronavirus,” and “I was sick (not coronavirus related) or disabled.” Child and eldercare reasons are “I was caring for children not in school or daycare” and “I was caring for an elderly person.” Retirement and not wanting a job reasons are “I did not want to be employed at this time” and “I am retired.” Other reasons include “Other reason,” “Did not report reason,” and “I did not have transportation to work.” Return to 5
- While the BLS uses overlapping categories, we use the HPS to report race and ethnicity in nonoverlapping categories so that the white, Black, and Asian categories exclude respondents who identify as Hispanic and so that Hispanic is its own category. Return to 6
- As of November 1, 2021, people eligible for vaccines include those aged 12 and older. This analysis considers only members of the population eligible for vaccination. Return to 7
- The Federal Reserve Bank of Atlanta has a useful summary benefits cliffs and online tool that demonstrates how large they can be: What Are Benefits Cliffs? Federal Reserve Bank of Atlanta (atlantafed.org). Return to 8
References
- Bogart, Laura M., Lu Dong, Priya Gandhi, Samantha Ryan, Terry L. Smith, David J. Klein, Luckie-Alexander Fuller, Bisola O. Ojikutu, James Aboagye, and Brandon Harrison. 2021. “Black Americans Cite Low Vaccine Confidence, Mistrust, and Limited Access as Barriers to COVID-19 Vaccination.” Research Brief RB-A1110-1. RAND Corporation. https://doi.org/10.7249/RBA1110-1.
- Byrd, W. Michael, and Linda A. Clayton. 2001. “Race, Medicine, and Health Care in the United States: A Historical Survey.” Journal of the National Medical Association 93 (3 Suppl): 11S-34S. https://www.ncbi.nlm.nih.gov/pmc/articles/PMC2593958/.
- Care.com Editorial Staff. 2021. “This Is How Much Child Care Costs in 2021.” Care.Com. June 10, 2021. https://www.care.com/c/how-much-does-child-care-cost.
- Dubay, Lisa, Joshua Aarons, Steven Brown, and Genevieve M. Kenney. 2020. “How Risk of Exposure to the Coronavirus at Work Varies by Race and Ethnicity and How to Protect the Health and Well-Being of Workers and Their Families.” Research Report. Urban Institute. https://www.urban.org/research/publication/how-risk-exposure-coronavirus-work-varies-race-and-ethnicity-and-how-protect-health-and-well-being-workers-and-their-families.
- Federal Reserve Bank of Atlanta. n.d. “What Are Benefits Cliffs?” Accessed November 24, 2021. https://www.atlantafed.org/economic-mobility-and-resilience/advancing-careers-for-low-income-families/what-are-benefits-cliffs.
- Frank, Gillian, Lauren Hogan, Michael Kim, Johnette Peyton, and Lucy Recio. 2021. “Progress and Peril: Child Care at a Crossroads.” Pandemic Surveys. National Association for the Education of Young Children. https://www.naeyc.org/sites/default/files/globally-shared/downloads/PDFs/resources/blog/naeyc_july_2021_survey_progressperil_final.pdf.
- Fredr. 2021. https://cran.r-project.org/web/packages/fredr/vignettes/fredr.html.
- Gould, Elise, and Melat Kassa. 2020. “Young Workers Hit Hard by the COVID-19 Economy: Workers Ages 16-24 Face High Unemployment and an Uncertain Future.” Report 203139. Economic Policy Institute. https://epi.org/203139.
- Mays, Vickie M., Susan D. Cochran, and Namdi W. Barnes. 2007. “Race, Race-Based Discrimination, and Health Outcomes Among African Americans.” Annual Review of Psychology 58 (1): 201–25. https://doi.org/10.1146/annurev.psych.57.102904.190212.
- Misera, Lucas. 2020. “An Uphill Battle: COVID-19’s Outsized Toll on Minority-Owned Firms.” Community Development Brief. Federal Reserve Bank of Cleveland. https://doi.org/10.26509/frbc-cd-20201008.
- Morrison, Aaron, Kat Stafford, and Emily Swanson. 2021. “AP-NORC Poll: People of Color Bear COVID-19’s Economic Brunt.” Pittsburgh Post-Gazette, March 12, 2021. https://www.post-gazette.com/news/covid-19/2021/03/12/AP-NORC-poll-People-of-color-bear-COVID-19-s-economic-brunt/stories/202103120092.
- Ndugga, Nambi, Latoya Hill, and Sweta Haldar. 2021. “Latest Data on COVID-19 Vaccinations by Race/Ethnicity.” Knight Family Foundation. Accessed November 11, 2021. https://www.kff.org/coronavirus-covid-19/issue-brief/latest-data-on-covid-19-vaccinations-by-race-ethnicity/.
- US Bureau of Labor Statistics. 1948a. “Labor Force Participation Rate - 25-54 Yrs. [LNU01300060].” FRED, Federal Reserve Bank of St. Louis. https://fred.stlouisfed.org/series/LNU01300060.
- US Bureau of Labor Statistics. 1948b. “Unemployment Rate - 25-54 Yrs. [LNU04000060].” FRED, Federal Reserve Bank of St. Louis. https://fred.stlouisfed.org/series/LNU04000060.
- US Census Bureau. 2021. “Household Pulse Survey Public Use File (PUF).” https://www.census.gov/programs-surveys/household-pulse-survey/datasets.html.
Suggested Citation
Widra, Rachel, and Mark E. Schweitzer. 2021. “What’s Holding Back Employment in the Recovery from the COVID-19 Pandemic?” Federal Reserve Bank of Cleveland, Economic Commentary 2021-23. https://doi.org/10.26509/frbc-ec-202123
This work by Federal Reserve Bank of Cleveland is licensed under Creative Commons Attribution-NonCommercial 4.0 International

