

- Share
Economic Inclusion 2000–2020: Labor Market Trends by Race in the US and States
This Commentary examines the extent to which disparities exist between Blacks and whites in labor market outcomes such as levels of labor force participation, unemployment rates, and earnings. To gauge whether disparities have narrowed or widened since 2000, national trends in these outcomes during the past two decades are compared to the trends in three states: Kentucky, Ohio, and Pennsylvania. Finally, to assess the current state of economic inclusion as reflected in the labor market, gaps in Black and white outcomes are compared across US states in 2020.

The views authors express in Economic Commentary are theirs and not necessarily those of the Federal Reserve Bank of Cleveland or the Board of Governors of the Federal Reserve System. The series editor is Tasia Hane. This paper and its data are subject to revision; please visit clevelandfed.org for updates.
Economic inclusion—defined here as a state of affairs in which all people are able to fully participate in the economy to the best of their abilities—can be measured along a number of dimensions. Labor market outcomes by race is one such dimension, and in this Commentary, I focus on it as an indicator of one aspect of economic inclusion. Focusing on the labor market, some useful metrics are the differences in outcomes attained by different groups in various labor market measures such as labor force participation rates, employment and unemployment rates, and earnings.
National estimates from the Bureau of Labor Statistics show that outcomes in the labor market differ by race. Research finds that racial disparities in the labor market ebb and flow with the business cycle, with disparities narrowing during expansions and widening during recessions (Cajner et al., 2017).1 Less is known about how those disparities vary within and across states. Do state trends mirror national economic inclusion trends? Is the level of economic inclusion consistent across states? If not, what can explain those differences?
While these differences have historically been measured at the national level, interest in measuring them at the state level has been growing. The usual source of data for state-level metrics is the American Community Survey (ACS), which publishes annual estimates of state-level labor market outcomes. But because annual ACS data are released with a nine-month lag, measures based on it are less useful for informing real-time policy decisions.2 Instead, in this Commentary, I use the Current Population Survey (CPS), which releases data monthly, to examine economic inclusion across states and in the Fourth Federal Reserve District states of Kentucky, Ohio, and Pennsylvania. The CPS is used less often because estimates must be created from CPS microdata.
Examining differences in state-level outcomes for Blacks and whites in the employment rate, the labor force participation rate, the unemployment rate, and real median hourly earnings, I find that states generally mirror national trends, but the degree of economic inclusion varies over time and across states. Disparities in employment, unemployment, and labor force participation rates have fluctuated since 2000, while gaps in earnings point to increasing disparity between Black and white workers. I also find that, focusing on 2020, labor market disparities across states can be attributed to regional variation in labor market outcomes by race, such that a Black or white worker’s experience is not the same in every state. This finding tells us that economic inclusion might be a greater concern in some states than in others and that policies may need to adapt to the specific challenges of the workforce and the industrial composition of the particular states.
Data and Methods
The data set I use is from the CPS Integrated Public Use Microdata series and consists of monthly samples that are then aggregated to produce annual estimates (Flood et al., 2020). All Black and white working-age (16 to 64 years of age) individuals in the CPS are included in a sample that covers the years 2000 to 2020.3
Four different gap-based measures capture the disparity between Black and white populations. Three of the measures (employment rate, labor force participation rate, and median real hourly earnings), are produced by subtracting the Black estimate from the white estimate, while the unemployment-rate-based measure subtracts the white estimate from the Black estimate. In this way, a positive value in the measure indicates the existence of a gap between the Black and white populations in which Black achievement is lagging white achievement, suggesting that an economy is not inclusive and disadvantages Black individuals on average. While a given point estimate may indicate the existence of a gap, small sample sizes (particularly for Black populations) add uncertainty around the point estimates. To show the degree of uncertainty surrounding a point estimate, I add 95 percent confidence intervals.4 The level of uncertainty rises in states with smaller Black populations. To avoid reporting problematic estimates, this analysis shows results only from states that have an average Black sample size greater than 500 from 2000 to 2020. There are 35 states that meet this criterion.5 National estimates aggregate data from all 50 states and the District of Columbia.
National and State Trends
In this section I focus on trends in Black and white (BW) labor market outcomes over the sample period 2000 to 2020. I first examine national trends in BW gaps for employment, labor force participation, unemployment, and earnings, and then I compare these with the trends in three states: Kentucky, Ohio, and Pennsylvania.
Employment
Estimates of the BW gap in the employment rate (also commonly known as the employment-to-population ratio) for the nation and three states are shown in figure 1. The national BW gap shows cyclical behavior such that it increases during recessions, peaks once the recession ends, and slowly declines during expansions (panel A). For example, before the 2001 recession, the national BW employment gap was 8.4 percentage points; it increased during the recession, peaking in 2003 at 10.0 percentage points; after the recession, the gap gradually declined. Similarly, in 2007 prior to the Great Recession, the gap was 9.2 percentage points, it peaked in 2011 during the recession at 11.8 percentage points, and after the recession it declined to 6.3 percentage points in 2019. In 2020, the BW employment gap grew to 8.0 percentage points.6
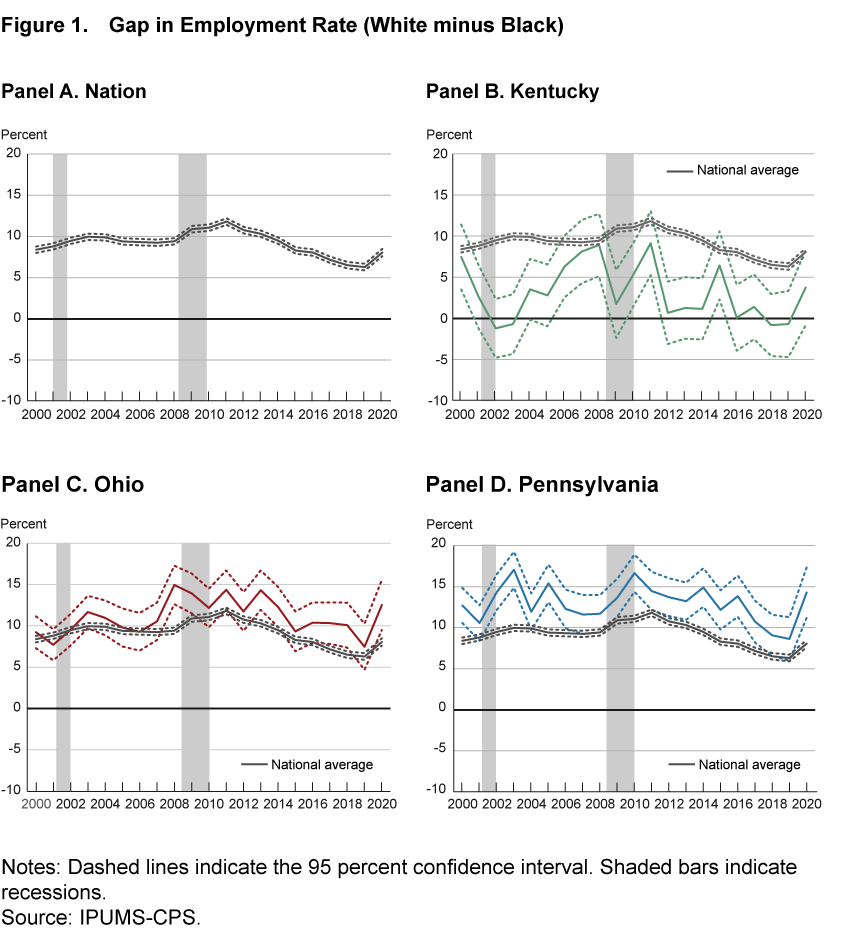
Changes in the gap over the business cycle stem from larger movements in Black employment than in white employment. For example, the BW gap widens during the 2001 recession because the Black employment rate declined more than the white employment rate: Black employment fell 2.9 percentage points while white employment fell 1.8 percentage points. Likewise, the BW gap narrows during the expansion from 2003 to 2007 because the Black employment rate increases more than the white employment rate (1.3 percentage points versus 0.5 percentage points, respectively). The same patterns are observed around the Great Recession: During the recession Black employment falls 7.3 percentage points while white employment falls 4.8 percentage points (widening the gap from 2007 to 2011) and during the expansion the Black employment rate increases 9.7 percentage points while the white rate increases 4.2 percentage points (narrowing the gap from 2011 to 2019). In 2020, the BW employment gap widened because Black employment declined 5.7 percentage points and white employment declined 4.0 percentage points. The decreases in the Black employment rate during each of these three recessions were roughly 1.5 times the declines in the white employment rate, while the increases in the Black employment rate were more than 2.3 times those of the white employment rate during expansions.
These cyclical features are less clear in Kentucky, Ohio, and Pennsylvania than in the nation because states differ with respect to the characteristics of their labor markets and the timing and magnitude of their recessions and recoveries. The estimates of the states’ BW gaps reflect these differences, which can obscure the underlying cyclical patterns. The larger confidence intervals associated with the limited sample sizes also make it harder to see what is happening. However, in spite of these issues, the data show that the cyclical features of the BW employment gaps are still present in these three states.
In Kentucky, the BW gap in employment is relatively small. That is because Kentucky has one of the lowest white employment rates in the country (5.2 percentage points lower than the national rate, on average), while the Black employment rate is on par with the nation’s. The cyclical pattern of the BW gap in Kentucky was somewhat different from the nation’s: The gap widened during the mid-2000s (during the US expansion), the opposite of the national pattern; yet, consistent with the national pattern, the BW gap does appear to have gotten smaller in Kentucky since 2010.7
Ohio’s BW employment gap more closely follows the national pattern; it is statistically indistinguishable from the national gap throughout the period examined with a few exceptions. Ohio’s gap is wider than the nation’s in 2008, 2013, 2018, and 2020 because Black employment rates are more than 3 percentage points lower in Ohio than in the nation in those years. In Ohio the cyclical pattern of the BW gap is evident as it changes over the business cycle, and the changes are statistically significant.
In Pennsylvania, the BW gap tends to be larger than the nation’s as the Black employment rate is generally lower than the nation’s (2.4 percentage points lower, on average). As in Ohio, Pennsylvania’s BW gap is clearly cyclical: we observe statistically significant changes in the BW gap over the business cycle. Interestingly, the BW gap in Ohio begins to widen in 2007, while Pennsylvania’s does not begin to increase until 2009, potentially reflecting the strength of each state’s economy heading into the Great Recession or the possibility that the recession started later in Pennsylvania.
Labor Force Participation
The employment rate has two underlying components—the labor force participation rate and the unemployment rate.8 The BW gap in the labor force participation rate reflects more of a longer-term perspective that is less sensitive to the business cycle, and as a result, it allows one to see to what degree economic inclusion as reflected in the labor market is impacted by longer-term trends. The BW gaps for the nation, Kentucky, Ohio, and Pennsylvania are presented in figure 2.
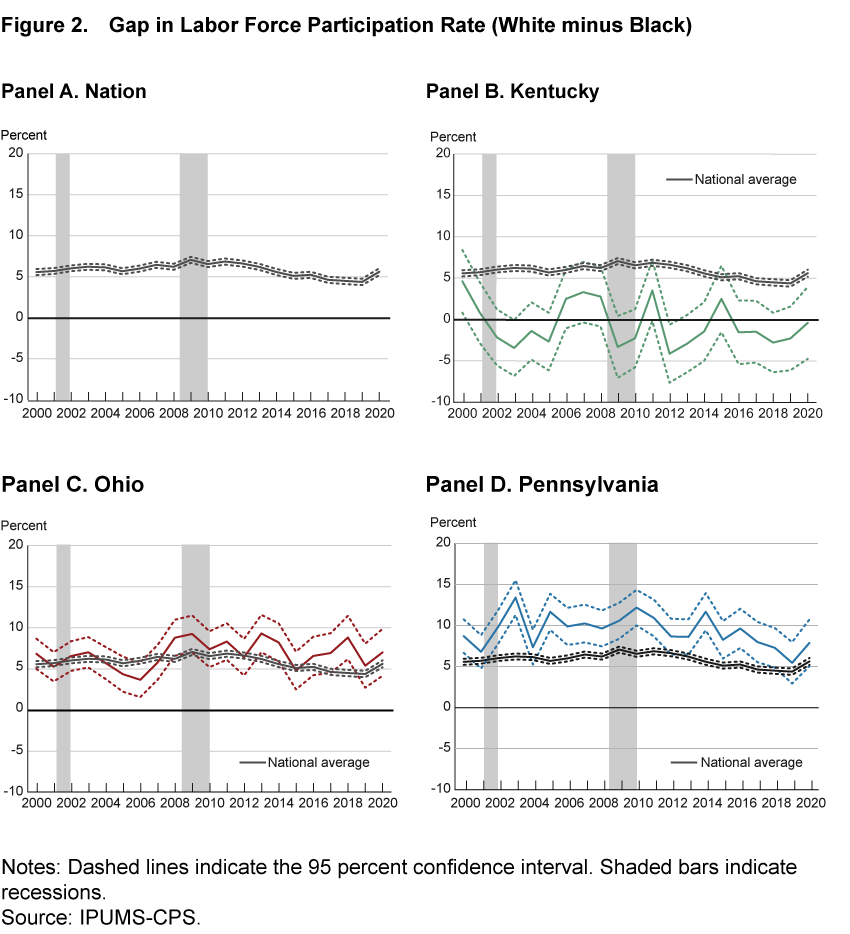
Nationally, the BW participation gap widened during the 2000s, from 5.5 percentage points in 2000 to 7.1 percentage points in 2009, as Black participation rates declined more than white participation rates. Black participation rates fell 3.9 percentage points over the period (from 72.7 percent to 68.8 percent) and white participation rates fell 2.4 percentage points (from 78.3 percent to 75.9 percent). During the 2010s, the BW gap steadily narrowed to a 4.4 percentage point difference in 2019 as Black participation rates increased more than white participation rates (2.3 percentage points versus 0.1 percentage points, respectively). In 2020, the BW participation gap widened as Black participation (−2.3 percentage points) declined more than white participation (−1.1 percentage points). In terms of economic inclusion, the trend in labor force participation suggests that, even with the widening of the gap in 2020, racial disparities in the labor market have lessened over the past decade.
The BW gaps in labor force participation rates in the three Fourth District states somewhat follow the national trend.
Pennsylvania’s BW gap behaved differently from the nation’s in the first decade of the sample period, but it followed the national trend during the 2010s. In the early 2000s, the gap bounced around before it stabilized for the rest of the decade. During the 2010s, Pennsylvania’s BW gap narrowed to become more in line with the nation’s. The narrowing was the result of Black participation rates increasing more than white participation rates. Black participation rates increased 7.7 percentage points (from 64.1 percent to 71.7 percent), while white participation rates remained stable at roughly 76 percent.
In Kentucky and Ohio, the gaps are relatively stable over the entire sample period from 2000 to 2020. Kentucky statistically and consistently shows a 0.0 percentage point gap over this time period. Ohio’s BW gap is statistically consistent with the nation’s in all but a few years, yet it is appears to be stable because of larger confidence intervals.
Unemployment Rate
The unemployment rate is one of the most utilized indicators for monitoring business cycles because it reliably rises sharply during recessions and declines gradually during recoveries. The BW unemployment rate gaps shown in figure 3 provides the clearest evidence of cyclical patterns.
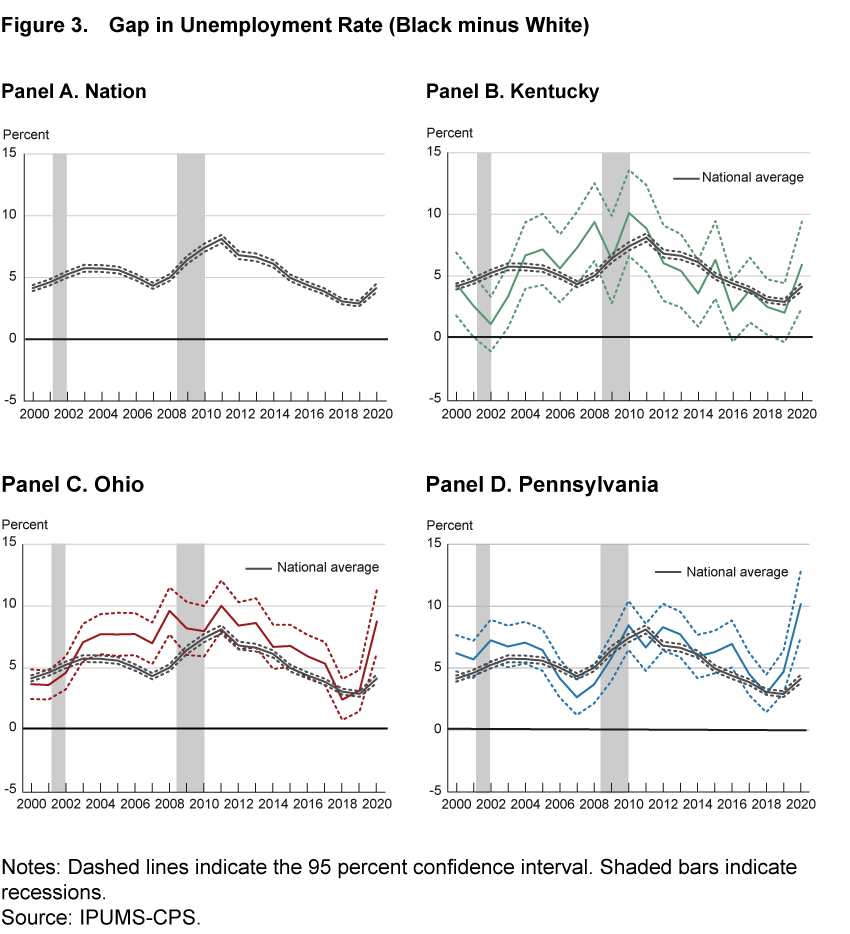
Nationally, the BW gap in the unemployment rate widens during recessions and in the years immediately following recessions. It narrows during expansions. Typically, the BW gap widens because the Black unemployment rate rises more than the white unemployment rate during recessions, and it narrows because the Black unemployment rate declines more sharply during expansions. For example, in the 2001 recession, the Black unemployment rate increased 2.2 percentage points compared to just a 1.1 percentage point increase in the white unemployment rate.
And during the expansion from 2003 to 2007, the Black unemployment rate fell 2.6 percentage points compared to just a 1.1 percentage point decline in the white unemployment rate. It also seems that the depth of the downturn and the length of the expansion play a role in the pace of change in the BW gap. During the Great Recession, the BW unemployment rate gap increased by 3.8 percentage points, while during the shorter and less severe 2001 recession, it increased by just 1.1 percentage points. Similarly, during the most recent expansion, which lasted eight years (2011 to 2019), the BW gap narrowed by 5.2 percentage points, while during the four-year expansion of the mid-2000s (2003 to 2007), the gap narrowed by only 1.4 percentage points. In 2020, the BW unemployment gap jumped to 4.1 percentage points because the increase in Black unemployment (5.2 percentage points) was higher than the increase in white unemployment (4.0 percentage points).
The BW unemployment rate gaps in Kentucky, Ohio, and Pennsylvania are more often than not statistically indistinguishable from the national trend during this time period; however, there are a few statistically significant variations during the 2000s that are worth mentioning.
In Kentucky, the BW gap widened from 2002 to 2008, a situation which is contrary to the national pattern, as Black unemployment increased from 6.7 percent to 15.1 percent, while white unemployment remained stable at 5.5 percent.
In Ohio, the BW gap widened from 2001 to 2004 and then remained stable rather than narrowing like the national pattern. Ohio’s BW gap remained larger than the nation’s on average because of a markedly higher Black unemployment rate in the state, 3.9 percentage points higher on average than the national Black unemployment rate from 2006 to 2008.
In Pennsylvania, the BW gap was stable from 2000 to 2005 and narrowed sharply thereafter, as the Black unemployment rate declined by 4.3 percentage points, more than 2.5 times the 1.6 percentage point decline of the national average for Black unemployment. Following the Great Recession, the gap narrowed in all three states as Black unemployment declined more than white unemployment.
In 2020, the BW unemployment gap widened sharply in all three states, as Black unemployment rose more than 2.4 times faster than white unemployment in each state.
Earnings
BW gaps in earnings provide a fuller picture of economic inclusion in the labor market. Figure 4 shows the BW gap in real median hourly earnings for the nation, Kentucky, Ohio, and Pennsylvania.8 Unlike the cyclical patterns observed in employment, unemployment, and labor force participation, the national BW gap in earnings has steadily increased since 2000. In 2000 the BW gap in earnings was $3.16 and in 2018 it peaked at $4.64. Since then, it has declined, reaching $3.94 in 2020. Stated differently, Black workers earned 83 cents and 82 cents for every dollar white workers made in 2000 and 2020, respectively. Increases in the BW gap from 2000 to 2020 are observed because real median earnings for whites increased more than real median earnings for Blacks during the period, with earnings for whites rising by $3.03 (15.9 percent) compared to an increase of $2.25 (14.2 percent) for Blacks.
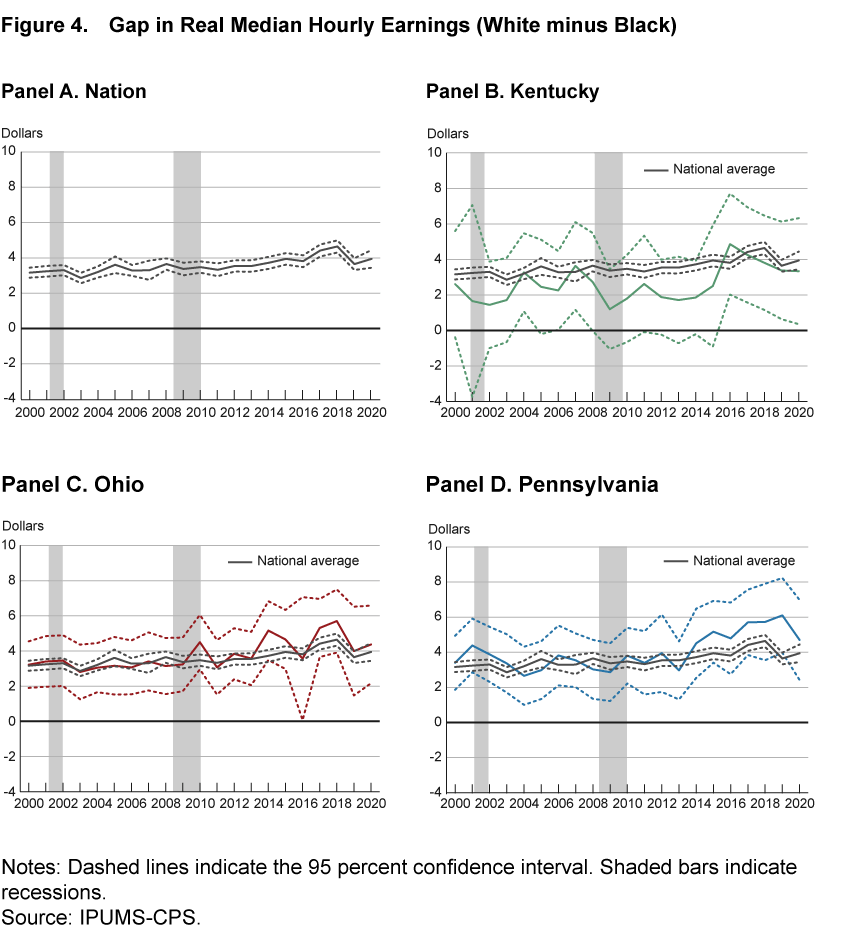
In Kentucky, the BW gap in real median hourly earnings has remained relatively constant at roughly $2.60 on average over the period. In Ohio and Pennsylvania, the gaps started off similar to Kentucky’s in 2000 but have widened since then, by $1.15 and $1.30, respectively. However, the large confidence intervals indicate that there has been no statistically significant change in each state’s BW gap in real median hourly earnings from 2000 to 2020. The less precise estimates stem from smaller sample sizes; only outgoing rotation groups report earnings.9 The larger confidence intervals also make each state’s estimate statistically indistinguishable from the national estimate.
National and State Levels of Economic Inclusion as of 2020
In this section, I explore further whether measures of economic inclusion differ across US states. To do so, I focus on levels of the BW gaps in labor market outcomes a single year, 2020, for 35 states that have an average Black sample size greater than 500, our criterion for inclusion in the analysis.
Employment
Panel A of figure 5 presents point estimates and the 95 percent confidence intervals for the BW gap in the employment rate. The variation in BW gaps across states indicates that the level of economic inclusion varies across states. Kentucky has one of the smaller BW gaps, even when factoring in the confidence intervals; Kentucky’s gap is smaller than the gaps in 10 states. However, even though Kentucky’s point estimate (3.7 percentage points) may indicate that Blacks are actually being excluded, when one considers the 95 percent confidence interval (plus or minus 4.6 percentage points) there are no statistical differences in Black and white employment rates.
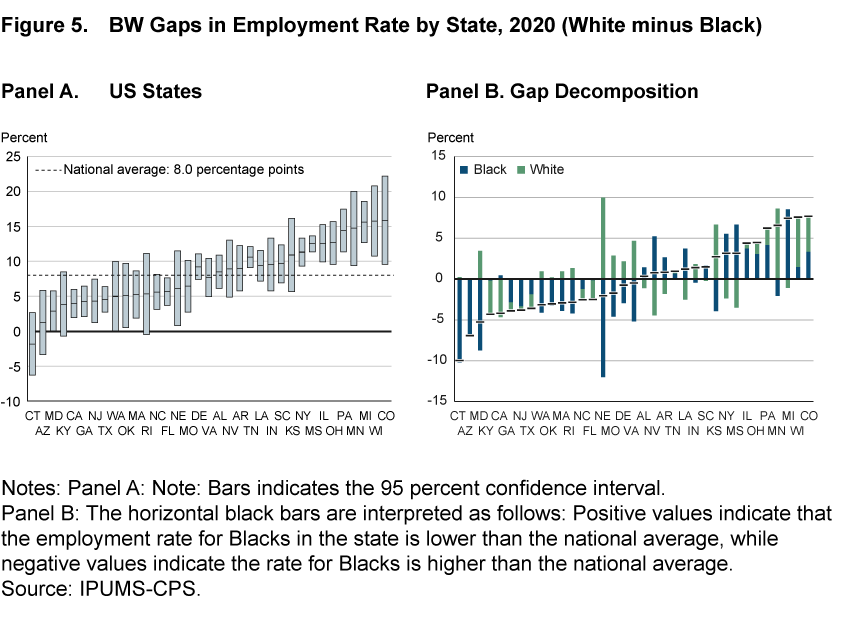
Panel B of figure 5 breaks down state deviations from the national BW employment gap into those that are attributable to differences in the Black and white employment rates. For example, the green bar indicates that in Kentucky the white employment rate is 4.1 percentage points lower than the national average, while the blue bar indicates that the Black employment rate is 0.2 percentage points higher than the national average. Thus, Kentucky’s below-average BW gap is primarily the result of the state having a lower white employment rate than the national average in 2020. Ohio’s BW gap of 12.5 percentage points (plus or minus 3.0 percentage points) and Pennsylvania’s gap of 14.2 percentage points (plus or minus 3.0 percentage points) are statistically larger than the national average of 8.0 percentage points and the gaps in most other states in 2020. Connecticut stands out in panel A as having the smallest BW employment rate gap, and panel B shows that the state’s small BW gap is mostly due to above-average Black employment rates. Interestingly, Connecticut’s small BW employment gap does not translate to earnings-based measures, as Connecticut has the largest BW earnings gap (see below).
Further research is necessary to better understand why different patterns exist in different states’ labor markets, but evidence presented below on the differences in labor force participation and unemployment rates (there is a little more variation across states in BW participation gaps than in unemployment gaps) implies that the gaps in employment are mostly due to differences in BW participation rates. Participation rates are less cyclical, and changes over time happen more slowly.
Labor Force Participation
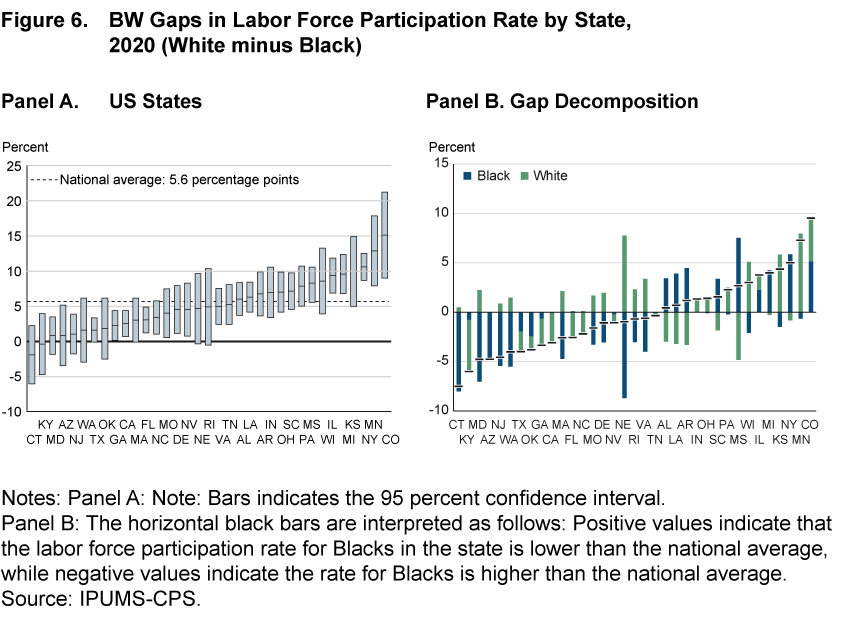
Panel A of figure 6 shows the point estimates and95 percent confidence intervals for the BW gaps in the labor force participation rate in 35 states in 2020. Panel B breaks down state deviations from the national BW labor force participation gap into those that are attributable to differences in the Black and white rates. Again, the variation in BW gaps across states indicates that the level of economic inclusion differs across states. Kentucky has one of the smallest BW gaps (−0.3 percentage points, plus or minus 4.3 percentage points) because the white participation rate in the state is lower than the national average (69.1 percent versus 74.3 percent) and the Black participation rate is higher (69.4 percent versus 68.7 percent). Factoring in confidence intervals, Kentucky’s BW participation gap is statistically smaller than the gaps in 12 of the 35 states examined. Ohio’s BW gap of 7.0 percentage points (plus or minus2.8 percentage points) and Pennsylvania’s gap of 7.9 percentage points (plus or minus 2.9 percentage points) are statistically similar to the national average of 5.6 percentage points and the gaps of most states in 2020. Colorado has a larger BW gap in the labor force participation rate because the white participation rate is higher than the national average and the Black participation rate is lower. In a few states (New York, Michigan, and Mississippi), wide BW gaps are the result of Black participation rates that are more below average than white participation rates.
Unemployment Rate
Panel A of figure 7 shows the point estimates and 95 percent confidence intervals for the BW gaps in the unemployment rate in 35 states in 2020, and panel B breaks down state deviations from the national BW unemployment rate gap into those that are attributable to differences in the Black and white rates. Again, the variation in BW gaps across states indicates that the level of economic inclusion differs across states. However, the estimates and 95 percent confidence intervals indicate that Kentucky’s BW gap of 5.9 percentage points (plus or minus 3.5 percentage points) is statistically similar to the national average of 4.1 percentage points and the gaps in most states in 2020.
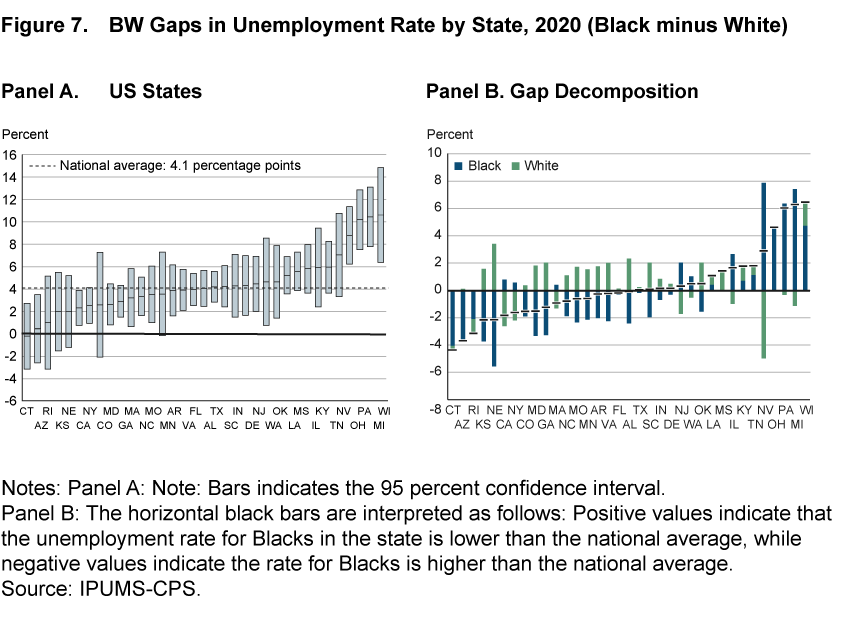
Ohio’s gap of 8.8 percentage points (plus or minus 2.6 percentage points) and Pennsylvania’s gap of 10.2 percentage points (plus or minus 2.7 percentage points) are statistically larger than the national average and the gaps in most states in 2020. Connecticut has one of the smaller BW unemployment rate gaps because Black unemployment is markedly lower in the state than the national average. Conversely, states with wider BW gaps (Wisconsin, Michigan, Pennsylvania, and Ohio) have Black unemployment rates that are much higher than the national average.
Earnings
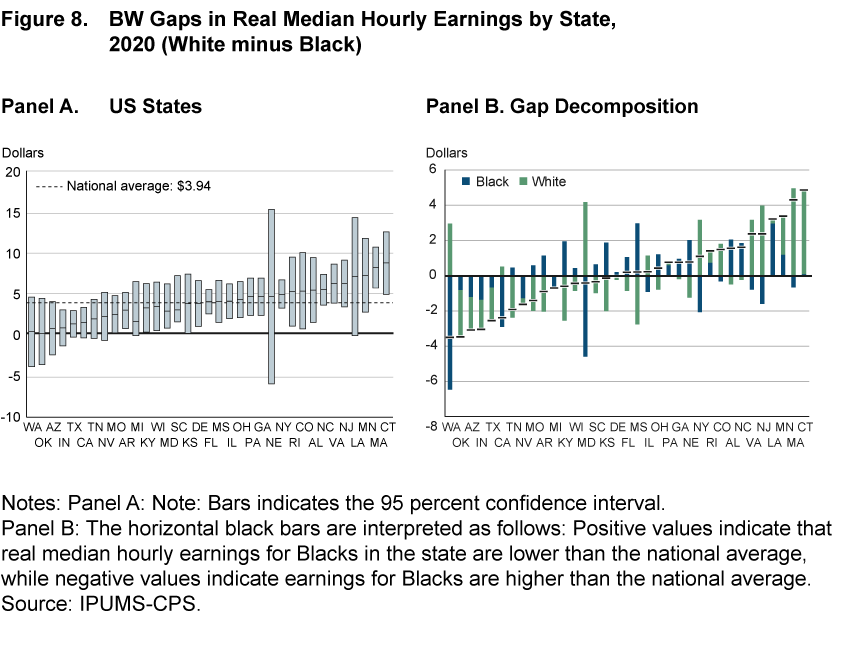
Panel A of figure 8 presents the point estimates and the 95 percent confidence intervals for the BW gap in real median hourly earnings for 35 states in 2020. Again, the variation in BW gaps across states indicates that the level of economic inclusion differs across states. The BW earnings gap in Washington is $0.44, while the gap is $8.81 in Connecticut. Kentucky’s BW gap of $3.34 (plus or minus $2.98), Ohio’s gap of $4.37 (plus or minus $2.21), and Pennsylvania’s gap of $4.70 (plus or minus $2.28) are statistically similar to the national average of $3.94 and the gaps in most states in 2020. Panel B breaks down state deviations from the national BW earnings gap into those that are attributable to differences in Black and white earnings. Notice in panel B that states at the low end of the distribution largely have white earnings that are lower than the national average, while those at the high end have white earnings that are higher than the national average. In fact, the variation in BW earnings gaps across states is predominately driven by white earnings in 57 percent of the states.
Conclusion
This analysis shows that Fourth District states generally mirror national economic inclusion trends in the labor market. It illustrates that even though labor market status-based measures of economic inclusion indicate some progress in closing the BW gaps over the past decade, the BW gap in earnings grew over this period. The data highlight that the cyclical nature of BW gaps—which widen during recessions and narrow during expansions—is largely a function of greater movement in the Black labor market experience as opposed to the white labor market experience. Conversely, when comparing the levels of BW gaps across states in 2020, one sees that BW gaps reflect differences in both the Black and white labor market experience. Further research may be able to provide a better understanding of why states’ labor market outcomes differ by race.
See These Measures for Individual States
You can find these measures charted for each of the 35 states on our website at:
Labor Market Inclusion by State
Explore other related measures, data, and research on our site:
Program on Economic Inclusion
Footnotes
- The authors note that the cyclical nature of racial disparities exists because Blacks are at a higher risk of employment loss when economic activity slows. Return to 1
- Estimates for Alaska, Washington DC, Hawaii, Iowa, Idaho, Maine, Montana, North Dakota, New Hampshire, New Mexico, Oregon, South Dakota, Utah, Vermont, West Virginia, and Wyoming are not included. Return to 2
- Black and white Hispanics are included in this sample. Return to 3
- The 95 percent confidence intervals are calculated using standard error; sample mean +/− (1.96 x standard error). Return to 4
- The Bureau of Labor Statistics (BLS) also reports Black and white unemployment rates in some states via Local Area Unemployment Statistics (LAUS). However, reporting is limited to annual average rates for minority unemployment rates in states with substantial minority samples. The LAUS estimates are model-based, but where estimates are available, they are similar to my survey-based estimates even though I am looking at working-age populations rather than all ages as the BLS does. Return to 5
- The BW employment gap is considerably smaller for persons older than 64 years of age. Return to 6
- Ultimately, one should use caution when interpreting Kentucky’s estimates as they are based on relatively small sample sizes; there are an average of 974 Black observations per year in Kentucky compared to 3,016 in Ohio and 2,738 in Pennsylvania. For example in 2017, while the estimate in figure 1, panel B (solid line) indicates a BW gap of 1.4 percentage points, the 95 percent confidence interval (dashed lines) indicates that the true value is between −2.5 percentage points and 5.3 percentage points. Return to 7
- The employment rate is equal to the product of the participation rate and one minus the unemployment rate. Return to 8
- For more information see: https://cps.ipums.org/cps/outgoing_rotation_notes.shtml. Return to 9
- Measured in 2020 dollars using the consumer price index research series. Return to 10
References
- Cajner, Tomaz, Tyler Radler, David Ratner, and Ivan Vidangos. 2017. “Racial Gaps in Labor Market Outcomes in the Last Four Decades and over the Business Cycle.” Board of Governors of the Federal Reserve System, Finance and Economics Discussion Series, no. 2017-071. https://www.federalreserve.gov/econres/feds/files/2017071pap.pdf.
- Flood, Sarah, Miriam King, Renae Rodgers, Steven Ruggles, and J. Robert Warren. Integrated Public Use Microdata Series, Current Population Survey: Version 8.0 [dataset]. Minneapolis, MN: IPUMS, 2020. https://doi.org/10.18128/D030.V8.0.
Suggested Citation
Fee, Kyle D. 2021. “Economic Inclusion 2000–2020: Labor Market Trends by Race in the US and States.” Federal Reserve Bank of Cleveland, Economic Commentary 2021-06. https://doi.org/10.26509/frbc-ec-202106
This work by Federal Reserve Bank of Cleveland is licensed under Creative Commons Attribution-NonCommercial 4.0 International

